STAY IN THE WAVE TO CATCH THE WAVE - THE ART OF RANGE MANAGEMENTHey Everyone,
Here at GVFX, we are currently buying dips. What that means is that we buy on the dips and therefore only concentrate on long positions/buys. As mentioned before, having both sell and buy positions open in your account will affect your psychology and in turn, your trading decisions.
Now a question that typically arises here is why would it still be advisable to buy when the market is pushing down? Firstly, let me assure you that the same algorithms, experience and strategies that we use with our bullish directional bias also gives us the heads up, or down if you will, on when the market is going down. Don't think for a moment that we only know how to analyse a bull market or up trends. We share trade ideas for both Bullish and Bearish moves but choose not to hedge out of choice.
In my experience, it is much safer to get out of a stuck buy position than a stuck sell position. That's not to mention the clean PSYCHOLOGICAL PROFILE that is achieved when trading in just one direction. And although hedging can in theory work, it requires years of experience and in the end, is simply not worth the effort and psychological stress.
Let us look at an example of the current short/mid term trend to further highlight this point. When you have short-term bearish momentum down, we take buys from key supports or MAs which act as dips. Remember that the market does not go up or down in a straight line (with the rare exception of short-lived parabolic moves). So, when the market is going down and hits one of our key levels, a buy from that point will go back up for 30 to 40 pips (this number of pips has been calibrated based on back testing) before resuming back down.
You can think of it like this. The market moves in a zigzag manner. The zig is that part of the leg which is going down to create lower lows (if the downward trend is continuing). The zag is that part of the leg which takes a breather and pushes back up with momentum for our entry and quick pip-take range to create a lower high (if the downward trend is continuing) before heading back down again. We catch the right and safest waves (buys) in and out and surf to success. When price hits a key structural support or stops creating lower lows and lower highs, we then reassess for entries with a wider range of pip capture.
Hope this post helps our followers to understand how we ride waves by staying committed to one direction in order to always fall naturally into the wave rather then chasing a wave!!
GoldViewFX
Trade ideas

Gold’s Inverse Head and Shoulders PatternThe price has been dropping steadily and consistently so far. Check out my previous analysis:
Or click on the attached idea on my chart.
But here’s the thing, momentum is starting to shift.
If you look closely, you'll see that we’re forming an inverse Head and Shoulders pattern. We have the first low, the left shoulder. Then, a deeper low, the head. And finally, a slightly higher low, the right shoulder.
Right now, price is sitting just above that downward-sloping neckline, which is a clear sign that momentum is beginning to change, and there are few obstacles in its way.
My expectation is for a pullback to retest the neckline, filtering out any fake moves, before potentially pushing upward toward 4,085. If the bullish momentum continues with strong volume, I’ll lock into the trend and plan my entry accordingly.
I might even take a buy position here for a more proactive setup. The risk is slightly higher, but with the market structure confirming it, I’m ready to enter because sometimes, the best trades come when you trust your setup.
Just sharing my thoughts on the chart, not financial advice. Always confirm your setup and manage your risk wisely.

Gold Eyes 3,980 Support as Bulls Prepare for the Next Leg HigherHey Traders, in today's trading session we are monitoring XAUUSD for a buying opportunity around 3,980 zone Gold is trading in an uptrend and currently is in a correction phase in which it is approaching the trend at 3,980 support and resistance area.
Trade safe, Joe.

XAU/USD) Bullish trend analysis Read The captionSMC Trading point update
Technical analysis of Gold (XAU/USD) on the 4H timeframe, following Smart Money Concepts (SMC) and structural confluence trading. Let’s break down the full reasoning behind this setup
---
Overall Concept
The chart suggests that Gold is preparing for a bullish breakout after a successful retest of the trendline and demand zone, signaling potential institutional accumulation before a push toward the target level at 4,080.231.
---
Technical Breakdown
1. Market Structure
Price recently broke above a descending trendline, signaling a potential change of character (ChoCH) from bearish to bullish structure.
The higher lows and multiple rejections from the blue demand zone confirm buyer interest.
The small arrow and upward projection illustrate an expected retracement and continuation pattern (impulse → correction → new impulse).
2. Key Levels
Current Price: 4,001.275
50 EMA: 4,003.110 → Price is now testing and starting to close above this level, showing renewed bullish strength.
200 EMA: 3,960.048 → Dynamic support confirming mid-term bullish bias.
Demand Zone (blue area): Around 3,985–3,995 — key zone for re-entries and confirmation of buyer defense.
Target Point: 4,080.231 (aligned with a liquidity zone or prior imbalance area).
3. Confluences
EMA Cross: Price pushing above both 50 and 200 EMA — often a signal of trend reversal strength.
Trendline Retest: The green arrow indicates a successful retest of broken resistance turned support.
Bullish Structure: Higher highs and higher lows forming above the EMAs.
Volume: 101K+ — healthy momentum supporting institutional buy continuation.
4. Expected Scenario
1. Short-term retracement into the blue demand zone or along the ascending trendline.
2. Bullish reaction (engulfing candle or rejection wick).
3. Continuation move toward the 4,080 target zone.
---
Trade Idea Summary
Aspect Detail
Bias Bullish
Entry Zone 3,985 – 3,995 (demand + trendline confluence)
Stop Loss Below 3,960 (under EMA200 and previous swing low)
Take Profit 4,080
Risk-to-Reward (RR) ≈ 1:3 or better
Mr SMC Trading point
---
Confirmation to Watch
Bullish candle close above 4,005 (EMA50)
Rejection from the blue demand zone
Break of short-term high around 4,015 confirming continuation
---
Summary
Gold appears ready for a trend continuation following accumulation above major EMAs and a clean retest of structure. The next impulsive move is projected toward 4,080, aligning with prior liquidity and smart money target areas.
please support boost 🚀 this analysis

THE KOG REPORT - UpdateEnd of day update from us here at KOG:
Well, we wanted to go long into the higher red box but we wanted a better entry for this trade from just a little lower. However, we broke the bias level and as soon as we did, we completed every single target including the 4070 target level given to Camelot. Hard to get in with with the move, but those that did will have done well!
So, what now?
It's a bit of an extreme move and unconvincing at the moment. We're extreme on the liquidity monitor and there is a hot spot above that may just give a RIP. Not saying we're going to correct the move, we have major support below at the 4075 level that will need to break to go lower.
RED BOXES:
BREAK above 4004 for 4010✅, 4014✅ and 4030✅ in extension of the move
BREAK below 3990 for 3985, 3979, 3970 and 3965 in extension of the move
As always, trade safe.
KOG

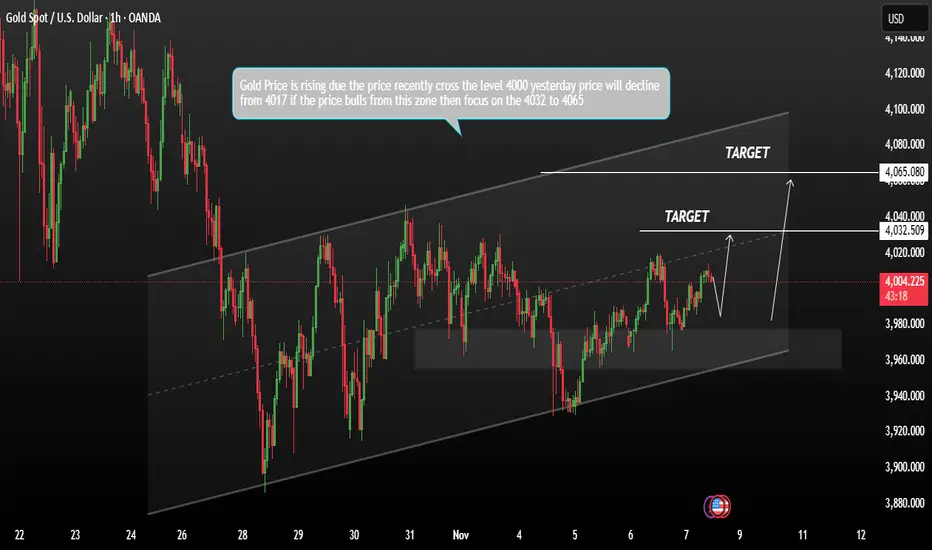
Gold Consolidation Above $4,000 Keeps Bulls in ControlGold continues to consolidate after recently crossing the key psychological level of 4,000, maintaining a bullish bias. The metal’s ability to hold above this zone suggests ongoing strength, with traders now focusing on the 4,032–4,065 resistance range.
On Friday, gold prices advanced as expectations for further Federal Reserve rate cuts increased and concerns over the U.S. economic outlook persisted amid the prolonged government shutdown Interestingly, both the U.S. dollar and gold are rising simultaneously — a sign that the traditional inverse correlation is weakening. This indicates that bullish sentiment in gold remains resilient, as buyers step in to prevent a sharp pullback.
Overall, gold appears to be in a consolidation phase above 4,000, with momentum building for a potential breakout. However, a decisive move above 4,065 would be needed to the next bullish leg higher.
You may find more details in the chart.
Trade wisely best of Luck Buddies,
Ps; Support with like and comments for better analysis Thanks for Supporting.
XAU/USD) Bullish trend analysis Read The captionSMC Trading point update
technical analysis of Gold (XAU/USD) on the 4-hour timeframe. Let’s break down the technical analysis presented:
Overall Idea
The analysis suggests that Gold is likely to continue its upward movement after a possible short-term retracement. The chart projects a move toward the target point at 4,160.549.
---
Key Technical Elements
1. Break of Structure / Trendline Break
A descending trendline (black) has been broken to the upside, signaling a potential trend reversal from bearish to bullish.
The breakout candle is strong and supported by volume, confirming bullish momentum.
2. Fair Value Gap (FVG) Zone
A Fair Value Gap (blue box) has been marked where price may retrace to fill imbalance before continuing higher.
This FVG area also aligns with the previous resistance turned support, adding confluence for a bullish continuation.
3. Exponential Moving Averages (EMAs)
EMA 50 (blue): 4,016.295
EMA 200 (black): 3,965.661
Price has crossed above both EMAs, indicating a strong bullish trend shift.
A bullish EMA crossover may be forming, further confirming upward bias.
4. Projection Path
After a short retracement into the FVG zone, the expected price structure shows:
A bounce upward forming higher highs.
The final target zone is projected at 4,160.549, where a potential take-profit level lies.
---
Target and Confirmation
Target Point: 4,160.549
Retracement Zone (Buy Area): Within the blue FVG zone (around 4,060–4,080 range).
Confirmation: Watch for a bullish reaction (e.g., bullish engulfing or rejection wicks) within the FVG zone before entry.
---
Risk Considerations
If price closes below the FVG or drops back under 4,016 (50 EMA), it could invalidate the bullish continuation setup.
Fundamental catalysts like U.S. Dollar strength or economic data releases could cause volatility and affect momentum.
Mr SMC Trading point
---
Summary:
This analysis outlines a bullish continuation setup on Gold, expecting a pullback into the FVG for liquidity collection before resuming upward momentum toward 4,160.549.
Please support boost 🚀 this analysis

The Formula to Make $10000 Daily👋 Hello traders!
If you’re looking for a real way to make $10000 every day from the markets, forget about the so-called magic strategies or secret expert tricks.
The truth is simple: there’s no overnight success formula. But there is a realistic path built on probability, discipline, and time — and that’s what I call The Formula to Make $10000 Daily .
⚙️ Step 1: Build a High-Probability Trading System
📊 This is your foundation.
A good trading system doesn’t have to be complex, but it must have clear rules and consistent logic .
You should always know:
✅ When to enter a trade
✅ When to stay out
✅ And most importantly — why you’re entering
Choose a strategy you can truly master and apply consistently — such as Break & Retest , Supply & Demand , or Market Structure Shift .
Every trade should have a Risk-to-Reward ratio (R:R) of at least 1:2 or higher.
💡 Example:
If you risk $2000 per trade and win just two out of three trades daily, you’ll make $4000.
Increase your lot size gradually and stay consistent — $10000 a day becomes a realistic outcome.
💼 Step 2: Capital Management – The Key to Survival
🧠 You can’t make $10000 daily if you lose $10000 in one bad trade.
Capital management isn’t just about protecting your balance — it’s about protecting your mindset and system.
Follow these golden rules:
💰 Risk only 1–2% per trade
🛑 Always use a stop loss
🎯 Set a clear take-profit target
With a $50,000 account, risking 1% equals $5000.
If your R:R ratio is 1:3, one winning trade a day earns $15000.
That’s not luck — that’s mathematics working in your favor .
🧘♂️ Step 3: Master the Trader’s Mindset
Once you have a solid system and money management plan, the final piece — and the most important — is your psychology .
Most traders don’t fail because their system is bad. They fail because they can’t control themselves .
Keep these principles close:
🚫 Don’t trade when emotions take control
🚫 Don’t revenge trade after losses
🚫 Don’t increase lot size out of greed
🚫 Don’t force yourself to take trades every day
A professional trader doesn’t aim to win every trade — they aim to lose less and lose smart .
🧩 The Real Formula
💎 (High-Probability System + Strict Risk Management + Strong Psychology) × Time = Sustainable Profit
There are no shortcuts.
No magic indicators.
Only you and your discipline .
📖 Real Story
One of my students, Ken, started with a $10,000 account.
He didn’t try to go big — instead, he aimed to earn 1% a day , or $1000.
After six months, by slowly increasing his trade size and staying disciplined, his average daily profit reached $10000 .
He told me:
“I didn’t need to change my system. I just needed to change myself.”
🎯 Final Thoughts
The formula to make $10000 daily doesn’t come from any special indicator, signal, or secret course.
It comes from understanding your system deeply, managing your capital wisely, and staying disciplined every single day .
💬 The market doesn’t reward the fastest traders. It rewards the most patient, consistent, and focused ones.
If you’re on your journey to becoming a professional trader, start today.
🔥 Build your own formula — and practice it every single day until it becomes second nature.

Gold’s Calm Before the Storm – Triangle Ending Soon!Over the past 10 days , many traders—especially those working on 15-minute and higher timeframes—might have found Gold a bit tedious as it's been somewhat range-bound.
Right now, Gold ( OANDA:XAUUSD ) is sitting in a Support zone($4,004 – $3,895) and is also relatively close to a Resistance zone($4,046 – $4,004) .
From a Classical Technical Analysis standpoint on the 1-hour timeframe, it looks like gold has formed a Symmetrical Triangle and it's currently moving near the upper line of this triangle. Additionally, there's a small ascending channel that has formed over the last couple of days, which is something to keep in mind.
In terms of Elliott Wave theory, Gold might be forming a Contracting Triangle that could be completed by the time it finishes wave E.
I expect that Gold may decline at least to the lower line of the symmetrical triangle in the coming hours. If it breaks that lower line , we might see further downside and a clearer direction for gold’s main movement. Otherwise, it could bounce again.
Second Target: $3,913
Stop Loss(SL): $4,04(Worst)
Please respect each other's ideas and express them politely if you agree or disagree.
Gold Analyze (XAUUSD), 1-hour time frame.
Be sure to follow the updated ideas.
Do not forget to put a Stop loss for your positions (For every position you want to open).
Please follow your strategy; this is just my idea, and I will gladly see your ideas in this post.
Please do not forget the ✅ ' like ' ✅ button 🙏😊 & Share it with your friends; thanks, and Trade safe.

Wall Street Weekly Outlook – Week 46 2025 (Nov 10 – Nov 14)📊💥 Wall Street Weekly Outlook – Week 46 2025 💥📊
+ High Probability SMA/EMA Cross-Over Strategy! 💥
📅 November 10 – November 14, 2025
The new trading week is dominated by one crucial question:
Are we heading toward a larger year-end correction in equities, or does the market shift back into risk-on mode? 🚀📉📈
In this video, I break down the most important market drivers for the weeks ahead. 🎥📊
Lean back and get a structured overview of which levels matter now, how hedge funds are adjusting their exposures, and which setups look most attractive from a mean-reversion perspective. 🧠💼
💡 Bonus Lessons:
EMA/SMA cross-over strategy for equities, three key macro focus themes, and actionable mean-reversion setups. ⚡️
📘 Topics covered in this weekly outlook:
+ SMA/EMA Cross-Over Strategy 🧠💼
Best,
Meikel

XAU/USD) Bullish trend analysis Read The captionSMC Trading point update
Technical analysis of XAU/USD (Gold) on the 1-hour timeframe. Here’s a detailed breakdown of the idea:
---
Context & Structure
The market has been in an uptrend, confirmed by a strong impulsive leg upward.
The current pullback retraced into a key demand zone (highlighted blue box), aligning with:
The 0.705 – 0.79 Fibonacci retracement zone, often a high-probability reversal area.
The EMA(50) at 4,092, which provides dynamic support.
---
Key Technical Elements
1. Demand Zone (Blue Box):
Price has tapped into the discount area of the previous bullish move. This area is expected to attract buyers.
2. Fibonacci Confluence:
The retracement aligns with the 70.5–79% zone, suggesting potential exhaustion of the pullback.
3. EMA Support:
EMA(50) and EMA(200) are both trending upward, reinforcing bullish structure continuation.
4. Liquidity Sweep:
The lower wick into the demand zone may represent a liquidity grab before the next bullish leg.
---
Projected Scenario
Expected reaction: bullish rejection from the 0.705–0.79 zone.
Price is anticipated to form a short-term higher low and then continue upward.
Target Point: 4,161.261 — aligns with the prior swing high / equal highs liquidity area.
---
Trade Idea Summary
Bias: Bullish continuation
Entry Zone: 4,100–4,090 area (within blue zone)
Confirmation: Bullish reversal candle or break of minor internal structure upward
Target: 4,161
Invalidation: Clean break below 4,085 (below demand zone and EMAs)
---
please support boost 🚀 this analysis

XAU/USD | Watch Gold at $4100 – Pullback or Continuation Ahead?By analyzing the Gold chart on the 2-hour timeframe, we can see that after the last analysis, the price dropped from $3997 to $3984, then quickly found strong demand and started a powerful rally, breaking the $4040 resistance.
At the moment, Gold has reached the $4100 zone. A short-term pullback from this level is likely, but after a brief correction, I expect the uptrend to continue. The next bullish targets are $4140, $4156, and $4162.
Please support me with your likes and comments to motivate me to share more analysis with you and share your opinion about the possible trend of this chart with me !
Best Regards , Arman Shaban

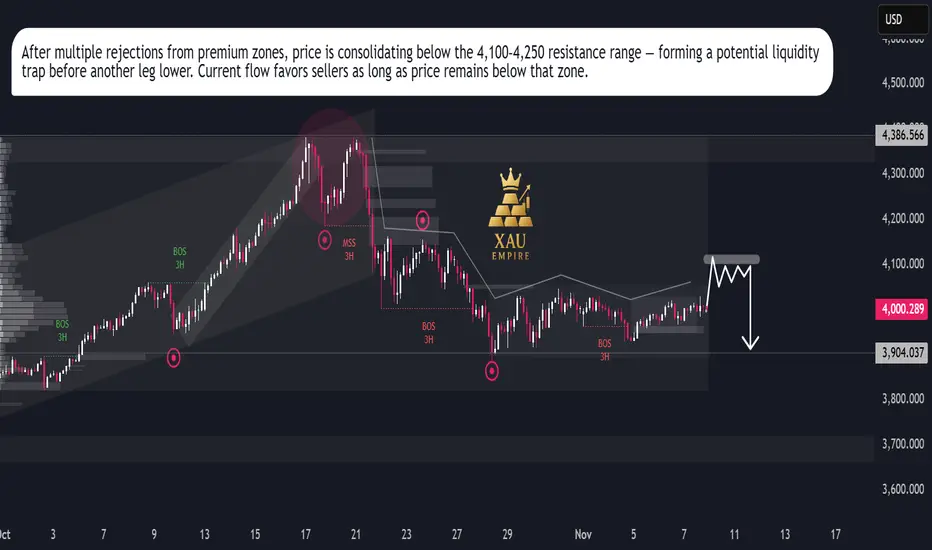
Gold – Distribution Before DropGold – Distribution Before Drop
Gold is showing signs of exhaustion after the recent corrective bounce. The 3H market structure highlights a clear distribution pattern, as price continues to reject from the 4,100–4,250 supply zone. Repeated Break of Structure (BOS) signals that bearish momentum remains dominant.
Institutional activity suggests that liquidity is being built above local highs, preparing for another downside leg. The current market sentiment stays bearish as long as price trades below the key premium area. A confirmed rejection from this zone could trigger a decline toward the 3,904 liquidity pool.
Only a breakout and hold above 4,250 would invalidate this scenario and shift bias back to bullish accumulation.
XAUUSD (Gold/USD) Buy Signal – 4H Timeframe
Entry: 4,130
Stop Loss: 4,110
Take Profit: 4,170
Risk–Reward Ratio: 1 : 2
Price is currently retesting the 4,125–4,165 resistance zone after a strong bullish run, showing signs of continuation. A confirmed breakout and close above 4,130 indicate strong buying momentum toward 4,170.
The RSI is around 58–60, suggesting mild bullish strength and room for further upside before becoming overbought. The volume shows rising green bars, confirming that buyers are stepping in and defending the 4,110–4,120 support area.
This setup signals a potential continuation of the bullish trend. Traders can enter at 4,130, place a stop loss at 4,110 to protect against false breakouts, and aim for a take profit at 4,170. If buying pressure increases with RSI climbing above 60 and volume expanding further, the next possible target could be 4,190 with a trailing stop to secure profits.

GOLD H1 – Gold Awaits U.S. PPI Data for Directional Clarity🟡 XAUUSD – Intraday Smart Money Plan | by Ryan_TitanTrader (13/11)
📈 Market Context
Gold is consolidating after a strong impulsive leg, with intraday traders now focused on the upcoming U.S. Producer Price Index (PPI) release — a key inflation metric that often shapes Fed expectations.
• A hot PPI reading could strengthen the USD and trigger a sell-off from premium levels.
• A softer print may weaken the dollar, encouraging another liquidity grab above 4250.
Institutional order flow shows potential for engineered liquidity sweeps around both extremes before the next directional push.
🔎 Technical Analysis (1H / SMC Structure)
• Structure: Still bullish overall, but showing early distribution near the 4250 handle.
• Premium Zone: 4255–4253 aligns with an unmitigated supply and prior buy-side liquidity pool — a prime short setup if price reacts after a liquidity sweep.
• Discount Zone: 4168–4166 sits within the recent FVG and above EMA100 — a valid area for re-accumulation and continuation if price corrects deeper.
• Liquidity: Equal highs at 4255 and lows near 4156 signal potential stop-hunt traps before a decisive move.
🔴 Sell Setup (Premium Reaction Zone)
• Entry: 4,255 – 4,253
• Stop-Loss: 4,265
• Take-Profit Targets:
→ 4,182 (previous BOS zone)
→ 4,148 (mid-range equilibrium)
→ 4,110 (discount reaction zone)
📌 Valid only if price sweeps buy-side liquidity and confirms bearish BOS on M5–M15.
🟢 Buy Setup (Discount Reaction Zone)
• Entry: 4,166 – 4,168
• Stop-Loss: 4,156
• Take-Profit Targets:
→ 4,210 (short-term liquidity pocket)
→ 4,248 (imbalance fill zone)
→ 4,255 (final liquidity target)
📌 Valid only if price mitigates the FVG and reclaims structure with bullish BOS confirmation.
⚠️ Risk Management Notes
• Wait for PPI volatility before entering trades.
• Avoid trading mid-range (4180–4210) – low R/R zone.
• Scale out partials near liquidity points and trail stops post-confirmation.
• Maintain disciplined risk: 1–2% max per setup.
Summary
Gold is in pre-news equilibrium, with both buy- and sell-side liquidity pools clearly defined:
• Sell zone: 4255–4253 (premium reaction area)
• Buy zone: 4168–4166 (discount re-entry area)
Expect engineered liquidity grabs before a decisive move — patience and structure confirmation remain key.
📍Follow @Ryan_TitanTrader for real-time Smart Money updates ⚡

Gold - This bullrun is now over!🚨Gold ( TVC:GOLD ) won't create new highs:
🔎Analysis summary:
All the way back in 2019, Gold confirmed its rounding bottom formation. This breakout was then followed by a major rally of about +200% over the past couple of years. But at this moment, Gold is retesting a major resistance trendline and will therefore end its bullrun.
📝Levels to watch:
$4,200
SwingTraderPhil
SwingTrading.Simplified. | Investing.Simplified. | #LONGTERMVISION

Gold Next zoneGold (XAU/USD) is trading near 4229, holding above support at 4211. A bullish move toward the 4300 target is expected if price breaks above resistance around 4238.

Gold Pullback Toward Demand ZoneGold price is trading above the trend line, showing bullish momentum. A short-term pullback is expected toward the 4205 target area, which aligns with the nearby demand zone and support level.

Gold 4H – Key Liquidity Zones Ahead of US PMI & Fed Commentary🥇 XAUUSD – Weekly Smart Money Outlook | by Ryan_TitanTrader
📈 Market Context
Gold continues to consolidate within a tight 4H range as traders prepare for a week influenced by U.S. PMI releases, Fed speeches, and shifting rate-cut expectations.
Mixed economic signals — including softer labor data but resilient manufacturing prints — have kept gold trapped between supply overhead and stacked demand levels below.
Institutional flows remain cautious, with markets waiting for clarity on the Fed’s stance. This uncertainty often fuels liquidity-driven sweeps, making this week especially favorable for SMC-style setups.
Short-term volatility is expected as price interacts with major liquidity pools on both ends of the range.
🔎 Technical Analysis (4H / SMC View)
• Price is moving within a well-defined range structure, with repeated liquidity grabs on both sides indicating accumulation by larger players.
• The latest 4H ChoCH signals continued hesitation from buyers near the mid-range, hinting that the market may engineer another sweep before committing to a directional leg.
• A significant Premium Supply Zone at 4154–4152 sits just above recent equal highs — an attractive area for liquidity hunts followed by potential short-term distribution.
• Conversely, the Discount Demand Zone at 3907–3909 aligns with previous structural reaction levels and sits below a liquidity shelf, making it an ideal zone for re-accumulation.
• Expect engineered stop-hunts around mid-range liquidity (4000–4016) before a stronger move develops.
🟢 Buy Zone: 3907–3909
SL: 3900
TP targets: 3978 → 4003 → 4016 → 4125
Rationale:
• Discount zone within the current 4H range
• Liquidity resting below the structure lows
• Potential accumulation before the next bullish impulse
🔴 Sell Zone: 4154–4152
SL: 4161
TP targets: 4080 → 4016 → 3978 → 3920
Rationale:
• Premium supply positioned above equal-high liquidity
• Likely area for a sweep before corrective downside
• Confluence with previous 4H structure rejection
⚠️ Risk Management Notes
• Wait for M15 ChoCH or BOS confirmation inside each zone before entering.
• Expect liquidity manipulation around 4000–4016, especially during US session opens.
• Avoid entries 10–15 minutes before major Fed or PMI releases to limit spread expansion.
• Scale partial profits at each structural target to lock in gains while letting runners play out.
✅ Summary
Gold remains in a controlled 4H range with clear institutional footprints above and below the current price.
Smart Money is likely to engineer a move into either the 4150 supply or the 3900 demand before choosing its next major direction.
Both setups offer high-probability opportunities when combined with intraday confirmations.
Stay patient, wait for liquidity sweeps, and respect structure.
Premium sells remain valid at 4154–4152, while discounted buys are favored at 3907–3909.
🔔 FOLLOW RYAN_TITANTRADER for daily SMC setups ⚡

Gold Breaks Out: Bullish Momentum Moves GOLD Above 4025 Gold Breaks Out: Bullish Momentum Moves GOLD Above 4025
Gold is moving exactly in line with our previous projections.
After nearly three weeks of sideways movement, the metal finally broke out with strong bullish momentum, resuming its dominant uptrend. The breakout above the 4025 structure zone confirmed renewed buying pressure, with the price surging sharply during the early hours of the market open.
Interestingly, this rally comes without any major market catalysts. While the U.S. Senate’s progress toward ending the 40-day government shutdown is technically positive for the dollar, gold once again proves that it doesn’t always follow the news narrative.
At this stage, a short-term pullback to retest 4025 would be healthy before the next leg higher. Given the rapid rise from 4000 to 4075, some consolidation is likely before continuation.
Key Targets:
🎯 4135
🎯 4230
You may find more details in the chart!
Thank you and Good Luck!
❤️PS: Please support with a like or comment if you find this analysis useful for your trading day❤️
🎯 Previous analysis:

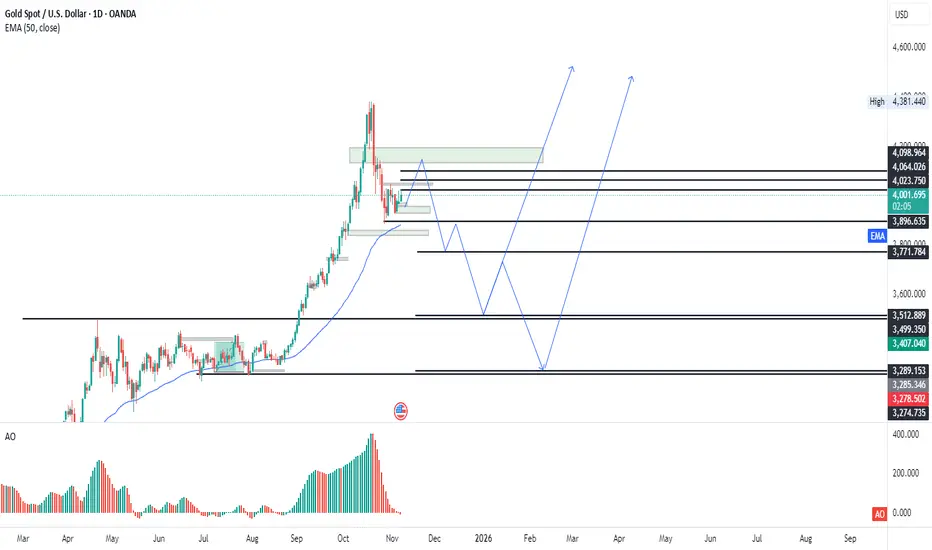
Gold is in correction modeGold is in correction mode so it can drop befor going toward all time high
Hellena | GOLD (1H): SHORT to support area 3925.Colleagues, I believe that at the moment we see a rather complicated situation - the correction is not over yet and we may see a complicated correction. In most probability I see the completion of wave “B”, and the continuation of the downward movement to the support area of 3925.
The “ABC” correction may be completed this week. In any case, I expect the decline to continue.
Manage your capital correctly and competently! Only enter trades based on reliable patterns!

XAU/USD:Capped Below 4,100 as Sellers Eye Breakdown Toward 3,900XAU/USD rebounded from the channel base but remains below the downward trendline and the 4,080–4,100 supply zone. Price is forming lower highs inside a falling channel, with choppy consolidation mid-range.
A sustained move below 4,080 could trigger downside toward 3,900, with 3,827 as an extended target if momentum accelerates. To shift bias, bulls must reclaim and hold 4,100–4,135, which would reopen upside toward 4,200+.
❗️ Risks:
– Break above 4,100–4,135 could squeeze shorts and flip bias bullish.
– Soft U.S. data or risk-off flows may trigger gold strength.
– Event-driven volatility could disrupt intraday structure and positioning.
