XAUUSD (GOLD) – Current Market Analysis
📑XAUUSD (GOLD) – Current Market Analysis
Date: 28 November 2025
Time: 09:20 AM (GMT+6)
---
🖥️ Trend Direction:
Higher Timeframe is still clearly in a bullish structure. Price continues to form Higher Highs, and several protected Strong Lows remain intact below. The 4000–3950 region is a major Higher Timeframe demand zone.
However, in the short-term, the market is positioned where a deeper correction is highly possible. Price has swept the 4185–4200 weak-high liquidity zone. Usually after such a sweep, the market collects liquidity and begins a short-term retracement.
So, the overall HTF bias is bullish, but the intraday bias is currently corrective.
---
🖥️ Technical Analysis:
On the 15M and 1H charts, a strong impulsive bullish rally pushed price directly into 4185–4195.
Below this impulsive move, clean demand zones exist at 4150 and 4120.
Price is currently overextended, where a pullback is normally expected.
The rejection candle at the top indicates buyers are losing momentum (buyer exhaustion).
---
🖥️ Smart Money Concept (SMC):
There is a clear weak-high liquidity pool at 4185–4200.
Price has already swept this liquidity, which is typically a strong signal for reversal or correction.
Draw-to-liquidity zones below:
4150 – fresh Order Block + imbalance
4120 – deeper discount area + equal lows liquidity
According to SMC principles, price is most likely to collect this downside liquidity and retest the demand zones next.
---
🖥️ Fibonacci:
Applying Fibonacci on the impulsive leg from 4120 → 4190:
0.382 retracement = 4150
0.618 retracement = 4125
Both Fibonacci levels align perfectly with the existing demand zones.
This confirms the correction setup from both Fibonacci and SMC perspectives.
---
🖥️ RSI & Volume:
RSI has touched above the 70 overbought zone and then rejected, signaling exhaustion.
During the liquidity sweep, volume spiked, followed by a volume drop — this pattern strongly indicates a correction phase.
---
🖥️ Fundamental Analysis:
Because today is US Thanksgiving, overall liquidity is low and sudden spikes or wicks are more likely.
During low-liquidity days, liquidity sweeps and sharp retracements are common —
which aligns perfectly with today’s technical structure.
---
🖥️ Trading Plan:
⭐ High Probability Sell Setup (Short-Term Correction)
Price has swept the weak-high. Downside correction is now highly probable.
Sell only after CHoCH downside confirmation on the 5M or 15M chart.
Sell Entry Zone: 4185–4200
Take Profit 1: 4150
Take Profit 2: 4125
Stop Loss: 4205 (structure-based)
---
⭐ High Probability Buy Setup (Continuation)
Buy only after a demand-zone retest combined with a bullish CHoCH.
Buy Zone 1: 4150
Buy Zone 2: 4120
Take Profit 1: 4180
Take Profit 2: 4200
Stop Loss: 4110 (structure-based)
Both setups follow the market structure and provide high-probability trading opportunities.
---
Analysis Short Summary:
Gold swept the 4185–4200 weak-high liquidity zone.
The structure is overextended and RSI is overbought, meaning a short-term correction is almost confirmed.
First major support and buy zone is 4150.
Below that, the strong discount zone is at 4120.
The market is likely to follow a clean path:
liquidity collection → correction → demand retest → bullish continuation.
Trade ideas

Taking profit on gold Hello guys! I’ll be taking profit now. Possible chance of a retracement and falling down. Be careful!

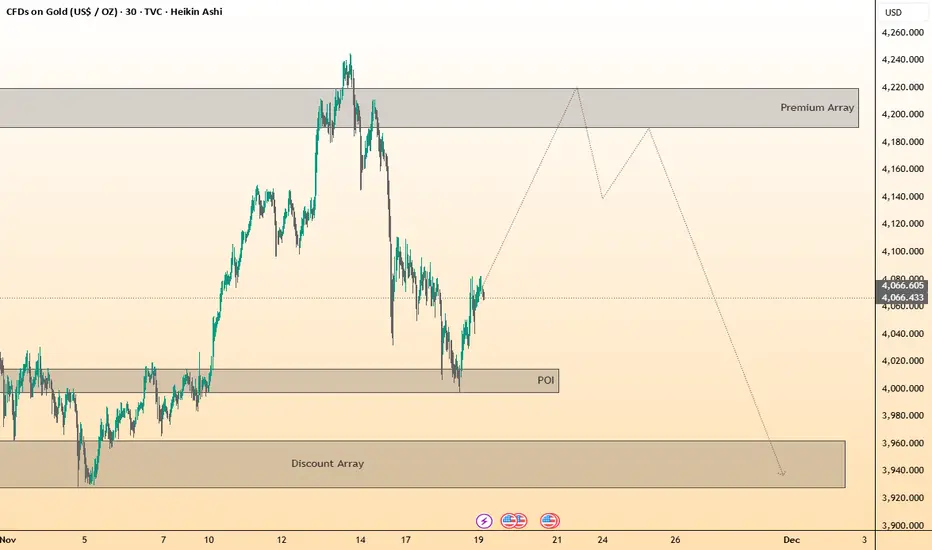
ICT-based structures and expected price projections.Key Elements Visible:
🔹 Current Market Price:
Price is trading around 4066.
🔹 Previous Swing High Zone:
A Premium Array is drawn as a large grey zone around the 4180–4220 area, indicating a potential distribution or sell zone where price may react after grabbing liquidity.
🔹 Previous Swing Low / POI:
A Point of Interest (POI) is marked below, around the 4000–4020 region. This is shown as a discount area where buyers may step in.
🔹 Discount Array:
At the bottom of the chart, a large Discount Array box is shaded, around the 3920–3980 zone, suggesting a deeper liquidity pool or bearish objective if the lower POIs are taken.
🔹 Projected Price Path:
A speculative line (market structure projection) is drawn showing:
A move upwards toward the Premium Array zone
Followed by a sharp reversal downward, targeting the Discount Array
🔹 Market Structure Context:
The current price appears in a retracement phase, attempting to recover from a previous sharp decline.
ElDoradoFx – GOLD ANALYSIS (28/11/2025, ASIA SESSION)1. Market Overview
Gold continues to trade inside a narrowing compression zone, with price hovering around 4156–4158 after reclaiming structure and maintaining support above the prior liquidity sweep 4136–4142. The current positioning suggests indecision beneath macro resistance, with momentum leaning bullish as long as structure remains intact.
Next directional leg will be defined by whether price breaks 4172 or falls back below 4147.
⸻
2. Technical Breakdown
🔸 Daily (D1)
• Price holds a strong base above 4136, rejecting deeper breakdowns.
• Market remains compressed under trendline resistance drawn from swing high.
• Bulls remain controlled while above 4114, with upside continuation on a break above 4172.
• RSI mid-level — expansion potential exists.
🔸 H1
• Trend structure bullish above 4147 with BOS sequence intact.
• Price currently retesting the median zone under 4166–4172 Supply Block.
• A successful breakout here exposes continuation toward 4186–4200.
• Breakdown below 4147 shifts momentum into correction phase.
🔸 15M–5M
• Lower-timeframe push formed a BOS long leg into resistance.
• MACD shows buy momentum but weakening — suggesting pullback before continuation.
• Current intraday range: 4150–4172.
• A liquidity sweep into FVG + Golden Area offers best long entries.
⸻
3. Fibonacci Analysis
Swing Range: 4136 → 4172
Level Price
38.2% 4157
50.0% 4154
61.8% 4150
🟩 Golden Re-Entry Zone → 4157 – 4150
Ideal area for bullish continuation if respected.
⸻
4. High-Probability Trade Scenarios
📈 BUY SETUPS (Primary Bias)
Condition Entry TP Targets SL
Pullback to Golden Zone 4157–4150 4166 → 4172 → 4186 → 4200 4147
Break & Retest Break + Hold above 4172 4186 → 4200 → 4215 4154
⚡ Confirmation Required: BOS + momentum continuation on LTF.
⸻
📉 SELL SETUPS (Countertrend)
Condition Entry TP Targets SL
Reaction from Supply Block 4166–4172 4157 → 4154 → 4150 → 4142 4179
Breakdown Continuation Break + Retest below 4147 4142 → 4136 → 4128 4157
🔻 Valid only if momentum shifts down — no early shorts.
⸻
5. Fundamental Watch
• Asia accumulation suggests London & NY will define expansion leg.
• DXY flat which increases breakout probability later in the session.
• Expect volatility around structural borders — reaction zones more important than prediction.
⸻
6. Key Technical Levels
Resistance Support
4166 / 4172 / 4186 / 4200 4157 / 4154 / 4150 / 4142
Break Buy Trigger: > 4172
Break Sell Trigger: < 4147
⸻
7. Analyst Summary
Gold remains bullish while trading above 4150–4147, with continuation potential to 4172 → 4186 → 4200.
If sellers reject the high block again, price may retrace into 4154–4150 before reloading.
Structural failure below 4147 invalidates the long sentiment and opens downside targets.
⸻
8. Final Bias Summary
Bullish Outlook holds above 4150–4147
Break → 4172 = Expansion.
Break ↓ 4147 = Correction.
⸻
🥇 ElDoradoFx PREMIUM 3.0 – PERFORMANCE 27/11/2025 🥇
⚡ Low-volatility session — still closed green.
📈 BUY +100 PIPS
📈 BUY +40 PIPS
❌ BUY LIMIT -40 PIPS (SL)
⚖️ SELL - BE
📉 SELL +20 PIPS
━━━━━━━━━━━━━━━
▶️ LIVE TRADING SESSION
📉 SELL +70 PIPS
📉 SELL +45 PIPS
📈 BUY +70 PIPS
❌ SELL -40 PIPS (SL)
━━━━━━━━━━━━━━━
💎 SWING TRADES – STILL FLOATING
🔵 BUY → +2,850 PIPS
🟣 BUY → +1,600 PIPS
━━━━━━━━━━━━━━━
📊 PERFORMANCE SUMMARY
💰 Total Pips Gained: +265 PIPS
📈 Win Rate: 75% (6 Wins / 8 Signals)
⚠️ Low volume due to U.S. Bank Holiday, still profitable.
━━━━━━━━━━━━━━━
Even slow markets pay those who stay patient & trade with skill.
Congratulations if you profited! 🔥
— ElDoradoFx PREMIUM 3.0 Team 🚀

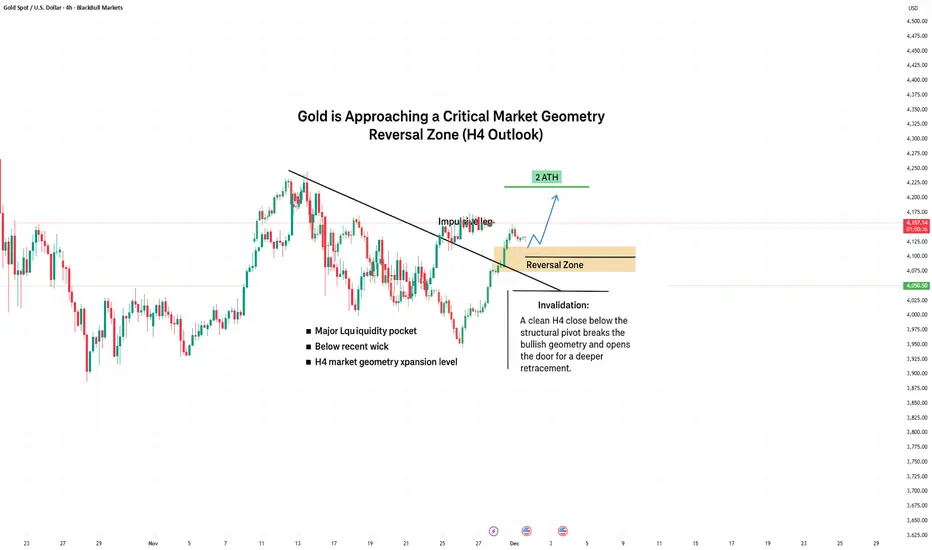
Gold: Geometric Reversal Zone Tested — Market Preparing for the Gold has just reacted strongly from a Major Market Geometry Reversal Zone on the H4 timeframe.
This area combines three powerful technical elements:
• A liquidity pocket below the last corrective wick
• A clean retest of the structural trend axis
• A geometric confluence cluster based on expansion angles
The reaction from this zone signals that buyers are defending the structure with precision.
If price continues to hold above the geometric pivot, the bullish continuation scenario becomes dominant, targeting
2418 → 2440 → 2475, with the possibility of extending toward a new ATH.
What strengthens the bullish case:
• Imbalance creation on the upside
• Liquidity stacked above the previous impulse high
• Shift in momentum after a controlled correction
• Clean, readable structure — something editors love
Invalidation:
A clean H4 close below the geometric pivot breaks the bullish scenario and opens the way for deeper retracement.
This setup is currently one of the cleanest structural opportunities on Metals, and I will update the chart as soon as expansion begins.
Gold prices retreated slightly as market sentiment shifted towarGold prices retreated slightly as market sentiment shifted towards risk assets.
Gold prices fell during Asian trading hours on Thursday, primarily reflecting improved market risk appetite and reduced safe-haven demand due to thin trading during the holiday season. As market expectations for another Fed rate cut in December intensified, coupled with improved regional peace negotiations, global sentiment became more optimistic, prompting some funds to flow from gold to risk assets.
Fundamental Analysis
Fed Policy Expectations Support Gold Prices
Recent speeches by several Fed officials have clearly shifted towards a dovish stance. John Williams of the New York Fed stated that if the economy remains as it is, a rate cut would not affect the inflation target; Fed Governor Waller pointed out that the weakness in the labor market is sufficient to support another rate cut. Against this backdrop, the dollar index fell to a one-week low, continuing to provide support for gold.
Divergent Economic Data Does Not Change Expectations of Rate Cuts
Data from the U.S. Commerce Department showed that durable goods orders rose 0.5% in September, a significant slowdown from the previous 3.0%, but higher than the expected 0.3%. Orders excluding transportation rose 0.6%, indicating that the manufacturing sector remains resilient. Overall data did not change market expectations regarding the Fed's policy path.
Safe-haven demand was suppressed. Improved regional peace negotiations and a more positive external sentiment weakened gold's safe-haven appeal. Although negotiations remain far off, increased risk appetite is putting short-term pressure on gold prices.
Technical Analysis: The structure is consolidating. The four-hour chart shows gold in a triangle consolidation pattern, with the downward trendline resistance in the 4173-4175 range. A decisive break above this resistance is needed to open up new upward potential; otherwise, consolidation will continue.
Short-term pressure, watch for potential correction. The one-hour chart shows the price has broken below the short-term support zone and is under pressure from short-term moving averages, indicating a possible short-term correction. Key intraday resistance is at 4173-4175, with support at 4110-4100.
Trading Strategies
Short Position Strategy: If the price rebounds to around 4170-4173, consider shorting in batches with a stop-loss of 8 points. Target 4150-4130, with a further target of 4110 if it breaks below.
Long Position Strategy: If the price pulls back to around 4105-4110, consider going long in batches with a stop-loss of 8 points. Target 4130-4150, with a further target of 4170 if it breaks above.
Risk Warning: All trades require strict position control and stop-loss orders. Be wary of extreme market conditions caused by unforeseen events. Due to Thanksgiving in the US, the gold market will close early today, and trading may be light.

market on sideways#XAUUSD price is sideways, firstly from 4152 on M15 closure will drop the price till 4144 but we await for M30 to below 4141 which holds strong bearish.
Failure for close will become rejection zone which will correct back bullish.
Above 4167 - 4170 holds bullish breakout, price will range before the buy will continue but buy will be on valid breakout above 4167.

XAUUSD, Daily, Bearish Scenario AnalysisGold is approaching the apex of a contracting structure that looks more like distribution than accumulation. Despite the popular assumption that a symmetrical triangle is neutral, the underlying conditions point toward a higher probability of a downside break.
### 🔍 **Why the structure leans bearish**
1. **Volume is declining**, which usually signals fading momentum rather than preparation for a bullish continuation.
2. **Price is failing to hold higher lows**, showing weakness along the rising trendline.
3. **The previous parabolic leg** increases the probability of a deeper retracement rather than continuation. Markets rarely push into new highs after such exhaustion without a meaningful reset.
4. **Macro factors** such as bond yields and shifting rate expectations reduce Gold's upside pressure.
5. **Repeated rejections at the upper boundary** show supply absorbing attempts to push higher.
---
## 🎯 **Bearish Targets**
The technical structure supports the possibility of a full breakdown from the triangle using a measured move equal to the previous major downswing.
* **Primary target**: 3,500
* **Secondary target**: 3,300
Both levels align with historical demand zones and key Fibonacci retracement areas.
---
## 🧭 **Entry zones for a short position**
### 🔽 **Entry Option 1: Aggressive**
* **Sell zone**: 4,160 to 4,180
* Based on repeated upper wick rejections and failure to build momentum above the trendline.
### 🔽 **Entry Option 2: Conservative and safer**
* **Sell trigger**: Break and close below 4,120
* This confirms the loss of structure and invalidates the ascending trendline.
---
## 🛡️ **Stop loss placement**
Choose based on your risk profile.
* **SL for aggressive entry**: above 4,230
* **SL for conservative entry**: above 4,180
The idea is to protect the trade once price invalidates the bearish structure.
---
## 📌 **Risk management note**
This setup is bearish, but the market is contracting. Volatility can expand in either direction. Stops are essential and position sizing should remain controlled.

SELL XAUUSD*I am in no way a financial advisor and you should always do your own due diligence before placing any trade. Do not trade what you are not comfortable with losing. No trade is guaranteed.
SELL GOLD
SL 4156
TP 4007

A GREAT DISCOVERY
Now i can look at just price reaction to determine the strength of a trend early to know that even in a bullish trend once some signs start showing even without a break of market structure then no need to buy again but wait for a break of the bullish structure for final confirmation or even join the sell that will lead to break major structures

Gold Is Preparing for Its Next Major BreakoutHello everyone,
Looking at the chart — and combining it with how fast macro signals are shifting — gold feels like a machine that’s just been recharged. In only two sessions, the price surged more than 120 USD even while the US Dollar Index stayed above 100. That’s a very clear sign that capital is choosing gold before the Fed makes any move.
The market is now pricing in nearly an 83% chance that the Fed will cut rates by 0.25% on 10 December. This is no longer a vague expectation. Fed officials like Waller and Williams have softened their tone, signalling willingness to support cuts if the data doesn’t run too hot. When expected interest rates fall, gold essentially steps onto a “fast lane”: lower holding costs and stronger inflows from both defensive and speculative money.
That’s why I’m leaning toward one scenario: gold continues to rise. If the price pulls back to 4,140–4,130 or even 4,120, I see these moves as healthy retracements — not signs of reversal. Once buying pressure returns, I expect gold to break above 4,160, move toward 4,200, and potentially expand into the 4,230–4,250 USD/oz region.
What about you? Are you waiting for a pullback or planning to trade the breakout?

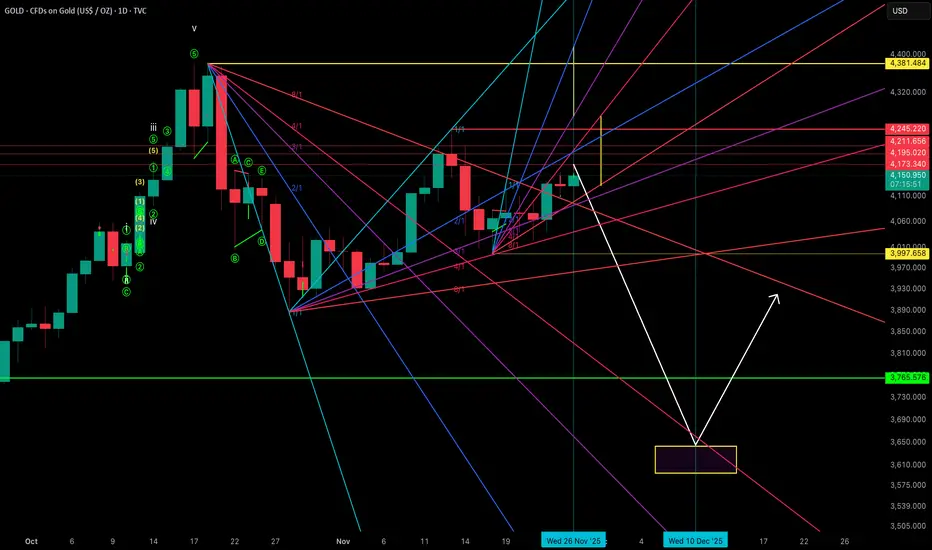
Gold Just Hit the Ceiling — Major Drop Loading?Gold appears to have completed its move for now, having posted a high today exactly as anticipated. At this stage, we believe a potential top may already be in place, and we will now be looking for bearish confirmation.
Our downside target remains around the 3650 area by 10th December 2025, which would complete the expected zigzag correction before a strong bounce from that zone. Notably, 10th December is also a key Gann date and coincides with the FOMC meeting, creating a powerful confluence of timing factors.
Our invalidation level is 4245 — a break above this level would negate the bearish scenario and open the door to significantly higher prices.
I am Bullish on Gold, Are You?The video shows a quick of overview of to which we might look for entry opportunities if certain points get traded to by price action.

XAUUSD | Bullish Optimism in Market.XAUUSD on the M30 timeframe has the potential to drop for a pullback up to 4203.197, then move toward 4240.125. An extreme drop to 4067.232 would invalidate the setup.
Currently, there is slight bearish pressure around 4170.352.
The overall price movement has the 100-EMA above the 200-EMA, while the 50-EMA is being tested by the current candle.
Happy Trading,
K.
Not trading advice.

XAUUSD set to go another 500 pips?XAUUSD had bullish breakout early this asian session fueling by AUD breakout and DXY bearish move has boosted GOLD to remain bullish after Monday's strong breakout of weekly resistance level.
Market is maintaining series of higher low on 1h timeframe a pressure on current daily high at 4169.00
Breaking above 4169.00 and candle close in 4h or 1h can triiger buy trade targeting to 4210.00
Follow for more updates and analysis !

XAU/USD – Gold Maintains Uptrend, Monitor Reaction at FvG⏰ Timeframe: 30m
📅 Update: 25/11/2025
🔍 Market Context
After breaking the downtrend structure and creating consecutive bullish CHoCH, gold is maintaining above the Break–FvG zone at 4,107 USD, indicating that buying pressure is still controlling the recovery phase.
The price is in a reaccumulation phase after the break, and it is likely to need a short pullback to "gain momentum" towards the extended resistance zone above.
📊 Technical Structure
FvG Zone (4,107 USD): newly formed balance zone – acts as the main BUY Zone, where price reactions can be observed for quick scalping opportunities.
Break Structure: confirms active buying flow after a series of CHoCH, shifting short-term bias to bullish.
Target Expansion: the 4,188 → 4,228 USD range is an extended resistance band, coinciding with Fibonacci 1.272–1.618.
💎 Key Levels
🟢 Main Support (Support Zones):
• 4,067 USD – technical balance bottom, the last defense zone.
• 4,084 USD – secondary support, confluence with Fibo 0.382.
• 4,107 USD – main FvG zone, monitor reaction for buy scalp.
• 4,131 USD – dynamic support in the recovery cycle.
🔴 Resistance (Resistance Zones):
• 4,155 – 4,165 USD → intermediate resistance zone, potential short-term profit-taking when price reacts.
• 4,188 USD → confluence with Fibo 1.272 – short-term SELL Zone.
• 4,203 – 4,211 USD → extended supply zone, monitor reaction before the US session.
• 4,228 USD → extended resistance, the final target of the current uptrend.
🎯 Market Outlook
1️⃣ Priority Scenario:
– Price may retest the FvG zone – 4,107 USD, then bounce to test resistances 4,155 → 4,188 → 4,228.
– Prioritize monitoring reactions – quick scalping at resistance zones, avoid holding long positions as price approaches 4,211–4,228.
2️⃣ Alternative Scenario:
– If price closes below 4,107 USD, it may reopen the lower balance zone around 4,067 USD.
🧠 Analyst’s View
The market structure leans towards bullish continuation, but the upper zone is approaching a dense resistance cluster – suitable for reactive trading strategies:
→ Observe reactions at each zone to "scalp with the flow," rather than trying to hold the trend.
As long as price maintains above 4,107 USD, the priority remains buy-the-dip – take-profit-on-resistance.
🛡️ Risk Note
Short-term volatility is expanding – clear candle reaction confirmation is needed before taking action.
Analysis is for technical and educational purposes, not investment advice.

XAUUSD Bullish IfdeaOverally bullish mss, and the market has retraced to the mitigation block , and we cant expect to see more retracements downside.
We target the previous high.

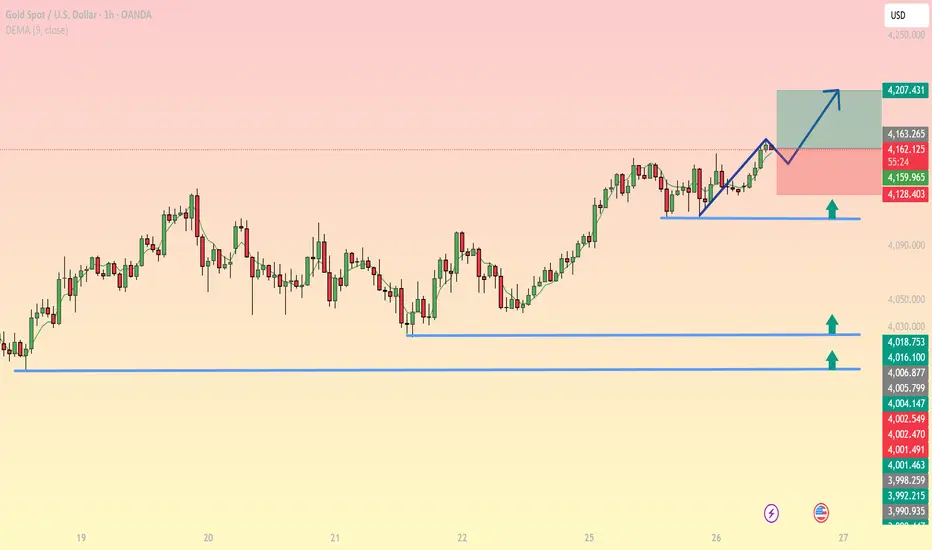
XAU/USD – Bullish Structure Intact as Price Retests Key HigherXAU/USD – Bullish Structure Intact as Price Retests Key Higher-Low Support
Gold continues to hold a solid bullish structure on the H1 timeframe, with price forming a clean higher low around 4128–4132 and bouncing strongly along the short-term rising trendline. The 9-EMA is pointing upward, confirming steady buying momentum.
This structure indicates that buyers are preparing for the next bullish expansion as long as price stays above the 4128–4135 support base.
Key Technical Levels
Major Support
4132 – 4128: Newly formed higher low and the strongest intraday demand zone.
4060 – 4030: Deep support, only tested if a strong correction occurs.
Major Resistance
4163 – 4167: Short-term resistance that needs to break for bullish continuation.
4207 – 4210: Fibonacci extension target and main upside objective.
Price Action & Momentum
Price consistently bounces from the 9-EMA → active buying pressure.
Rising trendline remains intact → bullish momentum sustained.
Small corrective candles near 4163 reflect weakening supply.
Bullish Trading Strategies (Primary Bias)
Scenario 1 – Buy the Retest (High-Probability Setup)
Wait for price to pull back into 4132 – 4135
Confirmation signals: pin bar, engulfing, or RSI holding above 50
Entry: 4132 – 4138
Stop Loss: below 4125
TP1: 4163
TP2: 4207
Scenario 2 – Breakout Entry
Buy after a clean H1 candle close above 4167
SL: 4148
TP: 4207
Bearish Scenario (If Market Invalidates Bullish Bias)
Only consider selling if:
Price breaks and closes below 4125 (H1 close)
Downside targets: 4080 → 4060
Market Outlook
The intraday trend remains strongly bullish, with expectations for an upside continuation toward the 4200+ zone. Watch closely how price reacts around 4163–4167 to confirm the next leg up.
Gold Rebounds After Drop, Awaiting Strong Buy Signal📊 Market Developments:
Gold is trading around USD 4,132/oz.After the prior drop to lower levels, the market is seeing a rebound, though buying momentum remains unclear. Meanwhile, expectations for a possible Fed rate cut and a stable USD are providing some underlying support.
📉 Technical Analysis:
• Key resistance: ~ USD 4,150 – 4,162
• Nearest support: ~ USD 4,120 – 4,125
• EMA: Price is above the 9-period EMA, indicating the short-term uptrend is still possible.
• Candlestick / Momentum:
– Recent H1 candles show long lower wicks → potential buying interest appearing.
– If price fails at 4,150 and is rejected → likely a pullback toward 4,120.
– If support 4,120 is broken → risk of further decline toward ~4,100.
📌 View:
Gold has the potential to rise if buying picks up and the 4,150 resistance is breached. Otherwise, expect a sideways to slightly down move toward support ~4,120 before establishing the next trend.
________________________________________
💡 Suggested Trading Strategy:
🔺 BUY XAU/USD: USD 4,122 – 4,125
🎯 TP: 40 / 80 / 200 pips
❌ SL: 4,119
🔻 SELL XAU/USD: ~ USD 4,148 – 4,152
🎯 TP: 40 / 80 / 200 pips
❌ SL: 4,155

CLOSE THIS TRADE
close this trade because it looks like market is pricing in a better PPI data hence we are likely going to see more sells so let close and wait for a confirmation may be after PPI or any moment from now
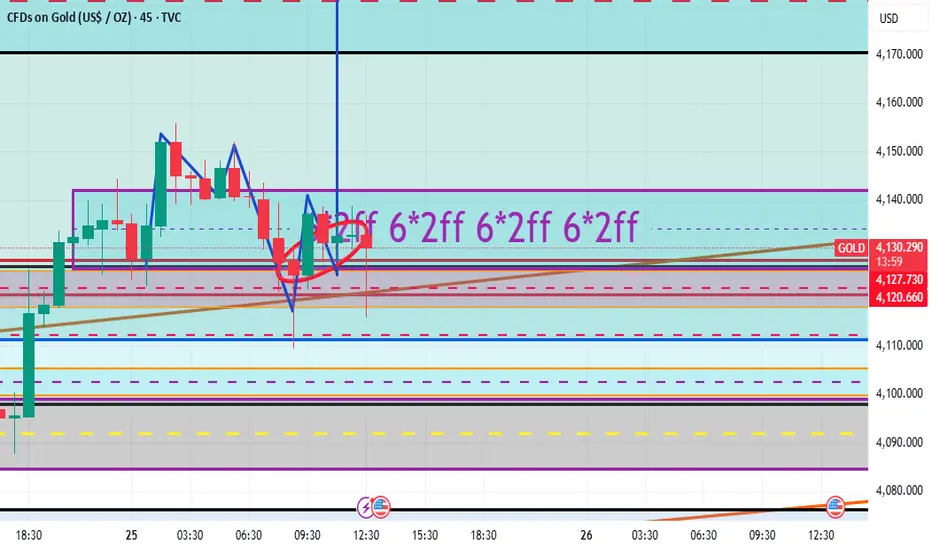
CONFIRMATION CANDLE
if this current h1 candle in the purple sphere closes bearish/red by 8 a.m UTC close buy positions because it will push down further but if it closes bullish/green, then it will likely buy more so you hold your buy positions , I'm busy so update for the next 2 hours would be difficult

XAUUSD -SETUP Price has reacted from a major supply zone and broken below intraday structure, confirming bearish momentum. I’m expecting a continuation move to the downside, targeting the next demand zone as long as price remains below the rejection area. This setup is based on structure shift, supply imbalance, and liquidity draw toward lower levels.

Gold Rebounds: 4100 Test Fails, Awaits RetryGold is in a rebound trend, attempting to break through 4100. The first breakout attempt failed, with prices pulling back to around 4090—awaiting fresh bullish momentum for another breakout
Buy 4080 - 4085
TP 4100 - 4110 -4120
Accurate signals updated daily. They serve as a reliable guide for trading issues – feel free to refer to them. Hope they help!
