XAUUSD, Daily, Bearish Scenario AnalysisGold is approaching the apex of a contracting structure that looks more like distribution than accumulation. Despite the popular assumption that a symmetrical triangle is neutral, the underlying conditions point toward a higher probability of a downside break.
### 🔍 **Why the structure leans bearish**
1. **Volume is declining**, which usually signals fading momentum rather than preparation for a bullish continuation.
2. **Price is failing to hold higher lows**, showing weakness along the rising trendline.
3. **The previous parabolic leg** increases the probability of a deeper retracement rather than continuation. Markets rarely push into new highs after such exhaustion without a meaningful reset.
4. **Macro factors** such as bond yields and shifting rate expectations reduce Gold's upside pressure.
5. **Repeated rejections at the upper boundary** show supply absorbing attempts to push higher.
---
## 🎯 **Bearish Targets**
The technical structure supports the possibility of a full breakdown from the triangle using a measured move equal to the previous major downswing.
* **Primary target**: 3,500
* **Secondary target**: 3,300
Both levels align with historical demand zones and key Fibonacci retracement areas.
---
## 🧭 **Entry zones for a short position**
### 🔽 **Entry Option 1: Aggressive**
* **Sell zone**: 4,160 to 4,180
* Based on repeated upper wick rejections and failure to build momentum above the trendline.
### 🔽 **Entry Option 2: Conservative and safer**
* **Sell trigger**: Break and close below 4,120
* This confirms the loss of structure and invalidates the ascending trendline.
---
## 🛡️ **Stop loss placement**
Choose based on your risk profile.
* **SL for aggressive entry**: above 4,230
* **SL for conservative entry**: above 4,180
The idea is to protect the trade once price invalidates the bearish structure.
---
## 📌 **Risk management note**
This setup is bearish, but the market is contracting. Volatility can expand in either direction. Stops are essential and position sizing should remain controlled.
Trade ideas

SELL XAUUSD*I am in no way a financial advisor and you should always do your own due diligence before placing any trade. Do not trade what you are not comfortable with losing. No trade is guaranteed.
SELL GOLD
SL 4156
TP 4007

A GREAT DISCOVERY
Now i can look at just price reaction to determine the strength of a trend early to know that even in a bullish trend once some signs start showing even without a break of market structure then no need to buy again but wait for a break of the bullish structure for final confirmation or even join the sell that will lead to break major structures

Gold Is Preparing for Its Next Major BreakoutHello everyone,
Looking at the chart — and combining it with how fast macro signals are shifting — gold feels like a machine that’s just been recharged. In only two sessions, the price surged more than 120 USD even while the US Dollar Index stayed above 100. That’s a very clear sign that capital is choosing gold before the Fed makes any move.
The market is now pricing in nearly an 83% chance that the Fed will cut rates by 0.25% on 10 December. This is no longer a vague expectation. Fed officials like Waller and Williams have softened their tone, signalling willingness to support cuts if the data doesn’t run too hot. When expected interest rates fall, gold essentially steps onto a “fast lane”: lower holding costs and stronger inflows from both defensive and speculative money.
That’s why I’m leaning toward one scenario: gold continues to rise. If the price pulls back to 4,140–4,130 or even 4,120, I see these moves as healthy retracements — not signs of reversal. Once buying pressure returns, I expect gold to break above 4,160, move toward 4,200, and potentially expand into the 4,230–4,250 USD/oz region.
What about you? Are you waiting for a pullback or planning to trade the breakout?


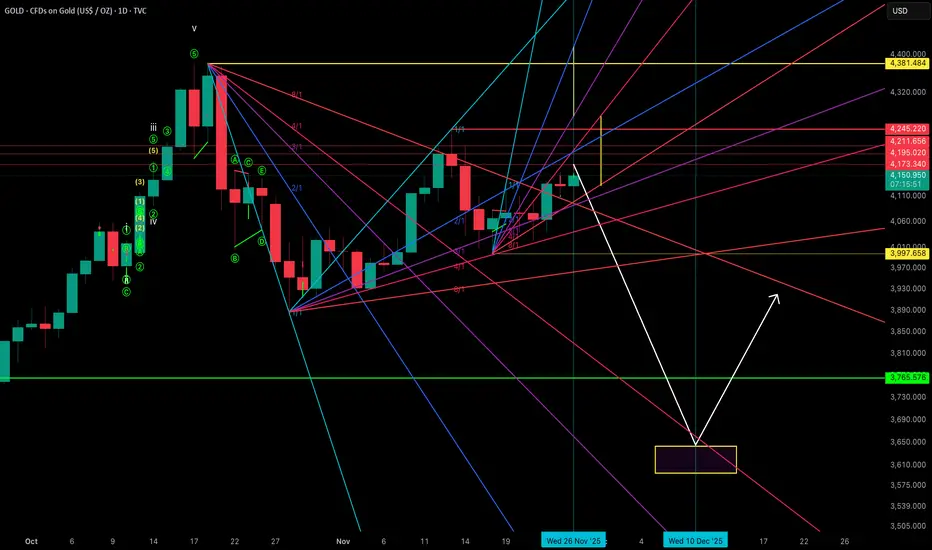
Gold Just Hit the Ceiling — Major Drop Loading?Gold appears to have completed its move for now, having posted a high today exactly as anticipated. At this stage, we believe a potential top may already be in place, and we will now be looking for bearish confirmation.
Our downside target remains around the 3650 area by 10th December 2025, which would complete the expected zigzag correction before a strong bounce from that zone. Notably, 10th December is also a key Gann date and coincides with the FOMC meeting, creating a powerful confluence of timing factors.
Our invalidation level is 4245 — a break above this level would negate the bearish scenario and open the door to significantly higher prices.
GOLD (XAUUSD): Updated Support & Resistance Analysis
Here is my latest support and resistance analysis Gold.
Vertical Structures:
Vertical Support 1: Rising trend line
Horizontal Structures
Support 1: 4164 - 4172 area
Support 2: 4080 - 4132 area
Support 3: 3996 - 4045 area
Support 4: 3869 - 3930 area
Resistance 1: 4230 - 4264 area
Resistance 2: 4359 - 4382 area
Consider these structures for pullback/breakout trading.
❤️Please, support my work with like, thank you!❤️
I am part of Trade Nation's Influencer program and receive a monthly fee for using their TradingView charts in my analysis.

Gold Strategy Focus: Rising Rate Cut Expectations Fuel Gold's TuGold Strategy Focus: Rising Rate Cut Expectations Fuel Gold's Tug-of-War and the Poised for a New Offensive!
Tonight, the market will face the test of the ADP non-farm payroll data, but before the data release, market sentiment seems to be dominated by another force—expectations of a Fed rate cut are heating up at an unprecedented rate! 😯 Currently, the market's probability of a 25 basis point rate cut at the December meeting has surged to 89%, more than double what it was a week ago. This frenzy not only reflects economic concerns under weak data but also foreshadows a potential turning point in global liquidity.
🔥 Fundamentals: Multiple Engines Ignite, Strengthening Gold's "Long-Term Bull Market" Logic
Rate Cut Expectations Take Center Stage
The market is almost certain that the Fed will begin cutting rates this month. If this comes true, it will completely reverse the interest rate narrative. The dollar weakened in response, and US Treasury yields fell, creating a perfect financial environment for gold.
Policy Variables Add Dramaticity
Trump's latest hints, coupled with rumors of Hassett's (a dovish representative) possible appointment, further suppress the dollar's prospects. Once policy direction becomes clearer, gold's role as a currency substitute will become significantly more prominent.
Structural buying remains strong. With the global central bank gold-buying spree continuing, geopolitical volatility unresolved, and the long-term target of $5,000/ounce by 2026 gaining traction, gold is no longer just a safe-haven asset, but also a "ballast" in asset allocation.
Author's Note: The market's shift from "higher for longer" to "interest rate cut frenzy" has been swift and unexpected. Gold has become a core battleground in this process, a key battleground for expectations! ✨
📊 Technical Analysis: Pullbacks as Buying Opportunities? Key Levels Defined; Positive Daily Signals. Yesterday's candlestick formed a classic "hammer" pattern, indicating strong buying pressure on dips! Prices are holding firm within the upward channel, the moving average system is nearing completion of its repair, and the overall structure is bullish. Key resistance is seen in the 4245/4250 area; a break above this level could open up new upside potential. The MACD and KDJ indicators have completed their repair, and the area around 4180 has become a crucial support level in the near term. Hourly chart analysis: Tracking the oscillation rhythm. The short-term pattern has formed a rounded top and pulled back. Pay attention to the support strength of the 120-day moving average (4193). If the oscillation range breaks upwards, the trend continuation is worth anticipating.
Technical Summary: A tug-of-war ≠ weakness; rather, it's a normal state of bullish accumulation. The market is currently digesting profit-taking through oscillations and accumulating energy for the next offensive! ⚡
🎯 Trading Strategy: Focus on support areas, primarily through phased entry.
Long Positions: Plan to enter long positions in batches in the 4160/4170 area, with a stop-loss below 4150, targeting the previous high and even a breakout of the range.
Short Positions: Avoid actively shorting. If the price rises to the key resistance levels of 4230 and 4250 and stalls, then consider a short-term short strategy based on the real-time chart pattern.
Friendly Reminder: If the ADP data tonight is weak again, it may directly push gold to break through resistance! It is recommended that those holding positions keep their stop-loss orders in place, and those with light positions patiently wait for a pullback opportunity. The market always respects risk, but it also rewards keen patience! 🛡️
✍️ Conclusion: The stage for gold has shifted from "whether it will rise" to "at what pace." With the resonance of interest rate cut expectations and technical structures, every pullback could be an invitation for trend investors to enter. Closely monitoring the Fed's direction and holding onto your long positions may be the beginning of gold's shining moment! 🌟

Could we se a reversal from here?Gold (XAU/USD) is reacting off the pivot and could drop to the 1st support which aligns with the 61.8% Fibonacci retracement.
Pivot: 4,263.04
1st Support: 4,097.06
1st Resistance: 4,364.63
Disclaimer:
The opinions given above constitute general market commentary and do not constitute the opinion or advice of IC Markets or any form of personal or investment advice.
Any opinions, news, research, analyses, prices, other information, or links to third-party sites contained on this website are provided on an "as-is" basis, are intended to be informative only, and are not advice, a recommendation, research, a record of our trading prices, an offer of, or solicitation for, a transaction in any financial instrument and thus should not be treated as such. The information provided does not involve any specific investment objectives, financial situation, or needs of any specific person who may receive it. Please be aware that past performance is not a reliable indicator of future performance and/or results. Past performance or forward-looking scenarios based upon the reasonable beliefs of the third-party provider are not a guarantee of future performance. Actual results may differ materially from those anticipated in forward-looking or past performance statements. IC Markets makes no representation or warranty and assumes no liability as to the accuracy or completeness of the information provided, nor any loss arising from any investment based on a recommendation, forecast, or any information supplied by any third party.

XAUUSD- GOLD FORMING "W" PATTERN KEY (READ CAPTION)Hello trader's what do you think about gold
Gold (XAUUSD) is currently forming a clear W Pattern / Double Bottom structure, which is a strong indication of a potential bullish reversal in the market.
Support Levels
Support 1: 4180 — A strong reaction zone where buyers have previously held the market multiple times.
Support 2: 4293 — A higher support zone that can act as a continuation level if price respects it on a pullback.
Market Outlook
The price action is showing a clean W pattern, suggesting that if the neckline breaks, we can expect a strong bullish move.
If price retraces downward, both 4180 and 4293 serve as ideal buy zones for buyers preparing for the next bullish leg.
Technical Summary
W Pattern → Potential bullish reversal
4180 → Deep correction support
4293 → Continuation support
please don't forget to like comment and follow

XAU/USD M15 BEARISH 🔻 GOLD M15 Trade Idea (Sell Setup) The market is currently trading inside a small consolidation channel after a bullish push. Price is approaching the FVG (Fair Value Gap) zone around 4250, which is acting as a potential premium area for selling. 📌 Trade Plan Wait for price to tap the FVG zone near 4250. Look for a rejection candle or bearish structure shift on M15. Once confirmation appears, enter a sell trade. 🎯 Targets Final Target: around 4161, as shown in your chart. This target aligns with the imbalance fill and previous demand zone. 🛑 Stop Loss Place SL slightly above the FVG zone (above 4255) to stay safe from liquidity grabs. 📉 Overall Bias The market is expected to retrace downward after filling the FVG, targeting the lower imbalance near 4161

XAU/USD 4H Analysis — Key Demand Zone in Play🔵 Major Demand Zone: 4165–4175
Price is currently pulling back into a strong 4H demand zone that has previously acted as a launch point for bullish continuation. This zone remains the key area to watch for bullish reactions.
📈 Bullish Scenario
If price holds the 4165–4175 demand zone, I’m watching for:
Rejection wicks and a bullish 4H close inside the zone
Break back above 4200
Continuation toward 4225
A clean break and retest of 4225 would open the door toward 4240+
This path is marked on the chart with the upward arrows.
📉 Bearish Scenario
If the demand zone fails, meaning we get:
Strong bearish 4H close below 4165
Retest and rejection from beneath
Then price could seek deeper liquidity, potentially moving toward:
4140 areas
4100 areas
This path is shown by the lower arrows.
📌 Summary
Gold is currently reacting inside a major 4H demand zone.
VANTAGE:XAUUSD
4165–4175 is the decisive level for short-term direction.
Above 4200 → bullish momentum likely resumes.
Below 4165 → deeper correction on the table.

XAU/USD M30 BULLISH CONTINUTION📈 GOLD M30 Trade Idea Gold is currently bouncing from a strong support zone near 4160–4170, after completing a falling channel pattern. The price has shown a rejection candle and is now moving upward, indicating a possible trend reversal. --- 🟦 Buy Zone (Entry Area) Buy Gold: 4165 – 4180 --- 🎯 Target Levels TP1: 4205 TP2: 4225 TP3: 4242 (Major resistance zone shown on your chart) --- 🛑 Stop Loss SL: 4148 below support --- 📌 Trade Reason Price broke out of the falling channel. Strong bullish wick rejection at support. Market structure turning bullish on M30 time frame. Clear liquidity target at 4242 zone. --- 📊 Overall Bias: Bullish (Buy) as long as price stays above 4160.

A BUY AND HOLD First buy entry at 4193-88, sl at 4175 and the other circled area becomes our next entries if price closes above them but it comes with some confirmation before entry but the best entry is 4193-88


XAU longs…Okaaay, got some downside here as mentioned…
$4192 people…
Looks to be en route, and should be monitored.
Low ends for me on 79/80, I’m shoot some. Layered through 192. Target projected for 318 minimum and looking to take ATH as extensions!!!!
I do think she can hold off 68 ?!
Safest play for confirmation would be to see some pricing into 79/80 followed up with closures above 192!!!
Last post. See how we go…
If she can’t make 192 and finds her way on an upside again, I believe it’s dead off 31/35 to fulfil !!!
If not long profile should be valid. Just gotta find how you jump on the wave 🌊
Let’s Gooooo’🫨

setup fpr GOLDWe can make a medium-risk buy from the marked area, and then, depending on the price trend and the price reaction to the circled area, we can look to sell for the long term.

Gold (XAUUSD) Prices Poised to Break Higher, Targeting 4358Gold (XAUUSD) continues to exhibit a bullish sequence from the 28 October low, suggesting further upside potential. The rally from that low is unfolding as a five‑wave impulse, with wave 1 concluding at 4245.22, as reflected in the one‑hour chart. Following this, wave 2 developed into a zigzag Elliott Wave structure. From the peak of wave 1, wave ((a)) ended at 4144.97, while the subsequent rally in wave ((b)) terminated at 4211.31. The decline in wave ((c)) reached 3996.25, thereby completing wave 2 at a higher degree.
The metal has since resumed its upward trajectory in wave 3, decisively breaking above the prior wave 1 peak. This confirms that the next leg higher has commenced. From the conclusion of wave 2, wave ((i)) ended at 4132.81. The corrective pullback in wave ((ii)) finished at 4022.07, forming a double three structure. One more leg higher is anticipated to complete wave ((iii)), after which a modest pullback in wave ((iv)) should occur. The market is then expected to advance again in wave ((v)), thereby concluding wave 3.
The potential target for this advance lies within the 100% to 161.8% Fibonacci extension of wave 1, calculated at 4358–4579. In the near term, as long as the pivot at 3996.25 remains intact, any pullback should find support within a sequence of 3, 7, or 11 swings, paving the way for continued strength. This structure reinforces the bullish outlook and highlights the importance of maintaining the key pivot level to sustain momentum.


4265 AND MORE..Looking at the gold chart on the 4-hour timeframe, you can see that the price consolidated above 4161 exactly according to the previous analysis, broke the resistance of 4245 and advanced to 4265. Currently, gold is trading in the range of 4237. If it consolidates above the 4161 range, we can expect further growth in the 4265 and 4311 ranges
با بررسی چارت طلا در تایم فریم 4 ساعته مشاهده
میکنید که قیمت دقیقا طبق تحلیل قبلی طلا بالای 4161 تثبیت شد مقاومت 4245 را شکست و تا 4265 رشد کرد.
درحال حاضر طلا در محدوده 4237 درحال ترید می باشد.
در صورت تثبیت بالای محدوده 4161 میتونیم انتظار رشد بیشتر در محدوده های 4265 و 4311 داشته باشیم .

Gold bullish breakout supported at 4193The Gold remains in a bullish trend, with recent price action showing signs of a breakout within the broader uptrend.
Support Zone: 4193 – a key level from previous consolidation. Price is currently testing or approaching this level.
A bullish rebound from 4193 would confirm ongoing upside momentum, with potential targets at:
4284 – initial resistance
4313 – psychological and structural level
4350 – extended resistance on the longer-term chart
Bearish Scenario:
A confirmed break and daily close below 4193 would weaken the bullish outlook and suggest deeper downside risk toward:
4161 – minor support
4134 – stronger support and potential demand zone
Outlook:
Bullish bias remains intact while the Gold holds above 4193. A sustained break below this level could shift momentum to the downside in the short term.
This communication is for informational purposes only and should not be viewed as any form of recommendation as to a particular course of action or as investment advice. It is not intended as an offer or solicitation for the purchase or sale of any financial instrument or as an official confirmation of any transaction. Opinions, estimates and assumptions expressed herein are made as of the date of this communication and are subject to change without notice. This communication has been prepared based upon information, including market prices, data and other information, believed to be reliable; however, Trade Nation does not warrant its completeness or accuracy. All market prices and market data contained in or attached to this communication are indicative and subject to change without notice.

XAUUSD / GOLD trade ideaGOLD has just broken above a major level of resistance which has now turned into a support after a retest. An anticipation of a further push to the upside and possibly a push to the next key level. Waiting for the right confirmations to execute

Gold Holds Near Channel High as Fed Cut Bets Weaken DollarGold trades around a six-week high near 4,250 as expectations of a December Fed rate cut and a softer dollar keep real yields under pressure.
Structural support comes from persistent central-bank buying, resilient investment demand, and constrained mine supply, according to recent World Gold Council data.
Technically, XAUUSD remains in a well-defined rising channel on the 1-hour chart, with the main scenario pointing toward 4,268–4,282 and potentially 4,298 if momentum persists.
Key support lies at 4,241 and 4,215; a break below this zone would open a corrective move back toward the channel midline near 4,200 in an alternative, lower-probability scenario.
Upcoming US data on manufacturing, spending, housing and the Fed’s Beige Book will shape the path of real yields and risk appetite, keeping gold sensitive to any surprise that challenges or reinforces the December cut narrative.
Read full article here:
erranteacademy.com
