GOLD Best Places To Buy And Sell Cleared , 500 Pips Waiting !Here is m y opinion on GOLD On 15 Mins T.F , We have a Good movement since Last 2 weeks , and we have a range now for 3 Weeks started between 4050.00 to 4099.00 so we can buy and sell Gold This Week from 2 areas , 4050.00 will be the best place for Buy and range between 4095.00 to 4099.00 will be the best place for Sell , now the price very near selling area so we can wait the price to retest the res area and then enter a sell trade and targeting 4050.00 and when the price touch it and give us a good bullish P.A , we can enter a buy trade and targeting 4099.00 , It`s All Depend On Price action , if we have a daily closure below our support then the price will go down more and more after huge movement to upside .
Entry Reasons :
1- Highest Level The Price Touch It
2- Broken Res
3- New Support Created .
4- Clear Price Action .
5- Clear Support & Res .
6- Price Range Cleared .
Trade ideas

GOLD market after “Fed fever”, growth momentum is challengedOANDA:XAUUSD prices remain in the spotlight as the market has been experiencing a series of strong fluctuations following mixed signals from the Federal Reserve and labor data. However, developments show that the risk of price declines is increasing as the precious metal has repeatedly failed in its efforts to hold the $4,100/ounce area, the first resistance level of this year's hot period.
For most of 2025, gold has risen more than 55%, despite high bond yields and a strong dollar. But as the Fed’s final policy meeting approaches and the market lacks consensus on the path of interest rate cuts, the traditional correlation between gold, interest rates, and the dollar is returning. According to CME’s FedWatch, the market still expects a more than 70% chance of the Fed cutting interest rates next month, while economists maintain a more cautious assessment of only about 50/50.
This puts the upcoming economic data in a decisive position for both market expectations and gold’s stability in this trading week.
Fed’s Dovish Return: A Direct Impact on Gold’s Upward Momentum OANDA:XAUUSD
Gold settled in the first half of the week as demand for havens increased, while the ADP report showed that the private sector cut an average of 2,500 jobs per week in the four weeks to November 1.
The 4,000 USD/ounce level continues to be the key threshold determining the short-term trend, as the market is moving within a correction zone but has not yet broken the medium-term bullish structure.
Technical analysis and suggestions OANDA:XAUUSD
1. Price Structure & Overall Trend
• Price is still within the ascending channel that has extended since August, although the range has narrowed compared to October. The October peak around 4,128 USD acts as a major medium-term resistance.
• The current decline is still only a pullback within the uptrend, as long as price holds above 3,972 USD (Fib 0.382) and especially the 4,000 USD psychological & technical support.
2. Key Technical Zones
• Nearest resistance: 4,128 – 4,216 USD
(A strong resistance cluster where price has been repeatedly rejected in November.)
• Nearest support: 4,055 – 4,000 USD
(This zone aligns with Fib 0.382 and the short-term bottom.)
• Deeper supports:
3,846 USD (Fib 0.5) – Important for a deep pullback scenario
3,720 USD (Fib 0.618) – Reaction support in case of strong macro volatility
3. Price Momentum – RSI
• RSI has moved out of oversold territory but remains weak and has not re-established a bullish structure.
• The RSI-MA21 is flat → the market lacks strong momentum; sideways movement or a retest of the 4,000 USD zone is highly likely.
4. Short-Term Outlook (Next Week)
• Market bias: Neutral to slightly bearish, but the medium-term uptrend remains intact.
• Price is likely to retest 4,000 USD, then form one of two scenarios:
o Hold 4,000 → rebound to 4,128 – 4,216 USD
o Break 4,000 → drop to 3,972 – 3,846 USD
👉 Conclusion: 4,000 USD is the decisive level for the short-term trend.
BUY XAUUSD PRICE 4102 - 4100⚡️
↠↠ Stop Loss 4106
→Take Profit 1 4094
↨
→Take Profit 2 4088
SELL XAUUSD PRICE 4016 - 4018⚡️
↠↠ Stop Loss 4012
→Take Profit 1 4024
↨
→Take Profit 2 4030

XAUUSD – SHORT TRADE ACTIVATED PERFECTLYGold has moved exactly into our marked zone and has perfectly tapped the level we were stalking. That reaction gave us the confirmation we needed, and our sell-stop entry has now been triggered.
From here, we’re targeting a minimum of 2R, but with multiple take-profit levels aligned with structure, volume pockets, and liquidity pools, there’s room to extend this move toward 4R+ if momentum follows through.
Technically, price action is showing a clean rejection wick from the supply zone, followed by a shift in market structure on the lower timeframes. We also have declining bullish momentum and evidence of sellers stepping in, with the impulsive leg now breaking through minor intraday supports.
As always, how you manage the trade is personal—locking profits at 2R is completely valid—but the chart currently supports a deeper corrective leg if bearish order flow continues.
Overall, it’s a strong setup with a clear narrative: exhaustion at the highs, liquidity grab, structure break, and continuation potential. A very clean look for traders following the trend shift.

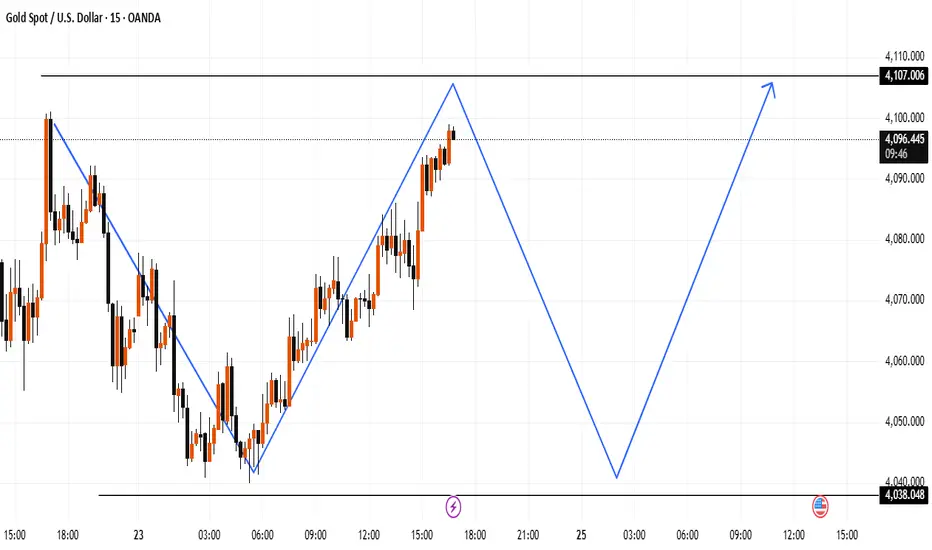
XAUUSD – Potential Reversal Zone and Structural ProjectionThis chart highlights a possible short-term completion of the current upward leg, followed by a deeper corrective move toward the lower support zone near 4038, before a potential bullish continuation toward the 4107 area.
The projection is based on simple market structure:
Price has reached a previous reaction zone.
A corrective wave may form if rejection appears.
A new impulse could develop from the lower support level.
Gold 30-Min — Volume Sell Reversal Triggered⚡Base : Hanzo Trading Alpha Algorithm
The algorithm calculates volatility displacement vs liquidity recovery, identifying where probability meets imbalance.
It trades only where precision, volume, and manipulation intersect —only logic.
✈️ Technical Reasons
/ Direction — SHORT / Reversal 4081 Area
☄️Bearish rejection confirmed through sharp candle body.
☄️Lower-high forming beneath resistance supply region.
☄️Volume decreasing confirms exhaustion in price rally.
☄️Sellers regained imbalance with heavy top rejection.
☄️Algorithm detects fading demand and shift to control.
⚙️ Hanzo Alpha Trading Protocol
The Alpha Candle defines the day’s real control zone — the first battle of momentum.
From this origin, the Volume Window reveals where the next precision strike begins.
⚙️ Hanzo Volume Window / Map
Window tracked from 10:30 — mapping true market behavior.
POC alignment exposes institutional bias and breakout potential zones.
⚙️ Hanzo Delta Window / Pulse
Delta window monitors real buying vs. selling power behind each move.
Tracks volume aggression to expose who controls the candle — buyers or sellers.
When Delta aligns with Volume Map, momentum becomes undeniable.

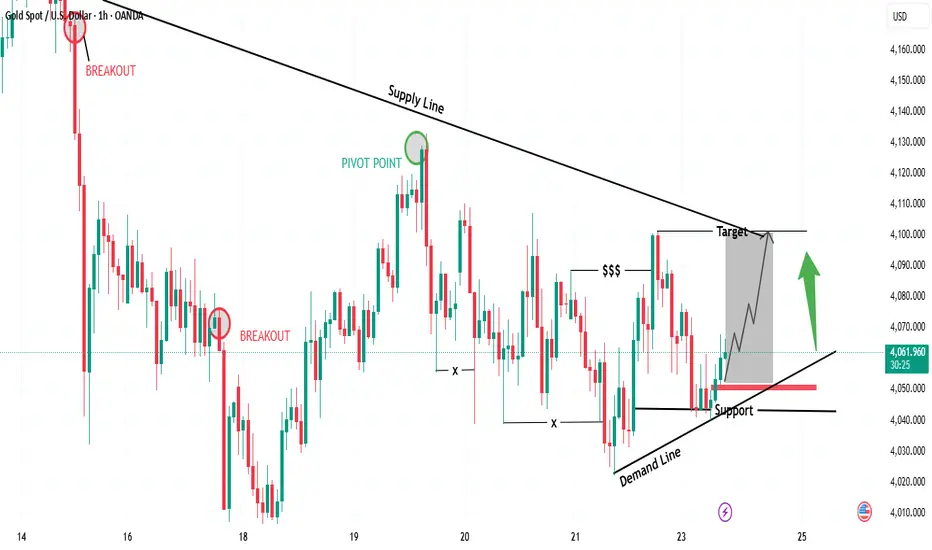
“Gold Rebounding from Demand – Targeting Supply Line Retest🔍 Key Observations
📉 Supply Line (Downtrend Resistance)
Each rally is being capped by the descending supply line
📈 Demand Line (Ascending Support)
Buyers defending higher lows
Strong bullish reaction off support
💰 Liquidity Grab ($$$)
Liquidity was taken below swing lows — bullish signal
Smart money likely securing positions before pushing up
🟢 Bullish Confirmation
If price holds above demand line + support zone
Expect bullish continuation toward supply line retest
🎯 Suitable Target Levels
Target Level (Approx) Status
🥇 First Target 4,095 – 4,105 At supply line retest
🥈 Extended Target 4,120 – 4,130 Breakout continuation
📌 Trade Idea (Bullish Scenario)
Entry Zone: 4,055 – 4,065 🟩
Stop Loss: Below 4,025 ❌
Take Profit 1: 4,100 🎯
Take Profit 2: 4,125 🚀
RR Ratio: 1:2.5 – 1:3 📈
🧭 Market Sentiment
📍 Bias → Short-term Bullish
🛑 But… sellers may reappear at supply line
⚠️ Watch for fakeouts near the target
XAUUSD-1H_BuyShort and Medium Term Gold Analysis
Head and Shoulders Bottom Pattern Formation
Net Profit for Buyer in $4000 Channel

Gold is consoladating in narrow zoneGold is consoladating in narrow zone. US dollar after NFP data appears strong, so sooner or later XAUUSD will breakdown this triangle range.

POssible 1:5 R2R on XAUUSDThis is a Follow up after the first entry from the previous post, Target 1 has been hit @ 4101 .
Still with Targets 2 and 3 in sight, we will b e anticipating a break and close above the 4089 price zone for a possible reentry as described in chart to target between 4172 - 4211 .
No Entry until this requirement
This is something to look out for upon the release of NFP today
Else, a possible Slide down to $3900
Patience is the way! Ieios

THE KOG REPORT - UpdateEnd of day update from us here at KOG:
Yesterday we said we would stick with our view and expect the potential undercut which happened today tapping our defence level nearly to the pip and completing 4040! That long was one of two clean opportunities we got in Camelot to go with the move and carry it upside to where we are now.
For now, we have resistance at the 4180 level with the key level above 4090 and support below 4045-50. We should be in from lower, protected and managed, so nothing to really worry about but to watch where we close
Price: 4041
RED BOXES:
Break above 4049 for 4055✅, 4060✅ and 4077✅ in extension of the move
Break below 4030 for 4020, 4010 and 4006 in extension of the move
As always, trade safe.
KOG

XAUUSDThe knowledge has been shared with you guys.
Just do not enter blindly wait and watch the price reaction on our zones.
And than decide weather to buy or sell,
Keep following for guys

XAU/USD – Gold Outlook as November EndsLast week, gold consolidated tightly between 4,040 and 4,110, building base ahead of what could be a very reactive December. Entering the final month of the year, seasonal dynamics may amplify volatility. On the fundamental side, all eyes are on a possible Fed rate cut:
If a cut does happen, gold could rally toward 4,180, the upper boundary of the ascending channel, as dovish Fed policy weakens the dollar.
If no cut materializes, the stronger dollar may force a breakdown below the channel, targeting ~3,930 as the next major support.
Technically, the consolidation zone acts as a launchpad — a breakout above or below will likely trigger a strong directional move. For now, gold remains in wait-and-see mode, with risk skewed to the catalyst from U.S. monetary policy.

Gold potential scenarioBased on the chart, gold appears to be completing wave B of a flat pattern, which will complete wave X of a larger WXY pattern (WAVE Y).
On Monday, November 24, 2025, a buy trade is favorable if the price closes above 4092, with targets at 4115, 4132, and 4152.
The stop-loss for this trade is an hourly close below 4045.

Down for goldHi traders,
Last week gold made a small upmove and a correction down.
So next week we could see a small upmove again to finish the correction up and another downmove to finish the bigger correction down.
After that it could go up again.
Let's see what price does and react.
Trade idea: Wait for a small correction up on a lower timeframe and a change in orderflow to bearish to trade short term shorts.
This shared post is only my point of view on what could be the next move in this pair based on my technical analysis.
But I react and trade on what I see in the chart, not what I've predicted or expect.
Don't be emotional, just trade your plan!
Eduwave

GOLD HIGH PROBABILITY BUY SOON!!!🚨 XAUUSD HIGH PROBABILITY BUY SETUP 🚨
* Here We Can See Clearly The Next Potential Moves For GOLD Coming Hours.
* Keep Your Eyes Close On Your Trading Positions.
* Happy PIP Hunting Traders.
FXKILLA.

GOLD Analysis (Nov 19, 2025) - Key Levels for BreakoutOANDA:XAUUSD GOLD ANALYSIS What’s Moving the Market Today? (November 19, 2025)
Welcome back to Trade with DECRYPTERS, where we turn complex charts into clean buy & sell zones.
Keep it simple. Let levels drive your decisions.
*📰 Market Overview*
Gold dipped after failing to hold above $4,100, sliding toward the mid-range as the U.S. Dollar Index (DXY) climbs toward 99.55. Expectations for a December rate cut weaken (now ~47%), adding pressure on metals.
*Key fundamentals driving today’s volatility:*
📈 DXY rebound → reduces short-term gold momentum
🏦 Fed hawkish tone after October’s cut; policymakers want “pause & observe”
📉 Shutdown-related data blackout = mixed signals + unpredictable volatility
🌍 Geopolitical tensions (US–China tariffs, Mideast, Ukraine-Russia) continue to anchor safe-haven flows
🏛 Central banks still buying: Q3 +220t, Poland +67t YTD
*📊 ETF flows:*
ETF flows hit a record +222t in Q3, but November is seeing mild outflows even as AUM holds near $472B. It’s like investors took a big bite earlier, but are now nibbling less while still keeping most of their gold on the table.
*📆 What’s Ahead Key Events to Watch*
🔸 FOMC Meeting – Dec 10
Odds remain mixed with a slight hawkish tilt; any surprise tough tone could pressure gold short-term.
🔸 Data Blackout Continues
With CPI/NFP still imputed, November data may drop in clusters, triggering sudden volatility spikes.
🔸 Geopolitical Risk Premium
Escalation brings instant safe-haven demand, while de-escalation boosts DXY and pushes gold lower.
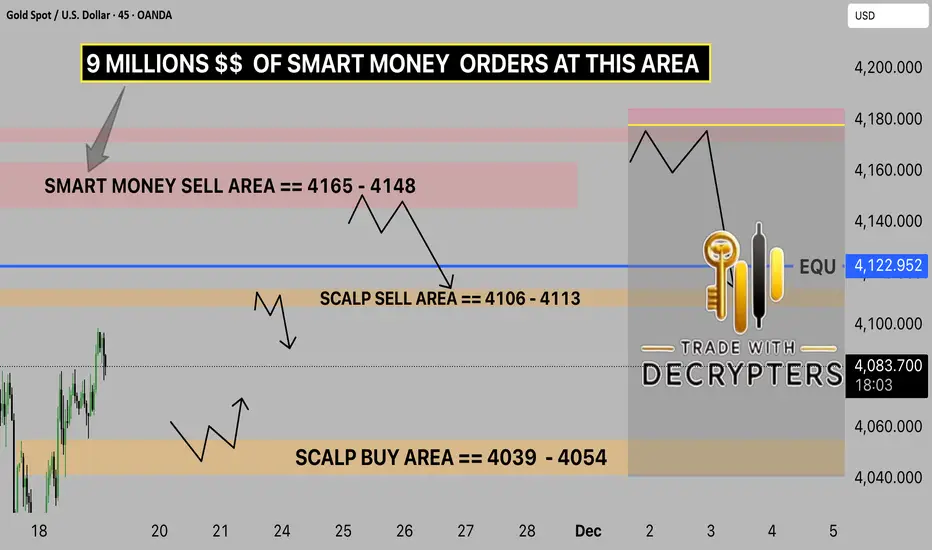
🟩 *GOLD TECHNICAL LEVELS*
By analyzing the #Gold chart on the 4H timeframe, we can see that after dropping to 3998 dollars, price found strong demand and has now climbed back up to around 4050 dollars.
*Whats NEXT ON GOLD ?* 👀👀
🎯 EQUILIBRIUM: 4122.95
Hold above = bullish momentum toward 4148
Stay below = re-test 4054 & possibly sweep 4039
🟩 📌 SCALP BUY AREA: 4039 – 4054
Strong intraday support + previous demand footprint.
🟥 📌 SCALP SELL AREA: 4106 – 4113
Expected rejection zone first reaction area.
🚨 📌 SMART MONEY SELL AREA: 4165 – 4148
CONCLUSION:-
Gold remains in a tight battle between demand at 4039–4054 and rejection zones near 4106–4113, with EQ at 4122.95 acting as the true directional trigger. Holding below EQ favors a pullback toward 4054/4039, while a clean break above opens momentum toward 4148–4165. Overall, range-bound with a slight downside bias until EQ is reclaimed.
*Please support me with your likes and comments to motivate me to share more analysis with you and share your opinion & chart with me !*
*Best Regards , M.MOIZ KHATTAK | FOUNDER OF TRADEWITHDECRYPTERS*
"The Myth of Confirmation - What Retail Gets Wrong Every Day"🔥 THE TRUTH ABOUT MARKET “CONFIRMATION” (What Retail Never Realizes)
Most traders think confirmation comes from indicators, patterns, candle shapes, or repeating formations on lower timeframes.
This is the greatest misunderstanding in trading.
Confirmation does NOT come from the LTF.
Confirmation comes from alignment of the delivery cycle — and the LTF only expresses what the HTF already decided.
Retail thinks the 5M “creates” trend.
Institutions know the 5M merely reflects it.
Here’s the real breakdown institutions use:
⸻
1. Confirmation = Completion of a Phase, Not a Pattern
A market only confirms when a structural phase fully completes, meaning:
• Liquidity objective hit
• Internal structure reset
• Order flow aligned
• Efficient price or imbalance corrected
• Pullback cycle finished
• New impulsive leg prepared
This is confirmation.
Not a candle.
Not an indicator.
Not a shape on your chart.
⸻
2. LTF Structure Means NOTHING Without HTF Context
Retail loves reacting to:
• 5M BOS
• 1M pullback
• 15M FVG
• Candle patterns
• Trend lines
None of these matter if the HTF hasn’t finished its development cycle.
This is why traders lose:
They see “confirmation” while the HTF is still in a build-up, not a release phase.
⸻
3. The Market Confirms Twice — Retail Only Sees One
Institutional traders track two confirmations:
Macro Confirmation (HTF)
This tells the market what it wants to do next
— continuation or pullback.
Micro Confirmation (LTF)
This tells the market when it’s safe to execute
— trend shift + pullback + OB tap + displacement.
Retail only waits for micro confirmation.
They skip macro confirmation.
So they trade inside noise.
⸻
4. Candles Don’t Confirm — the Cycle Confirms
People over-read 5M candles, ignoring the fact that candles are only expressions of liquidity movement.
You can’t read intent from shape.
You read intent from position in the cycle.
The same candle means:
• continuation in one phase
• reversal in another
• manipulation in another
Only the cycle gives it meaning.
⸻
5. The Market Doesn’t Confirm For You — It Confirms ITSELF
This is the coldest truth most will never learn:
Price never confirms your bias.
Price only confirms where it is in the timeline.
If you don’t know the timeline,
you don’t know the confirmation.
TL;DR
(Beginner/Simple)
Confirmation = Cycle Completion + Alignment
NOT a candle pattern or indicator.
You don’t follow confirmation.
You follow timing.
Gold (XAUUSD): 15m timeframe idea, sell setupGold (XAUUSD): 15m timeframe idea, sell setup. I still believe in this trade, even more with the current pattern.
Cheers

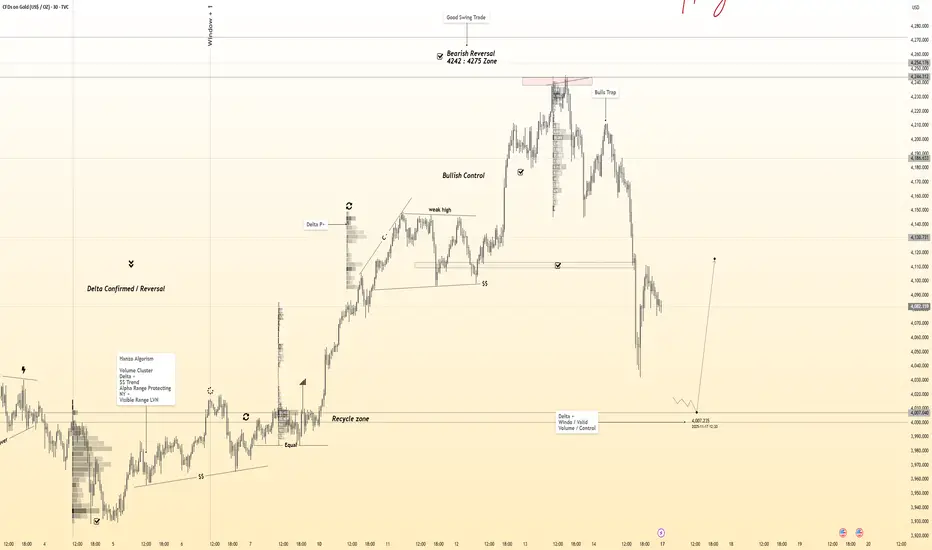
Gold 30-Min — Volume Buy Reversal Triggered⚡Base : Hanzo Trading Alpha Algorithm
The algorithm calculates volatility displacement vs liquidity recovery, identifying where probability meets imbalance.
It trades only where precision, volume, and manipulation intersect —only logic.
✈️ Technical Reasons
/ Direction — LONG / Reversal 4005 Area
☄️Bullish momentum confirmed through strong candle body.
☄️Structure shifted with higher-low near key demand base.
☄️Volume expanding confirms order-flow alignment upward.
☄️Buyers reclaimed imbalance with sustained clean break.
☄️Algorithm detects rising momentum under low liquidity.
⚙️ Hanzo Alpha Trading Protocol
The Alpha Candle defines the day’s real control zone — the first battle of momentum.
From this origin, the Volume Window reveals where the next precision strike begins.
⚙️ Hanzo Volume Window / Map
Window tracked from 10:30 — mapping true market behavior.
POC alignment exposes institutional bias and breakout potential zones.
⚙️ Hanzo Delta Window / Pulse
Delta window monitors real buying vs. selling power behind each move.
Tracks volume aggression to expose who controls the candle — buyers or sellers.
When Delta aligns with Volume Map, momentum becomes undeniable.
short sell finding its way to the market... patience paysxauusd is running a short buy manipulation but the real jackpot comes on a short sell

XAUUSD Analysis todayHello traders, this is a complete multiple timeframe analysis of this pair. We see could find significant trading opportunities as per analysis upon price action confirmation we may take this trade. Smash the like button if you find value in this analysis and drop a comment if you have any questions or let me know which pair to cover in my next analysis.

Gold (XAUUSD) – 24 Nov | Key Demand Zone 4042–4031 in Focus🟡 Gold (XAUUSD) Analysis – 24 November
Hello Disciplined Traders,
Welcome to the Chart Is Mirror Community 👋
Market Context
• On M15, the major trend remains bearish with Swing High 4107.350 and Swing Low 4022.260 defining the current range.
• However, within this range, the internal structure is forming bullish legs , indicating intraday upside until the major structure shifts again.
• Price is currently trading above the support 4055.129 , attracting retail buyers — but the market may come down to grab sell-side liquidity below this support before resuming its upward momentum.
Key Observations
• Our potential POI for a short-term long setup lies at the 4042.1–4031.2 strong demand zone .
• If the market taps this zone and gives LTF bullish confirmation , we will plan and execute our long setup accordingly.
• If this demand zone fails and price breaks below it, the zone becomes invalid for long setups . In that case, remain still and wait for new structure before participating again.
Execution Plan
• Wait for price to reach the 4042.1–4031.2 demand zone .
• Enter only if LTF confirmation aligns with long continuation.
• No confirmation, no entry — discipline protects precision.
• The market is very volatile — manage position size and risk accordingly .
Let structure invite the trade — not impatience.
📘 Shared by @ChartIsMirror

XAUUSD in rangbound At moment market is in rangbound from 4030-4080 area rejected multiple times .
What are my conditions For Today's setup?
-I’m watching for a buy trade at 4030-4040 zone and my target remains 4080 then 4120 in extension.
Secondly if H4 closed below 4025 then market will test 3975-3985.
Unmute FOREXLAB for 24/7 updates
