GOLD LONGThe bears pushed down the price of gold , I believe the bulls are getting ready now, I doubt gold will move up by this week surely anything is possible so I'll be keeping an eye on it...
Trade ideas

XAUUSD: Market Analysis and Strategy for October 29Gold Technical Analysis:
Daily chart resistance: 4090, support: 3840.
4-hour chart resistance: 4050, support: 3950.
1-hour chart resistance: 4050, support: 3980.
Today, the European session saw an accelerated rebound, breaking through $4000. The focus is on whether it can hold. If the price can stabilize above $4000 after the Fed's rate cut and Powell's speech, it will inevitably attract previous buying interest, solidifying the long-term upward trend. Conversely, if the price falls below $4000, it can be basically determined that a short-term top has formed. At that time, greater selling pressure will continue to amplify the decline until market risk sentiment shifts.
Based on the 1-hour chart, the price faces resistance around 4050, and the battle around the 4000 level remains crucial. Support is seen around 3980.
Trading Plan:
SELL: 4050 near
BUY: 3980 near
BUY: 3955 near
If you choose to trade, please avoid times when news releases occur.
XAUUSD UPDATE : Alert ! BEARISH PRESSURE still EXISTMonday open, price still under pressure below 4161 resistance.
It could be the early sign for 4160 - 4150 level as a strong resistance area, and price have a big possibility to make a downside continuation / more correction to a lower price below 4000.
Becareful for a retest action !
Have a great week ahead !

GOLD: Long Signal with Entry/SL/TP
GOLD
- Classic bullish setup
- Our team expects bullish continuation
SUGGESTED TRADE:
Swing Trade
Long GOLD
Entry Point - 3901.6
Stop Loss - 3884.4
Take Profit - 3938.6
Our Risk - 1%
Start protection of your profits from lower levels
Disclosure: I am part of Trade Nation's Influencer program and receive a monthly fee for using their TradingView charts in my analysis.
❤️ Please, support our work with like & comment! ❤️

Is the Yellow Metal Ready to BUST Out?Hold onto your hats, traders!
It's been a very wild ride in the FX_IDC:XAUUSD market, proving that what goes up (to a Double Top 🏔️🏔️) must come down (with a vengeance!). After a decisive rejection at the $4381 peak, Gold took a spectacular 8.64% dive last Tuesday, landing sharply at the $4002 low 📉. Talk about a waterfall! 🌊
But don't count the bulls out yet! Gold showed some backbone, bouncing 3.97% back up to $4161 before settling into a cage match. It's now consolidating in a classic Triangle pattern (a.k.a. Compression) 📐, ranging from the $4002 floor up to the stronger resistance near $4135.
The Great Consolidation: Triangle Tension 😮💨
The key takeaway? That $4000 psychological support is a BEAST. 💪 It survived test after test during the Asia, EU, and US sessions last Tuesday and Wednesday! This resilience allowed Gold to build support: first at the $4065 level (the Fib 0.382) and then down to the $4043 low, followed by rock-solid support near the $4000 zone.
As Friday closed out the week, Gold was still testing the lower $4100 area, pulling back to $4096. So, what’s next for the shiny metal?
That $33 candle Friday, was a direct reaction to the release of the slightly softer-than-expected US September Consumer Price Index (CPI) inflation data.
My Outlook: Patience is Gold, But the FED is Key 🔑
While some market watchers are singing a bearish tune 🐻, I see this as a healthy consolidation phase. Gold has already corrected 50% from its massive move (from $3631 low to the $4381 high). While a deeper correction to the 0.618 Fib at $3918 is possible, I don't see the catalyst right now to push it that far.
My bet? Gold will continue to consolidate in $4050 - $4150 range until the major announcement from the FED 🏦. The sharp reversal from the Double Top might just be the clean-out needed to launch prices higher once the rate cut announcement (or even just the dovish talk of future cuts) takes place! The last inflation data was a mixed bag, which gives the FED room to sound reassuringly dovish.
The FED Announcement is the main event this week. Mark your calendars! 🗓️
🔥 Key Economic Events: Central Bank Super Week! 🔥
This week is absolutely jammed with market-moving events across the globe. Get ready for volatility! 🌪️
Monday, October 27, 2025
8:30 AM ET: USD 🇺🇸 Durable Goods Orders (MoM) (Sep)
10:00 AM ET: USD 🇺🇸 New Home Sales (Sep)
Tuesday, October 28, 2025
10:00 AM ET: USD CB Consumer Confidence (Oct)
Wednesday, October 29, 2025 (The Fed Day) 🏦
All Day: HKD Holiday - Chung Yeung Day
9:45 AM ET: CAD BoC Interest Rate Decision
10:30 AM ET: USD Crude Oil Inventories
2:00 PM ET: USD Fed Interest Rate Decision
2:30 PM ET: USD FOMC Press Conference
10:00 PM ET (Approx.): JPY BoJ Interest Rate Decision
Thursday, October 30, 2025 (ECB and GDP Day)
2:00 AM ET: EUR German GDP (QoQ) (Q3)
4:00 AM ET: EUR German CPI (MoM) (Oct)
8:15 AM ET: EUR Deposit Facility Rate (Oct)
8:15 AM ET: EUR ECB Interest Rate Decision (Oct)
8:30 AM ET: USD GDP (QoQ) (Q3)
8:45 AM ET: EUR ECB Press Conference
9:30 PM ET: CNY Manufacturing PMI (Oct)
Friday, October 31, 2025 (Inflation and Month End)
6:00 AM ET: EUR CPI (YoY) (Oct)
8:30 AM ET: USD Core PCE Price Index (MoM) (Sep)
8:30 AM ET: USD Core PCE Price Index (YoY) (Sep)
9:45 AM ET: USD Chicago PMI (Oct)
-------------------------------------------------------------------------
This is just my personal market idea and not financial advice! 📢 Trading gold and other financial instruments carries risks – only invest what you can afford to lose. Always do your own analysis, use solid risk management, and trade responsibly.
Good luck and safe trading! 🚀📊

XAUUSD support and resistance AOI (SHORT AND WHY)Strong support and resistance AOI (Area of interest) on 4H.
Wait for price to break under the AOI and retest it before entering. Big potential 1:3 to 1:4 RR if tight stop loss.
Weekly is bearish, Daily is bearish and and 4H is bearish for the moment. In 30 min chart 50 EMA has also ben tested twice so big confluence.
Beautiful head and shoulder on the 15M chart that the neckline has been broken. Wait for the restest again before entering short.
So I believe the break and retest of the zone is going to happen anytime market opens.

XAUUSD SELL IDEAPrice falls below the $4,000 level. It calls for possible short sell. I’m looking forward to selling XAUUSD from the current market price. Therefore a sell opportunity is envisaged.

Today's gold trading strategyTwo types of short-term signals, focusing on immediate verification
Fed's short-term "dovish signals" catalyze: In the latest remarks by Fed officials, three voting members explicitly stated that "no interest rate hike is needed in November, and we need to observe the cooling trend of employment data", and the CME Fed observation tool shows that the probability of an interest rate hike in November has dropped from 25% to 12%. Historical data shows that in the 3-5 trading days after the cooling of the interest rate expectation, gold typically rises by 1.2%-1.8%, and the US dollar index is under short-term pressure (currently the US dollar index is 94.2, and if it falls below 94, it will further open up the upward space for gold);
Geopolitical conflict "immediate safe-haven impulse": The situation in the Middle East suddenly escalated, Israel launched a ground attack on the Gaza Strip, and the Houthi forces announced "expanding the attack range on Red Sea shipping", the spot price of London gold jumped by 12 US dollars on the same day, and safe-haven funds flowed into gold ETFs (such as SPDR) for 280 million US dollars in a single day. Although the demand for safe-haven protection from such sudden geopolitical events is not long-lasting, it will form a short-term upward momentum of 3-5 trading days;
Today's gold trading strategy
xauusd @ buy4050-4060
TP:4080-4100-4150
SL:4030

Strategic positioning ahead of the Fed decision
News:
The Federal Reserve's interest rate decision is poised to trigger significant market volatility today.
Gold prices remain bearish after three consecutive days of declines. The Fed will announce its monetary policy decision on Wednesday.
This week's expectations for the Fed meeting focus on two points: a 25 basis point rate cut, and, given the growing disagreement among policymakers regarding the future path of interest rates, Powell is unlikely to provide any clear guidance.
Powell hinted earlier this month that the FOMC will continue to focus on threats to the labor market. Last week's weaker-than-expected inflation report may temporarily dampen hawkish rhetoric within the Fed regarding inflation.
Due to the US government shutdown, Fed officials have been unable to obtain complete data on the labor market since early September.
Specifically:
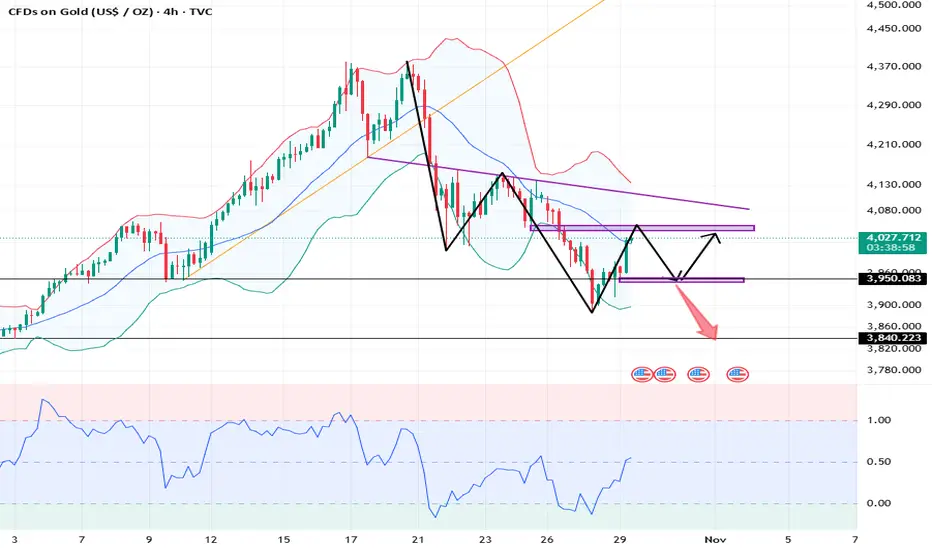
Gold prices have fallen below $4,000/oz. In the coming weeks, gold prices may fall further towards the $3,850-$3,800/oz range. Unless a strong rebound occurs, the short-term outlook remains bearish.
Looking at the 4-hour chart, gold prices previously fell along a descending slope from a high of $4,155, reaching a low of $3,886 before forming a V-shaped rebound. During this rebound, Fibonacci retracement levels formed a clear "stepped resistance-support" pattern.
If inflation subsequently rises, or the labor market tightens again, causing the market to downgrade the consensus from "two rate cuts this year" to "one," the dollar and long-term interest rates will rise, and gold will return to below the upper edge of the descending channel. The consolidation phase, where time is used to create space, will be prolonged, and the $4,050-$4,090 range will evolve into a "strong resistance box," with multiple attempts to break through it failing to hold.
Trading strategy:
Buy: 4025-4035, SL: 4050, TP: 3920-3880-3820
If the price of gold does not retrace to the target level before the speech, then a short position can be established at the current price.


Gold vs USD – Bearish Breakout Playbook for Smart Day Traders🏆 GOLD SCALPERS UNITE! XAU/USD Bearish Heist Plan 💰⚡
📊 ASSET OVERVIEW
XAU/USD | Gold vs. U.S. Dollar | Metals Market
Trade Type: Day Trade Setup 🎯
Bias: Bearish 🐻📉
🎭 THE HEIST PLAN
Alright, gold diggers and chart bandits! 👀💎 Time to put on our bearish masks because this precious metal is looking HEAVY! We're eyeing a potential drop from the clouds back down to reality. Let's break down this professional robbery... I mean, trading strategy 😏
🔥 TRADE SETUP BREAKDOWN
🎯 ENTRY ZONE
Entry Price: Market execution available after Moving Average breakout @ $2,740.00
(Wait for confirmation before entering the vault!)
🛑 STOP LOSS
SL Level: $2,860.00
Place your stop loss ONLY after the breakout confirmation at the mentioned price level
⚠️ Risk Disclaimer: This is an aggressive stop placement. Manage your position size accordingly! Not financial advice—trade at your own risk, legends!
🎁 TAKE PROFIT TARGET
TP Level: $2,660.00
LSMA acting as strong resistance zone 💪
Overbought conditions detected on multiple timeframes ⚡
Bull trap potential in play—don't get caught! 🪤
📌 NOTE: These are reference levels based on technical analysis. You're the captain of your own ship! 🚢 Adjust targets and stops according to YOUR risk tolerance and trading plan.
🔍 TECHNICAL ANALYSIS HIGHLIGHTS
✅ Moving Average breakout confirmation required
✅ LSMA resistance convergence zone ahead
✅ Overbought momentum signals flashing
✅ Classic bull trap formation developing
✅ Risk-to-reward ratio favors bears on this setup
💱 CORRELATED PAIRS TO WATCH
Keep your eyes on these bad boys for confluence:
TVC:DXY (U.S. Dollar Index): Inverse correlation—if DXY pumps, gold typically dumps 📉
OANDA:XAGUSD (Silver): Precious metals cousin—usually moves in sync with gold
FX:EURUSD : Risk-on/risk-off sentiment indicator—watch for dollar strength 💵
COMEX:GC1! Futures: Direct gold futures contract for institutional flow confirmation 📊
Key Correlation Point: Strong dollar = Weak gold. Watch DXY breakouts and EUR/USD weakness for additional bearish confirmation on XAU/USD! 🎯
⚡ RISK MANAGEMENT REMINDER
Listen up, trading thieves! 🎩 This setup has a wider stop loss, which means:
Position sizing is CRITICAL 🔐
Never risk more than 1-2% of your account per trade
The market doesn't care about your feelings—protect that capital! 💪
Partial profit-taking is your friend on the way down 📊
📢 FINAL WORDS
Gold bugs, this bearish setup is cooking! 🔥 But remember—the market is the ultimate boss, and it doesn't follow our scripts. Stay nimble, stay disciplined, and most importantly, stay profitable! 💎🙌
Watch those key levels, manage your risk like a pro, and let's see if this precious metal comes back down to earth! 🌍📉
✨ If you find value in my analysis, a 👍 and 🚀 boost is much appreciated — it helps me share more setups with the community!
#XAUUSD #Gold #GoldTrading #ForexSignals #TechnicalAnalysis #DayTrading #BearishSetup #MetalsTrading #TradingView #ForexStrategy #GoldAnalysis #PriceAction #SwingTrading #RiskManagement #ForexCommunity #ChartAnalysis #TradingIdeas #MarketAnalysis #GoldForecast #USDOLLAR
⚡ Trade safe, trade smart, and may the pips be ever in your favor! ⚡

#XAUUSD: +6000 Pips Swing Move In Making, Patience Pays!
Gold prices have fallen sharply as the DXY has regained strength. Following the recent significant sell-off, we can anticipate the potential direction of the price. Three key targets can be considered if the price moves in our favour. The first is a nearby target at $4000 which would represent a gain of 1100 pips. Subsequent targets should be determined according to your trading plan.
There are two potential entry points; if the first is invalidated the second should be considered.
We wish you the best of luck and trade safely.
Team Setupsfx 🚀❤️

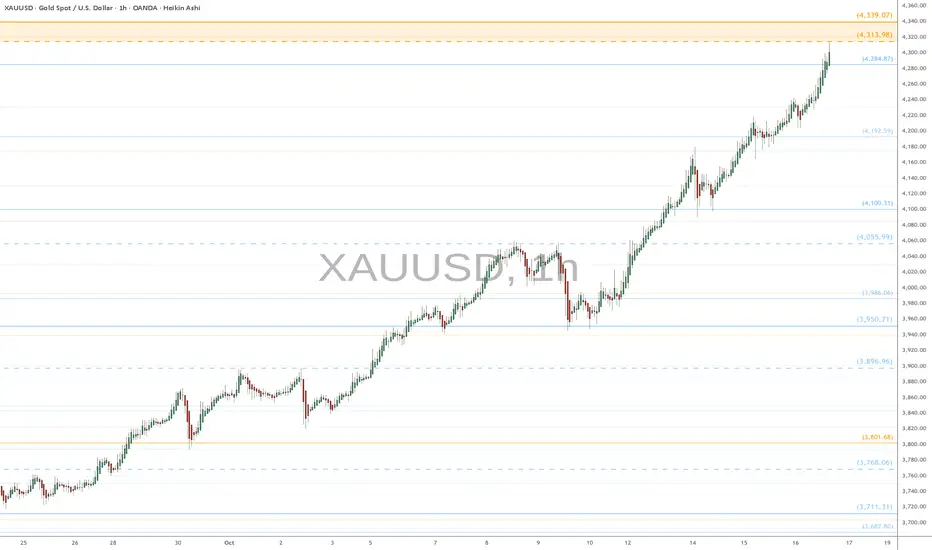
XAU.usd watch $4313-39: Gold about to hit Double Golden fibsGold continues its relentless climb into new highs.
Nearing Double Golden fibs at $4313.98 - 4339.07
Looking for a Dip-to-Fib or Break-n-Retest entries.
IF there is a top anywhere near here,
then THIS will be the ideal spot for it.
.
See "Related Pubications" for previous plots such as this PERFECT DIP:
Hit BOOST and FOLLOW for more such PRECISE and TIMELY charts.
=========================================================
.
GOLD XAU/USD 1H Techenical outlook double bottom 📉 GOLD (XAU/USD) 1H Technical Outlook ✨
⚙️ Pattern Update:
Price forming a Double Bottom 🟢 & showing signs of a Descending Channel Breakout 💥
📊 Buying Zone (Support Levels):
🟩 3950
🟩 3920
🟩 3896
👉 Wait for a bullish confirmation candle before entering long positions! 🔥
🎯 Resistance / Target Levels:
🎯 4014
🎯 4044
🎯 4075
💡 Strategy:
✅ Wait for confirmation 📈
✅ Follow strict Risk Management ⚖️
✅ Trade with patience & discipline 💪
📢 Like 👍 | Comment 💬 | Follow 🔔 | Share 🔄
Let’s trade smart — not emotional! 🧠💰

GOLD | Daily Analysis #1 - 29 October 2025Hello and welcome back to DP
Today we’re excited to launch our Gold daily analysis series. We hope this new addition provides useful and practical insights for your trading decisions. Please support us with your follows and reactions — it really helps us grow!
Market Review:
After a strong bullish run over the past 2–3 weeks, gold finally started to correct from October 20, 2025, continuing its decline up until yesterday.
On the daily timeframe, we’ve identified:
• Support: 3,897
• Resistance: 4,155
Today’s trading session is particularly important as the Federal Reserve’s interest rate decision is due.
According to CME FedWatch, there’s about a 95% probability that the Fed will cut rates by 25 basis points.
Until the announcement, we may see choppy and sideways movement, but once the decision is released, expect a surge in volume and sharp “kangaroo” moves in both directions as traders react to the news.
1H–4H Technical Analysis:
As seen on the chart, 3,897 and 4,155 remain our key daily support and resistance zones.
• If price breaks above 4,012 and confirms the breakout, gold may extend higher toward 4,083 as the first upside target.
• On the other hand, if price drops below 3,974, it may continue falling toward the 3,897 support zone.
With the Fed’s rate decision approaching, expect increased volatility.
Whichever direction price confirms after the announcement could set the tone for gold’s next major move.
Trade cautiously, keep your stop-loss tight, and avoid chasing price during the initial volatility spike.
Disclaimer:
This content is for informational purposes only and does not constitute financial or investment advice. © DIBAPRISM
Amir D.Kohn

XAU/ USD Bullish trend analysis Read The captionSMC Trading point update
-
Technical analysis of XAU/USD (Gold Spot)
Timeframe: 1H (OANDA)
Technical Basis: Smart Money Concepts (SMC) + EMA Confluence
---
Market Structure
Current trend: Bearish, price respecting a descending wedge/channel.
Recent Break of Structure (BOS) confirms bearish momentum continuation.
Price is retracing after forming a new low and may move back to mitigate imbalance (FVG).
---
Key Technical Areas
Retracement Levels:
0.5 – 0.79 Fibonacci zone marks the premium shorting area.
Fair Value Gap (FVG) zone between 0.62–0.79 levels is the ideal entry region.
EMA Resistance:
EMA-50 ≈ 4,067
EMA-200 ≈ 4,120
Both EMAs align with the supply zone, strengthening sell bias.
---
Projected Move
1. Expected retracement toward the 4,067–4,100 zone (supply/FVG region).
2. Potential short entry within that area.
3. Bearish continuation targeting the next structural low at 3,960 (as marked).
---
Targets
Next Target (retracement zone): 4,089
Final Bearish Target: 3,960
Mr SMC Trading point
---
Summary
Gold remains under bearish pressure within a contracting structure. A retracement to the premium zone (4,067–4,100) offers potential short opportunities aligned with structure and EMA resistance. A break below 3,995 would further confirm bearish continuation toward 3,960.
---
Pelas support boost 🚀 this analysis

Xauusd✅ Current XAU/USD Setup
Setup Type: Bearish continuation (short after pullback)
Entry (Sell Limit): 3958.00
Stop Loss: 3980.00
Take Profit 1: 3910.00
Take Profit 2: 3875.00
Price is currently reacting to a previous supply zone after a clean pullback, showing clear rejection wicks on M15 and M30 timeframes.
Market structure remains bearish — we’ve had consecutive BOS (Break of Structure) to the downside and no CHoCH indicating reversal yet.
Ideal entry is if price retests the 3955–3960 region and shows bearish confirmation (rejection candle or engulfing).
Market context:
Gold continues to trade under pressure below the 4,000 psychological level; sellers remain in control as long as 3980–4000 holds as resistance.

Policy essence: "Eagle-wing rhetoric" concealing a loose coreThe trend significance of the interest rate cut decision: This interest rate cut is the second one in 2025, with a cumulative easing of 50 basis points, and the dovish forces in the voting results were significantly dominant - Milan's radical proposal to cut interest rates by 50 basis points was not passed, but the only opponent against the rate cut was Schmidt, with 10 votes in favor, highlighting the "loose consensus". This is a fundamental difference from the "consecutive rate hikes" tone in 2023. Historical data shows that the probability of initiating continuous easing within 3 months after the first rate cut is 83%, with the average gold price rising by more than 7%, and the current price has not reflected this trend.
The liquidity booster from the termination of the balance sheet: The Fed clearly stated that it would completely end the balance sheet reduction on December 1st. The easing strength of this action has been severely underestimated by the market. From historical experience, within 1 month after the termination of the balance sheet reduction in 2019, the gold price rose by 4.2%, while the bank reserves have dropped to the critical level of 2.93 trillion US dollars, and the termination of the balance sheet reduction will directly release over 300 billion US dollars of liquidity. This "interest rate cut + balance sheet expansion" combination is precisely the core driving force for the rise of gold, and the price of 3924 US dollars underestimates this pricing.
The misleading sentiment of Powell's statement: Powell emphasized that the interest rate cut in December is "not a certainty", which is actually a cautious statement in the absence of data - the US government shutdown led to the delayed release of data such as the September CPI, and the Fed needs to reserve flexibility for its policies. However, the non-farm payrolls added only 12,000 in October (far below the expected 113,000), and the core data of weak private sector employment has already laid the groundwork for the interest rate cut in December. Interest rate futures show that the probability of an interest rate cut in December is still 67%, and the speech did not completely reverse this.
Today's gold trading strategy
buy:3915-3925
tp:3940-3950
sl:3895

XAU/USD - Potential Pullback to Trendline Support (1H Chart)Gold has been showing a strong bullish momentum recently, but the current structure suggests a possible short-term correction before the next leg up.
📊 Idea Overview: Price is testing a local resistance area around $4,015 – $4,020, where we could see a temporary rejection. A short-term pullback towards the ascending trendline (around $3,950) may offer a great buying opportunity if bullish confirmation appears.
🧭 Trade Plan:
Entry Zone: Around $4,010 (possible short-term rejection area)
Target Zone: Around $3,950 (trendline retest)
Stop Loss: Above $4,030 (previous swing high)
Bias: Bullish on the higher timeframe — this move could be a retracement within the uptrend.
📈 Technical Confluence:
Rising trendline acting as dynamic support
RSI near overbought territory (possible pullback signal)
Previous resistance turned potential support zone
⚠️ Note: Watch for price action signals near the trendline (bullish engulfing / double bottom) to confirm continuation of the uptrend.

StevenTrading – XAUUSD: Mid-Term Buy Bias StrategyStevenTrading – XAUUSD: Mid-Term Buy Bias Strategy | Anticipating Wave 5 and Trendline Retest at $3935
Hello everyone,
StevenTrading is back with a detailed analysis on Gold (XAUUSD).
Gold is currently consolidating above the $3,950 level, awaiting fresh momentum from the upcoming FOMC interest rate decision.
Structurally, the metal appears to be following the Elliott Wave 5-leg formation at this stage. The mid-term bias remains bullish, with a focus on entering around the trendline retest zone.
📰 1. MACRO CONTEXT & FUNDAMENTAL OVERVIEW
The Gold market remains largely driven by anticipation:
Current Status:
Gold is trading sideways above $3,950 as traders await clearer guidance on the Fed’s path towards potential rate cuts.
Psychological Barrier:
A decisive break above the $4,000 psychological threshold is required to confirm a sustainable bullish continuation.
This outcome will depend entirely on the tone and decision from the FOMC meeting.
📊 2. TECHNICAL ANALYSIS – ELLIOTT WAVE SCENARIO
Based on the H1 timeframe (see chart reference image_fa2a75.png):
Wave Structure:
Gold appears to be consolidating after completing Waves 3 and 4. The next move could see the formation of Wave 5, potentially completing the current cycle or confirming a new uptrend.
Ideal Buy Zone (High-Probability Area):
The $3,935–3,937 range represents a key confluence area. It aligns with the trendline retest zone and provides solid structural support for initiating long positions.
Short-Term Sell Zone:
The nearest resistance lies at $4,058–4,060, where short-term scalping or hedge positions could be considered.
🎯 3. TRADING PLAN (ACTION STRATEGY)
The primary focus remains on the Buy Continuation setup, aligned with the medium-term bullish correction.
🟢 Primary BUY Scenario
Entry Zone: $3,935 – $3,937
Stop Loss: $3,929 (tight SL recommended)
Take Profit:
TP1: $3,955 | TP2: $3,978 | TP3: $3,995 | TP4: $4,022 | TP5: $4,055
🔴 SELL Scalping / Hedge Scenario
Entry Zone: $4,058 – $4,060
Stop Loss: $4,066
Take Profit:
TP1: $4,045 | TP2: $4,022 | TP3: $4,005 | TP4: $3,968
🧠 4. SUMMARY & DISCIPLINE (Steven’s Note)
Gold stands at a critical juncture ahead of the FOMC announcement.
The buy-side scenario remains dominant, but maintaining discipline and risk control is essential.

Gold Preparing to Continue Its Bullish Move After ConsolidationHello traders, I want share with you my opinion about Gold. Gold has maintained a strong bullish structure over the recent period, forming a clear ascending channel that has been respected multiple times. Each correction has been followed by strong bullish impulses, confirming that buyers remain in control of the long-term direction. After reaching the 4,368 Resistance Level — which coincides with the upper boundary of the channel — the market entered a range phase, signaling consolidation after an extended rally. The current price action has formed a secondary support zone near 4,050 – 4,080, also aligned with the ascending support line of the broader channel. Currently, the price is moving inside a range structure (Buyer Zone to Seller Zone), consolidating just above the main ascending support line. In my opinion, this area represents a critical accumulation zone, where buyers are likely preparing for another upward push. I expect that after testing the Buyer Zone, the price will find strong support and initiate a new bullish wave toward the Seller Zone and the Resistance Level at 4,368. A confirmed breakout above the resistance line of the local descending structure would validate this bullish continuation scenario. Please share this idea with your friends and click Boost 🚀

XAUUSD LongThe M formation that was created is still yet to be completed. safe to say that price action has now favored the turn to complete the M pattern. wait for a solid on the resistance from the 3983.00 price level

Gold Price Analysis – Will Bears Drag XAUUSD Below 3900?Gold continues to trade within a clear downward structure facing consistent resistance near the 4040–4060 zone while maintaining pressure below key descending trendlines. Price recently confirmed another Change of Character (ChoCH) near the 3972 level suggesting bearish continuation. The projection shows potential short-term pullbacks toward 3980–4000 followed by a deeper drop toward targets at 3901 and 3857.
Unless bulls reclaim the 4063–4128 resistance the overall bias remains bearish with expectations of further downside toward the $3,816–$3,850 support range.
Regarding the Fed meeting tomorrow markets widely expect a 25 bps rate cut which is already priced in. The real impact will come from the Fed speech if the Fed hints at further easing (a dovish stance) gold may bounce higher as the dollar weakens. But if the Fed sounds cautious or signals a pause gold could drop sharply as yields and dollar strength return. Overall trend remains bearish traders should stay alert to post Fed volatility as it could temporarily disrupt or confirm the next major move.
🔴 Sell Zone:
The main sell zone is between 4150-4200 which aligns with the upper resistance range and the top boundary of the descending channel. This area has repeatedly acted as a rejection point where sellers step in aggressively. If price retraces into this zone and forms bearish confirmation candles it becomes a strong region to look for short entries.
⚡ Sell Trigger Area:
The sell trigger area lies around 4000 which is a key psychological and structural level. A confirmed break and candle close below 4000 would likely trigger renewed bearish momentum opening the way toward 3901-3857 as next downside targets. This break would confirm continuation of the bearish wave and strengthen the short bias.
Note
Please risk management in trading is a Key so use your money accordingly. If you like the idea then please like and boost. Thank you and Good Luck!
