GOLD retreats slightly, market gains bets on easing cycleOANDA:XAUUSD edged slightly lower after a strong rally yesterday, as the market continued to expand expectations that the Federal Reserve will begin its rate-cutting cycle as early as December. This development occurred despite positive U.S. economic data, indicating that the main support for gold now comes more from monetary policy expectations than from growth signals.
U.S. Treasury yields fell and the U.S. Dollar weakened, with the DXY index down 0.20% to 99.60, helping gold maintain its recovery momentum. Although initial jobless claims fell to 216,000 — the lowest since April — and durable goods orders rose more strongly than expected, these data had little impact on rate-cut expectations.
According to FedWatch, the probability of a Fed rate cut at the December meeting remains near 85%, a sharp increase from below 30% last week.
Geopolitical conditions, however, are shifting in a direction less supportive of gold. Signs suggest Russia and Ukraine are moving closer to a de-escalation agreement, with consultations in Geneva and positive remarks from both sides reducing the geopolitical risk premium that has supported gold for months. A Russian adviser told Al Jazeera that the U.S. plan contains “many positive aspects,” implying that diplomatic progress may be approaching.
Even so, the Fed’s policy outlook remains the dominant driver. JPMorgan Chase has reversed its forecast and now expects the Fed to cut rates in December instead of delaying until January. Michael Feroli’s economics team cited dovish comments from key Fed officials — especially New York Fed President Williams — as the reason for the shift. JPMorgan had previously expected the Fed to stay put after the September jobs report.
A new variable also attracting attention is the selection process for the next Fed Chair. Bloomberg reports that White House economic adviser Kevin Hassett — seen as dovish — has emerged as a leading candidate. The likelihood of a more dovish Fed leadership further strengthens expectations of rate cuts, pressuring the dollar and supporting gold. Treasury Secretary Bessant said the nomination could be announced before Christmas.
Overall, markets perceive that the key question now is how quickly the Fed can implement the rate-cutting cycle. Karl Schamotta of Corpay noted that markets are leaning toward expectations of more aggressive easing. In a similar move, Deutsche Bank raised its 2026 gold price forecast to 4,450 USD/oz, based on steady investment inflows and rising central bank gold-reserve demand.
While geopolitical risks appear to be easing, the outlook for U.S. monetary policy continues to be the primary driver shaping gold’s direction in the short and medium term.
Technical Analysis OANDA:XAUUSD
Gold price is maintaining the main uptrend on the daily timeframe, still moving within the ascending channel established since August. The latest session closed around 4,147 USD/oz, trading above the short-term MA21 and approaching the technical resistance zone at 4,128 (Fib 0.236) and the major resistance at 4,216 USD.
• Structure: Series of higher lows + rising channel intact → underlying trend remains bullish.
• Key support: 3,972–4,000 USD (Fib 0.382 + channel lower boundary/MA21). If this zone holds, the bullish outlook remains valid.
• Short-term resistance: 4,128 USD (Fib 0.236). A breakout above this level opens the path toward 4,216 USD and beyond.
• Momentum: RSI rebounded from the neutral zone → buying pressure has returned but remains moderate; no clear bearish divergence.
• Conclusion: Market structure remains bullish, but confirmation is needed via a breakout above 4,128 USD to validate a new bullish cycle.
Summary:
The main trend is still upward, but the market is awaiting a confirmed breakout of the 4,128–4,216 USD zone to enter a strong bullish phase. If price falls below 3,972–4,000 USD, the plan should be reassessed due to the risk of a pullback toward the 3,846 zone (Fib 0.5).
Trading Plan
SELL XAUUSD — 4195–4193 ⚡️
Stop Loss: 4199
Take Profit 1: 4187
Take Profit 2: 4181
BUY XAUUSD — 4109–4111 ⚡️
Stop Loss: 4105
Take Profit 1: 4117
Take Profit 2: 4123
Trade ideas

11.27 Asian early-sessiong plan for goldI. Best Execution Outcome of Yesterday’s Strategy
Combined with yesterday’s European/North American session strategy and the current chart:
Long Strategy: If you entered a long position in the 4154-4158 zone during yesterday’s European session, the price peaked at 4168.78 (near the first target of 4170), locking in ~10-14 pips of profit. Holding into the North American session would still reach the first target of 4168, but volatility narrowed due to the Thanksgiving holiday, so 4172 was not breached.
Short Strategy: Yesterday’s North American session did touch the 4170-4172 short entry zone, but no clear reversal signals (e.g., bearish engulfing/shooting star) emerged — so the short setup was not triggered (this counts as a prudent wait for valid confirmation).
II. Trading Strategy for Today (Thanksgiving Holiday)
Key Pre-Reminder: Given the U.S. Thanksgiving holiday (low liquidity, early market close, and muted volatility), avoiding trading entirely is the most risk-averse and suitable choice for today.
If you still choose to participate (for small-scale practice), use an extremely conservative range-trading plan:
1. Core Approach
Stick to micro-range scalping only (no trend trades — low liquidity drastically raises false breakout risks).
2. Minimal-Risk Trading Plan
Range Boundaries: 4158 (support) → 4168 (resistance)
Long Setup: Enter only if price hits 4158 with a clear hammer candlestick; position size: ≤3% of total capital; Stop-loss: 4155; Take-profit: 4165.
Short Setup: Enter only if price hits 4168 with a clear shooting star; position size: ≤3% of total capital; Stop-loss: 4171; Take-profit: 4162.
3. Non-Negotiable Holiday Rules
No overnight positions: Close all trades before 19:00 UTC (well ahead of the early North American close at 22:00 UTC).
Strict position limits: Do not allocate more than 5% of total capital to trades today.
Prioritize inactivity: If no clean signals appear within 1 hour, step away — sitting out is the best choice for holiday markets.
GOOD LUCK!
LESS IS MORE!

GOLD opened with a significant increaseOANDA:XAUUSD opened the morning of November 26 with a significant gain, following a volatile session yesterday when the market absorbed two conflicting signals: unexpected progress in Russia-Ukraine peace talks and growing expectations that the Federal Reserve will cut interest rates as early as December.
In the European session yesterday, spot gold fell to a daily low of $4,109.47/ounce, as news that Ukraine had “basically” agreed to a US-proposed peace plan boosted global risk appetite. Market sentiment immediately reflected capital flows out of defensive assets.
However, in the New York session, gold reversed sharply, hitting a peak of $4,159.39/ounce, recovering nearly $50 from the previous low. At the end of Tuesday’s session, gold stood at $4,130.76/ounce, down slightly by 0.1%. By this morning, November 26, the price had returned to the $4,164/ounce area, up nearly 1% on the day.
Geopolitics: Peace Signals Weaken Need for Shelter, But Not Enough to Change the Game
Kyiv has agreed in principle to Washington’s peace proposal, according to US and Ukrainian officials. Some sensitive details remain to be worked out, but many contentious points have been tweaked. The Trump administration’s original 28-point plan has been whittled down to 19, with some provisions “at least worth considering,” according to The Washington Post.
Negotiations began in Geneva on November 23, and both Bloomberg and US officials described the process as streamlined to reach a quick deal. President Trump even declared a peace deal “very close.” This news immediately sent gold prices sharply lower yesterday, demonstrating that the market remains sensitive to geopolitical developments, even when peace signals are still preliminary.
Technical analysis and suggestions OANDA:XAUUSD
Gold price maintains the main uptrend on the daily chart, trading around $4,160/oz within the medium-term ascending channel. The price is currently above the short-term MA21 (~4,056) and has bounced from the support zone around Fib 0.382 (≈3.973); RSI is recovering slightly from the neutral zone, indicating weakening selling pressure.
The 4.128 (0.236 Fib) zone is the first short-term resistance; 4.216 is the key resistance that determines the possibility of opening a new bullish cycle (extremely important). If the price holds above 3.972–4.000 and closes sustainably above 4.128, the possibility of continuing to challenge 4.216 → 4.380 increases. Conversely, a break below 3.972 will weaken the bullish structure and open the door to the 3.846 (0.5 Fib) zone or lower.
Macro backdrop: Fed easing expectations and geopolitical risks continue to be the support base; positive news on interest rate cuts will increase the probability of a breakout above the 4.216 resistance.
BUY XAUUSD PRICE 4235 - 4233⚡️
↠↠ Stop Loss 4239
→Take Profit 1 4227
↨
→Take Profit 2 4221
SELL XAUUSD PRICE 4153 - 4155⚡️
↠↠ Stop Loss 4149
→Take Profit 1 4161
↨
→Take Profit 2 4167

Elliot Wave TheoryElliot did a beautiful thing for us why analyzing the market for us
now we benefit fro his wave theory.
Good luck.


Gold Analysis for next week.The market continues to trade within a large symmetrical triangle, defined by the two red converging trendlines. This tightening structure reflects a period of consolidation following the strong rally seen from late August into October.
Price action is currently holding above the ascending lower trendline, showing buyers are still defending higher lows. At the same time, attempts to break above the upper descending trendline have repeatedly failed, keeping momentum neutral and compressing volatility.
Key Levels to Note
Support Zones:
4,002 – 3,974: A cluster of support formed around the 0.618 and 0.5 Fibonacci retracement levels.
3,937: Mid-range support.
3,882: Major downside support if the triangle breaks bearish.
Resistance Zones:
4,133 – 4,249: Heavy resistance area aligned with the upper trendline and multiple fib levels.
A breakout above this zone would signal a shift in momentum.
Market Structure
Price is coiling between higher lows and lower highs, a classic sign of energy building before a strong directional move. As we move closer to December, the triangle apex approaches, suggesting a breakout is likely soon.
What to Watch Next
Bullish scenario: A clear breakout above 4,200–4,250 could trigger a continuation toward 4,381, with further potential to revisit or exceed the prior highs.
Bearish scenario: A breakdown below the ascending trendline and 4,000 may open the door toward 3,937, and deeper into the 3,882 zone.
Overall, the chart shows a compression phase, and the next decisive move out of the red triangle structure will likely determine the medium-term direction.

XAU/USD: Gold Stagnates, Poised for a Strong Surge📊 Market Structure
Gold is moving in a tight accumulation phase (compression) between two important zones:
• OB Support: 4,130 – 4,126
• Resistance – Small Supply: 4,148 – 4,166
The previous trend remains a strong uptrend (clear BoS sequence from 4,089), and currently, the price is retesting the newly formed peak-bottom structure.
The BUY side is still in control as long as the price stays above:
• 4,130 – Main OB Support
• 4,104 – Discount FVG
• 4,089 – Key Low Confirming Trend
If gold holds these zones, the next targets will be the upper liquidity levels:
• 4,166
• 4,181
• 4,207
• 4,243
💎 Key Technical Zones
• OB Support 1: 4,130 – 4,126
• FVG Zone: 4,104 – 4,089 (best discount)
• Deep Bearish OB: 4,060 – 4,045 (if price drops sharply)
• Upper Liquidity Targets: 4,166 → 4,181 → 4,207 → 4,243
🎯 Trading Plan (Priority BUY)
1️⃣ BUY 1 – Retest OB 4,130
When the price touches the OB support zone 4,130 – 4,126 and shows a bounce signal (rejection / engulfing).
• Entry: 4,130 – 4,126
• SL: below 4,115
• TP1: 4,166
• TP2: 4,181
• TP3: 4,207
• TP4: 4,243
→ Quick setup, good RR, trend aligned.
2️⃣ BUY 2 – Discount FVG 4,104 – 4,089
This is the best BUY zone if the market drops sharply before rising.
• Entry: 4,104 – 4,089
• SL: 4,070
• TP1: 4,166
• TP2: 4,181
• TP3: 4,207
• TP4: 4,243
→ Strong confluence: FVG + fibo discount + key liquidity.
3️⃣ BUY 3 – Deep Accumulation at Bearish OB Shift
• Entry: 4,060 – 4,045
• SL: 4,020
• TP: 4,104 → 4,166 → 4,207
→ Only activate if “flush liquidity” appears.
🎯 SELL Scalp (secondary – not priority)
Only SELL when there is a clear rejection reaction at:
• 4,166 – first liquidity sweep zone
• 4,181 – strong reaction zone
• 4,207 – main bearish OB
• 4,243 – large liquidity peak
• SL: 10–15 USD
• TP: 4,148 → 4,130
→ For scalpers only, not a main setup.
🧠 Vincent’s View
The market structure remains completely bullish. The market is accumulating energy in a narrow range before breaking strongly to the upper liquidity targets.
As long as gold stays above 4,089 – the uptrend remains dominant.
“Patience builds the entry – liquidity completes the move.” ⚜️
⏰ Timeframe: 1H
✍️ Analysis by: Captain Vincent

Gold next move (NFP TRADE PLAN)(20-11-2025)Go through the analysis carefully, and do trade accordingly.
Anup 'BIAS for the day (20-11-2025)
Current price- 4080
1st scenario (high probability)
4020-4030 area for buying for target 4050,4100,4150,4250
1st scenario (moderate probability)
4120-25 area for selling for target 4100,4090,4080,4050.
Best of luck
Never risk more than 1% of principal to follow any position.
Support us by liking and sharing the post.

THE GOLDEN-PRINT STRATEGY XAU/USD is currently trading around $4,100–$4,150. The chart shows a rising wedge pattern, indicating a potential bearish reversal. In the short term, Trump’s involvement in the crypto space could weigh on gold, but over the medium term, gold may strengthen as G20 nations move toward transactions outside of the dollar system.

(Gold) on the 1H timeframe.Price is currently trading near 4147 after rejecting multiple times from the upper resistance zone around 4170–4175 (BSL zone).
This area appears to be a liquidity region where buyers previously tried to push higher but failed to sustain momentum.
On the lower side, a strong support zone is marked around 4120–4130 (SSL zone), indicating a possible liquidity sweep if price breaks below.
Projected movement is drawn with two potential scenarios:
1. Bearish path:
Price may attempt to move lower towards 4135 → 4125 → SSL 4120, clearing liquidity before a possible reversal.
2. Bullish recovery path:
If buyers hold the mid-range and regain momentum, price could retest 4160 → back into 4170–4175 BSL zone, where further rejection or breakout will decide continuation.
Summary
• 4170–4175 = Major Resistance / BSL Zone
• 4120–4130 = Support / SSL Zone
• Market is currently in a range with liquidity targets on both sides
• Break and close outside of either zone may define the next trend leg

The overall trend remains bullish📌 Scenario 1 – Gold completes its correction toward 3857 and then resumes the uptrend
In this scenario, Gold could complete its corrective move toward the 3857 zone before starting a clean bullish leg
This level represents:
A potential completion of the correction
A liquidity grab area
An institutional demand zone
If price taps this zone and shows a clean bullish reaction, I expect a strong continuation to the upside, targeting a new ATH
📌 Scenario 2 – If price breaks Wave 1 → Direct bullish explosion and new ATH
If Gold breaks the Wave 1 level without revisiting the lower correction zone this could trigger a direct bullish continuation what I call the “big pump”
A clean breakout above Wave 1 would be a strong technical signal that Gold is ready to push into a new all-time high

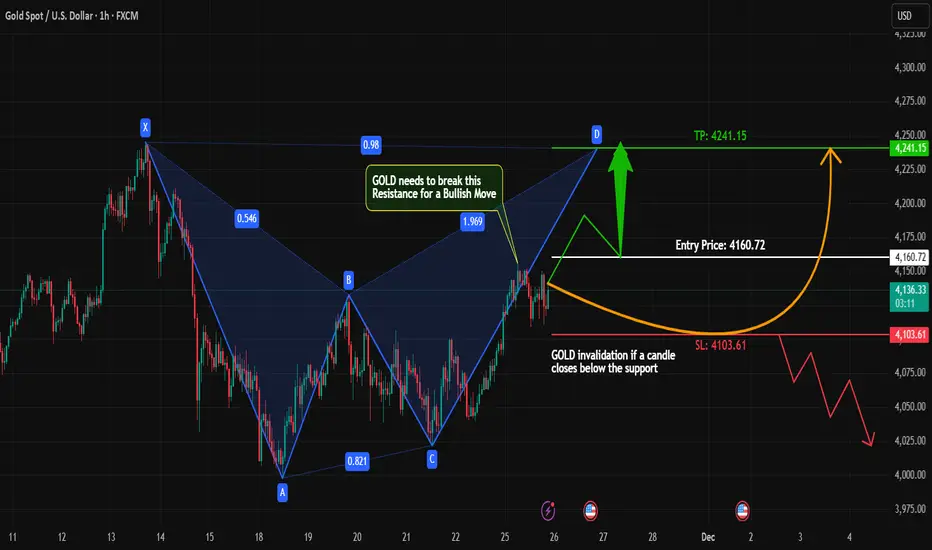
“BOS Confirmed — Demand Retest for Next Bullish Leg🟡 GOLD (XAU/USD) – Bullish Continuation Setup from High Probability Demand Zone 🆙
🔍 Chart Breakdown & Key Insights
Price created a Break of Structure (BOS) to the upside → confirming bullish momentum ✔️
Retested the Demand Line + Support Zone → buyers defending strongly 💪
High Probability POI (previous accumulation zone) remains valid with liquidity swept below → smart money accumulation evidence 💰
Current pullback = healthy retracement into demand before potential continuation
🎯 Targets (With stickers)
🎯 Target Zone Price Region Sticker
TP1 → Retest recent high 4,165 – 4,175 🎯
TP2 → Liquidity above highs / extended target 4,180 – 4,195 🚀💸
TP1 hit possibility is HIGH due to bullish structure 📈
TP2 depends on strength of breakout ⬆️
📌 Trade Idea (High Probability Setup)
🟩 Buy Entry Zone:
➤ 4,120 – 4,130 (pullback entry at support)
🟢 Take-Profit:
➤ TP1: 4,170 – TP2: 4,190
📊 Risk-Reward Ratio: 1:2.5 – 1:3+ ✔️
🧭 Market Structure Sentiment
Factor Outlook
Trend Bullish 📈
Liquidity Upside still available 💧
Smart Money behavior Accumulation & continuation expected 💼
⚠️ Just watch if price breaks below the demand line → would weaken this bullish plan.

XAU/USD: Strong Rally Fueled by Fed Rate Cuts and Weak USDGold prices have experienced a strong growth on November 24 , supported by expectations that the Fed will lower interest rates next month. The weakening USD has made gold less expensive for holders of other currencies, thereby driving the price of gold higher. The market is increasingly confident that the Fed will continue to cut interest rates , creating a favorable environment for gold to rise.
Chart Analysis: On the H4 chart, XAU/USD is trading within a clear ascending wedge . After testing the 4,090 support zone, the price could rebound and aim for 4,200. The support at 4,090 remains intact, indicating that the upward trend could continue in the short term. A break above the resistance levels near 4,150 could open up opportunities for gold to continue its upward movement.
Conclusion: With a positive macro backdrop and strong technical indicators , XAU/USD may continue its upward momentum, with a target of 4,200 in the near term, as long as the current trend persists.


XAUUSD – H1 uptrend channel, short-term downside risk increasingXAUUSD – H1 uptrend channel, short-term downside risk increasing Brian – Prioritize short selling at the channel peak, wait to buy back at lower support
I. Strategy Summary Gold is trading in an uptrend channel on H1, but the rise around 4.160 shows signs of weakening, increasing short-term correction risk.
Preferred Scenario: Short sell at the channel peak 4.162–4.164, targeting support areas 4.145 – 4.130 – 4.115 – 4.100.
After the correction, the 4.100–4.080 area may become the foundation for the next rise in the larger trend.
Important price areas to watch: 4.139 – 4.127 – 4.110 – 4.088.
II. Macro Context & News 27/11
02:00 – Fed releases Beige Book This document updates the Fed branches' assessment of the US economic situation.
Describing slower growth, cooling price pressures will further reinforce expectations that the Fed will soon cut interest rates → supporting gold.
Conversely, if the Beige Book describes the economy as still “resilient,” the market may temporarily slow down pricing in rate cuts → causing a short-term adjustment for gold.
19:30 – ECB releases October meeting minutes
If the minutes lean towards the scenario of keeping high interest rates longer, the EUR may be supported, indirectly affecting the USD and gold inflows.
However, the impact is usually not as strong as US data, mainly affecting the overall risk-on/risk-off sentiment.
General Context: Gold has surpassed 4.160 USD/oz as the market increasingly expects the Fed to cut interest rates as early as December, reducing the appeal of interest-bearing assets and increasing the allure of gold – a non-yielding asset. This creates a support foundation for the medium-term uptrend, but after a hot rise, technical adjustments on H1 are normal.
III. Technical Structure – H1 uptrend channel
The price is within the H1 uptrend channel, with rising peaks and troughs, but the upper area near 4.160 coincides with:
The upper boundary of the price channel. The “Sell POC” area on the chart – where liquidity and sell orders are concentrated.
Preferred scenario on the chart: The price may slightly rebound to the POC area 4.162–4.164, then be rejected and slide to the important support area around 4.110 before extending the adjustment down to 4.100–4.080.
The lower trendline of the uptrend channel also acts as a short-term buy area if a clear candle reaction appears.
Notable price areas on H1: Resistance: 4.162–4.164 (channel peak + POC). Intermediate support: 4.139 – 4.127 – 4.110. Deep support: 4.088 – 4.080 – 4.100 (area that may form the bottom for the next rise).
IV. Trading Plan 1. Preferred Scenario – Short sell at the channel peak Idea: Short sell when the price rebounds to the upper boundary of the H1 uptrend channel and POC 4.162–4.164, expecting a correction to support.
Sell: 4.162–4.164 SL: 4.168 TP targets: TP1: 4.145 TP2: 4.130 TP3: 4.115 TP4: 4.100
This is a counter-move order in the uptrend channel, only targeting a short-term correction, not a major trend reversal scenario.
2. Supplementary Scenario – Short buy at support trendline Idea: When the price hits the lower trendline of the H1 uptrend channel and a nice candle reaction appears, consider a short-term buy according to the channel, prioritizing areas:
4.139 – 4.127 – 4.110 – 4.088
Specific Entry/SL levels will depend on the actual price reaction at the trendline, but the general principle:
Buy close to the trendline,
SL placed below the immediate support area,
TP aimed at the middle of the channel or the nearest resistance.
V. Risk Management & Notes
Do not open new positions right before or at the time of the Beige Book and ECB minutes release, as volatility may suddenly increase, widening spreads.
The sell order at 4.162–4.164 is a short-term counter-trend order in the uptrend channel, requiring moderate volume and strict adherence to SL 4.168.
If the price clearly breaks and holds above the 4.170 area, the H1 correction scenario weakens – in that case, stay out, wait for a new structure instead of trying to maintain a sell view.

Gold buy ideaGold Analysis
Gold is rejecting the London Low with a strong wick, showing buyers stepping in at a key level.
How to Trade It
1️⃣ Wait for the 15m candle to close
Wait for confirmation that price is holding above the rejection zone.
2️⃣ Targets (TPs)
TP1: 4139
TP2: 4150
3️⃣ Risk Filter
If the next candle closes below the previous 15m candle, do not take the trade. This signals weakness in the setup.

XAUUSD_15M_BuyGold Analysis in Short-Term Time Frame
The market is forming a corrective triangle and could continue to rise by completing the correction again.
Support Area 4122
Target Area 4185

XAUUSD (Gold) Next Buying Move Analysis XAUUSD Analysis (1H Chart)
Price is moving inside a clear range, reacting between the marked support and resistance zones. After forming a strong low at the support area, the market is showing signs of a potential pullback toward the resistance zone above. If price retests this resistance and fails to break higher, a clean short opportunity can form, targeting the support zone again.
Overall structure shows BOS/CHOCH confirming internal shifts, so wait for bearish confirmation at resistance before entering shorts. Perfect setup for range-to-range trading.
❤️ please support with Boost and Comments Really i need your support please give feedback thankyou ❤️

GOLD Long Setup Loading… Watching the Final Harmonic Leg!#Gold has been consolidating sideways on the higher timeframes, but things are getting interesting on the 1H chart. A clean Harmonic Pattern is developing, and the final leg is almost complete.
What I’m Watching:
A breakout above the immediate resistance zone.
Once price breaks and closes above this level, it can trigger a strong upside move as the harmonic pattern completes.
My Trading Plan:
Go long only after a confirmed breakout
Wait for candle close above resistance
Follow strict risk management and avoid early entries
This setup has potential for a solid risk-to-reward if it plays out.
Let me know in the comments if you want the exact levels or chart screenshot!
What do you think—Will Gold break out or reject again?
Like, comment, and follow for live trade updates & more chart ideas!
#GOLD #XAUUSD #HarmonicPatterns #PriceAction #BreakoutTrading
#TechnicalAnalysis #Forex #Commodities #TradingSetup #SwingTrade
#DayTrading #MarketAnalysis #ChartPatterns #TraderCommunity
XAUUSD: Market Analysis and Strategy for November 27Gold Technical Analysis:
Daily Resistance: 4210, Support: 4000
4-Hour Resistance: 4180, Support: 4110
1-Hour Resistance: 4170, Support: 4130
The weekly chart continues its bullish trend. Tomorrow's monthly/weekly chart closes, directly impacting the December technical outlook.
The daily chart continues its upward trend. The newly formed "rounded bottom" needs to be monitored for its sustainability. Bollinger Bands are widening upwards, and the middle band and moving average support are gradually moving upwards. As mentioned in recent analyses, the main strategy is to follow the trend and be bullish. The next key level to watch is 4200. Long-term holders can wait for the Fed's interest rate decision before buying. The ideal long-term entry point for gold remains below 4000; however, short-term traders can buy low and sell high.
Based on the 1-hour chart, gold continued its upward trend during the European session, with the candlestick pattern indicating an upward channel. The next resistance level to watch is around 4180, followed by the psychological resistance at 4200. Support levels are around 4150/4140.
Trading Strategy:
BUY: 4150~4140
Selling strategies should be determined based on the real-time candlestick pattern.
More Analysis →

Gold weekly chart with buy and sell levelsNo big update this week heading away for a few days.
As always wait for levels these levels will come into play all week

GOLD → Psychological level retest before growth FX:XAUUSD breaks through consolidation resistance and renews its high to 4155. As part of a minor correction, a retest of 4100 may form and a battle for key support...
The probability of a Fed rate cut in December has risen to 81%. Fed members (Williams, Waller, Daly) supported the possibility of easing this year.
Progress in negotiations between the West and Ukraine with Russia reduces demand for defensive assets.
Gold remains sensitive to inflation and retail sales data. Strong figures could adjust rate expectations and limit growth, while weak data would support the bulls.
Technically, a retest of the 4110-4100 zone is forming. If the bulls hold their ground above this level, a new trading range of 4100-4150 could form.
Resistance levels: 4155, 4211
Support levels: 4111, 4100
The importance of the 4100 zone is that it is an area of imbalance and breakeven, a consolidation boundary, as well as a psychological level. Accordingly, the reaction to this area should be aggressive. If the reaction is weak, the price may be dragged below 4100. Otherwise, I expect consolidation above 4111 and further growth to 4155 (possibly to 4200).
Best regards, R. Linda!

Report 26/11/25Report Summary
Kyiv has told Washington it is prepared to sign a U.S.-drafted framework to end the war, a plan that, crucially, was informed by consultations with the Kremlin. The Wall Street Journal reports the draft came from the Trump administration’s special envoy and that Moscow’s input shaped key sections; the White House sees it as the fastest path to halt fighting and unlock reconstruction finance. Ukraine’s signal of receptivity is the first clear public step toward a negotiated endgame in many months.
Independent reporting indicates the U.S. draft is broadly consistent with a stream of “peace principles” circulated to allies this month; terms range from cease-fire and demilitarized zones to security guarantees and phased sanctions relief tied to compliance. Reuters confirms a U.S.-backed proposal is in play and being briefed in allied capitals. Markets responded with a familiar “risk-on in cyclicals / risk-off in defense & energy beta” intraday pattern, while the Journal’s markets desk flagged choppy equity trade into the U.S. holiday week as investors weighed the peace headlines against a heavy AI earnings calendar and delayed labor data.
A parallel European track matters for financing: Brussels is pushing ahead with an EU plan to mobilize the windfall profits from frozen Russian assets into a large loan program for Kyiv, despite U.S. proposals that would channel more of those assets into American-led investment vehicles. If EU leaders sign off, that structure would provide multi-year disbursements and legal cover for European banks to participate. Together, the diplomatic movement and funding design shift the distribution of macro risks away from a prolonged attrition war toward a negotiated freeze with staged sanctions relief, still highly uncertain, but credible enough for markets to begin repricing tail risks.
Macro context you should factor in now
Europe’s growth engine is sputtering. In a notably blunt speech, ECB President Christine Lagarde warned the bloc’s “old” export-heavy model has become a vulnerability, urging policymakers to remove internal market barriers and strengthen domestic demand; she underscored that six years of inaction would lock in a lower growth path. That stance implies a bias to keep rates on hold and to lean on structural policy rather than monetary easing to revive growth. At the same time, Vanguard cautions that markets are pricing too many Fed cuts for 2026–27 given the ongoing AI-capex boom that is supporting U.S. growth and may limit how far policy can ease without reigniting inflation.
In Asia, Japan’s new prime minister Sanae Takaiichi has unveiled a ¥21.3tn (≈$135bn) package, Japan’s largest since the pandemic, mixing household subsidies with tax cuts. The fiscal impulse has pushed JGB yields to multi-decade highs and kept the yen under pressure, even as foreign investors stepped in to buy long-dated paper at the fastest pace in more than two decades. Expect the MoF/BoJ to keep FX-intervention optionality alive if volatility spikes.
Finally, Western capitals are coordinating a response to Chinese steel overcapacity, an OECD-anchored process that could harden into tariff-quota regimes in 2026. That’s a medium-term positive for EU/U.S. steel margins, but it’s also another wedge in the global goods dis-inflation story and one more lever on bilateral frictions.
Market reactions and positioning (near-term, then 3–12 months)
S&P 500 / Dow Jones. Equity indices traded choppy but resilient as investors rotated within cyclicals: a cease-fire path reduces left-tail risks on energy costs and European growth, while AI capex continues to anchor U.S. earnings visibility. Into year-end, breadth should improve if peace odds rise and if bond volatility eases alongside Japan’s policy clarity. Base case: mild multiple support and “quality-cyclical” leadership (industrials, select financials) over pure defensives. Risk case: talks stall and oil spikes; or U.S. data re-accelerate too much, forcing repricing of Fed cuts.
DXY / USDJPY. The peace track is modestly dollar-negative through the energy channel and European risk premium, but Japan’s outsized fiscal push and high JGB term premia are yen-negative. Netting those, USDJPY likely remains bid on rallies unless BoJ signals faster balance-sheet adjustments or MoF intervenes. Watch the 150–158 corridor as intervention-risk territory.
XAUUSD (Gold). A credible cease-fire path trims the geopolitical bid for gold at the margin; however, if markets scale back the number of Fed cuts after strong AI-led capex, real yields could firm and further cap upside. Conversely, any breakdown in talks or an escalation around sanctions-for-compliance would quickly restore safe-haven demand. Net: tactically neutral/slightly lower with strong dip buying below key moving averages.
Crude oil. Risk premium eases on peace momentum and EU financing clarity. Brent’s downside is cushioned by OPEC+ discipline and low OECD commercial stocks, but the path of least resistance is lower volatility and a gradual grind toward the marginal-cost band if a freeze holds. Keep an eye on any carve-outs in the U.S. plan that adjust Russian export constraints; these would feed directly into term structure.
European equities / banks. A peace pathway and EU loan architecture are constructive for battered EU cyclicals and select banks via lower energy costs, better NPL outlooks in CEE exposures, and potential steepening if fiscal overhangs are credibly financed. The counterweight is Lagarde’s “new model” push, which accepts slower trade-led growth—so stock selection will matter.
Forecasts
In the next 1–3 months, the negotiation calendar itself will drive variance. Expect alternating bursts of optimism and risk-off: drafts circulated to allies, leak-driven disputes over security guarantees, and EU legal work on the asset-profits loan will each move cross-assets. Base case (55%): a de-facto truce framework emerges with monitoring and staged sanctions relief linked to compliance; energy vol compresses; European PMI troughs look durable. Bear case (30%): talks stall on territory/sequencing; sanctions tighten; commodity vol revives. Bull case (15%): cease-fire plus rapid reconstruction commitments pull forward capex and Europe outperforms.
On a 6–12 month horizon, the contours of post-war financing matter most. If the EU loan goes ahead, with windfall-profit capture from immobilized assets, it creates a predictable disbursement channel that encourages private lenders to re-enter Ukrainian infrastructure and housing with multilateral guarantees—a modest positive impulse for European capital-goods and specialty materials. U.S. domestic politics will determine whether Washington emphasizes sanctions relaxation for compliance (market-friendly) or leans on secondary sanctions to enforce terms (dollar-positive, EM risk-negative).
Fiscal and political implications
For Europe, Lagarde’s call to dismantle internal market barriers and double-down on domestic strengths signals less willingness to “buy growth” with rate cuts and more pressure on capitals to pursue supply-side reforms. That stance, combined with a Ukraine-funding mechanism housed in EU law, should keep periphery spreads contained so long as growth doesn’t undershoot.
For the U.S., an endgame that pares back energy volatility and reduces headline inflation noise helps the Fed achieve disinflation without over-easing. Vanguard’s warning on “too many cuts priced” suggests a risk that the policy path stays firmer for longer if AI-capex remains torrid, supportive of the dollar versus low-yielders, but not versus a reforming Europe if energy risk fades.
For Japan, the stimulus-driven rise in yields, paired with foreign demand for duration, underscores a regime change away from yield-curve-control: global term premia will take their cue from JGBs as much as from U.S. Treasurys on big days. FX-intervention risk rises with each new fiscal headline if USDJPY surges into the high-150s.
Key risks to monitor
First, talks unravel: if territorial language or sequencing of sanctions relief becomes a deal-breaker, oil and gold spike, the dollar catches a safety bid, and European equities underperform again. Second, EU legal friction: if member-state courts or the ECB contest the asset-profits loan structure, Ukraine financing could slip, risking a cohesion shock. Third, policy mistake in Japan: an overly large supplementary budget or clumsy signaling could disorder the JGB market and spill into global rates, pressuring long-duration equity multiples. Fourth, trade flare-ups: coordinated steel defenses in 2026 would be inflation-neutral to slightly positive and geopolitically sensitive if China retaliates.
Actionable takeaways by asset
XAUUSD: Fade spikes on positive-headline days; keep a core tail-risk hedge given non-trivial negotiation failure risk. Correlation to real yields likely reasserts if peace odds rise.
S&P 500 / Dow: Favor quality cyclicals (industrials, rails, select banks with EU/CEE exposure) and capex beneficiaries; underweight pure energy beta until the talks path is clearer.
USDJPY / DXY: Maintain a buy-the-dip bias in USDJPY with tight risk controls around known MoF-watch levels; DXY path modestly lower if Europe’s energy risk premium collapses, but resilient versus JPY.
Crude: Expect lower vol and mild contango if cease-fire contours harden; hedge upside tails via call spreads into each major negotiating round.
European equities: If EU financing clears and peace momentum holds, rotate toward European capital-goods, building materials, and quality small/mid financials; avoid names most levered to wartime energy spreads.
