GOLD XAUUSD 4HR /3HR CHARTTHE YELLOW METAL SELLOFF CONTINUES ON FOMC FEDERAL FUND RATE OUTLOOK.
the key technicality surrounding gold trading is as follows
the 4hr EMA10,EMA20,EMA50,EMA100 are all above price supporting bearish take profit only the 4HR EMA200 IS below price acting as dynamic support on 4hr at 3945-3940 + ema 200 support for buy.
THIS WILL BE LAYER BY LAYER.
THE DOLLAR INDEX DEFENDED 98.757 SUPPORT FLOOR INDICATING A POSSIBLE BUY POSITION ON DOLLAR INDEX PENDING THE OUTLOOK OF THE FOMC .THIS PRICE ACTION PUT GOLD LONG POSITION ON CAUTIOUS MODE.
THE UNITED STATE 10 YEAR TREASURY BOND YIELD CLOSE IN MASSIVE SELLOFF TO CLOSE BELOW 4.0% MARK AT EXACTLY 3.987%
GOLD CORECTION IS PLAYING ON CAUTION AND the next demand floor will around 3767.90-3764-3760
finally the last layer by layer will be 3700-3706 my pay day zone ....at this level expect to see the hand of GOD.
NOTE;gold trading is very volatile but comes with liquidity ,pls manage your risk and i wish you good luck.
#GOLD #XAUUSD #DXY #US10Y
Trade ideas

Gold Extends Decline Below $4,000 as Risk Appetite Returns🔍 Market Context
Gold continues to struggle amid renewed optimism around US–China trade talks.
The shift in sentiment has reduced safe-haven demand, while softer expectations of further Fed rate cuts keep the US Dollar capped — offering limited downside support for XAUUSD.
However, the technical landscape remains clearly bearish.
The break below the $4,000 handle confirms continuation of the downtrend first outlined in early-week plans.
📊 Technical Analysis
Structure: Gold maintains a clean bearish channel on the H1–H4 frame.
Immediate resistance: $3,985 – $4,000 (former support, now supply zone).
Target zones:
• Short-term liquidity area near $3,925–$3,930
• Extended target sits around $3,880–$3,860, aligning with Fibo 1.618.
Invalidation: Only a sustained break and hold above $4,020–$4,030 would neutralize this short-term bearish bias.
🎯 Trading Outlook
If gold retests the broken $4,000 zone and fails to regain it,
expect sellers to extend control toward $3,920 or lower ahead of the FOMC meeting.
That event may later define the next recovery point — but for now, momentum remains firmly on the downside.
⚜️ Summary
Gold’s recent slide isn’t random — it’s structural.
The market is rebalancing after excessive bullish sentiment,
and liquidity below $3,900 is likely to attract attention before any significant rebound.
Watch the reaction near $3,920–$3,880 —
that’s where the next meaningful decision for gold may emerge.
📊 MMFLOW TRADING Insight:
“Smart money doesn’t chase candles — it waits for liquidity to shift.”

XAUUSD Best level to sell is this.Gold (XAUUSD) has turned bearish, at least on the short-term, as it broke below its 4H MA50 (blue trend-line) for the first time in a month and is headed for its 4H MA200 (orange trend-line).
Having made a Double Top at the start of the downtrend, the pattern that seems to be emerging is a Channel Down, with the last such formation seen in April - May.
So far the 4H RSI sequences between the two patterns are identical, so we expect a rebound now, which can give us the most optimal level to short again near the top of the Channel Down.
A break above 0.786 invalidates this, but as long as it holds, our Target will be the -0.236 Fibonacci extension at 3920 just like on May 15, which also hit its 1D MA50 (red trend-line).
-------------------------------------------------------------------------------
** Please LIKE 👍, FOLLOW ✅, SHARE 🙌 and COMMENT ✍ if you enjoy this idea! Also share your ideas and charts in the comments section below! This is best way to keep it relevant, support us, keep the content here free and allow the idea to reach as many people as possible. **
-------------------------------------------------------------------------------
💸💸💸💸💸💸
👇 👇 👇 👇 👇 👇

4H weekly outlookKeeping it simple, expect a minor rise, hit FVG continue down, then a reversal from major support which should cover the news throughout the week. Personally I think we will see a 200 retest from the ATH if it makes it.

GOLD BEARISH BIAS|SHORT|
✅XAUUSD is reacting from a major supply level after a clean rejection of premium territory. Expect bearish continuation as price seeks to close the imbalance toward the marked target zone. Time Frame 4H.
SHORT🔥
✅Like and subscribe to never miss a new idea!✅

XAUUSD next week (October 27, 2025 - October 31, 2025)After yesterday's CPI news on 24/10/2025, we saw interest rates unfavorable for the USD. This makes gold continue its upward trend in the coming time. Targets are 4380-4475 respectively.

Will gold continue to fall on October 28?
I. Market Review and Fundamental Analysis
Gold successfully broke below the key psychological level of $4,000 during the U.S. trading session, declining continuously from the intraday high of $4,097 in the Asian and European sessions to a low near $3,971. The market is currently influenced by the rebound in U.S. bond yields (back above 4%), reflecting adjustments in investor expectations for a Fed rate cut and a temporary outflow of safe-haven funds from the gold market. The U.S. dollar index fell slightly by 0.14% during the day, but gold remains under pressure, with overall bearish momentum dominating.
II. Technical Analysis
Trend Structure:
The 4-hour chart indicates further downside potential for gold, with the $4,000 level now acting as a key resistance. A break above the $4,010 resistance level is required to open the upward channel, though the probability of an upward move remains low in the short term.
Key support below is located in the $3,945-$3,950 range. If this level holds, gold may transition into range-bound consolidation.
Short-Term Signals:
The 1-hour chart shows a "double top" pattern with a break below the neckline, and the moving average system is in a bearish alignment, indicating continued short-term downward momentum.
After breaking below the $4,004 support during the U.S. session, this level has now turned into resistance. Any rebound below this level can be seen as an opportunity to sell on rallies.
III. Trading Strategy and Approach
Main Approach: Focus on selling on rallies, with buying on dips as a secondary strategy, while strictly managing risks.
Resistance Levels: $4,010-$4,020
Support Levels: $3,945-$3,950
Specific Strategies:
Short Strategy (Sell):
Entry: Sell in batches when gold rebounds to the $4,010-$4,020 range.
Stop Loss: $4,025-$4,030
Target: $3,960-$3,950, with a further target of $3,945 if broken.
Long Strategy (Buy):
Entry: Buy lightly (position ≤ 20%) when gold pulls back to the $3,945-$3,950 range.
Stop Loss: $3,935-$3,940
Target: $3,980-$4,000, with a further target of $4,010 if broken.
IV. Risk Warning
Market volatility has intensified, and it is essential to strictly control position sizes (recommended total position ≤ 30%).
Always set stop losses and avoid holding losing positions. Focus on the dynamic impact of U.S. bond yields and the U.S. dollar index on gold.
Note: If the price quickly breaks below the $3,945 support, pause the long strategy and monitor the support performance in the $3,920-$3,930 range before adjusting the strategy.

Gold prices could fall below $4,000 today.Gold prices could fall below $4,000 today.
Progress in US-China trade negotiations has eased tensions between the two major economies, weakening gold's safe-haven appeal.
Investors are awaiting the results of the Federal Reserve's latest monetary policy meeting (expected to be released around October 30th), which will determine the future direction of interest rates.
If the Fed sends a clear signal of a rate cut, gold prices are expected to resume their upward trend.
Key Technical Analysis: If gold prices fall below the $4,000 mark,
further downward adjustments are possible. In the short term, focus on support around $4,000.
Day Trading Strategy:
Resistance: 4060-4080
Support: 4000-4020
-----------------------------------
Short Sell Level: 4040-4050
Stop Loss: 4070
Target: 4000-3900-3800
The above is today's trading strategy.

buy set up with high volume gold has reached a micro demand zoon again candle close green with high volume

Up again for goldHi traders,
Last week gold made a correction up and another downmove for the finish of a bigger correction wave 4 (orange). After that price consolidated.
So next week we could see the next impulsive wave up.
Let's see what price does and react.
Trade idea: Wait for a small correction down on a lower timeframe and a change in orderflow to bullish to trade longs.
This shared post is only my point of view on what could be the next move in this pair based on my technical analysis.
But I react and trade on what I see in the chart, not what I've predicted or expect.
Don't be emotional, just trade your plan!
Eduwave

GOLD (Xauusd) is going DOWN! great sell tradeAs you can see GOLD - Xauusd is in a clear downtrend. The red lines drawn show a downward channel which indicate that GOLD is now moving to the downside... Secondly, Gold has broken a powerful support level (the upper green line)! It is now very likely to head down to the lower green line (next support level). Great time to sell!

GOLD XAU/USD: Wave ((1)) Near Completion - Wave 2 Zigzag vs Flat GOLD: WAVE ((1)) COMPLETE - WHAT'S NEXT?
Wave ((1)) nearly finished at ~$3,989. Next: Wave ((2)) correction
to the $4,250 area. But which pattern?
━━━━━━━━━━━━━━━━━━━━━━━━━━━━━━━━━━━━
ZIGZAG (60% Probability) Pattern: A-B-C (sharp, V-shaped)
• Wave (A): Sharp 1-2-3-4-5 impulse
• Wave (B): Brief recovery (~30-40% of wave A)
• Wave (C): Sharp impulse (~equal to A or 1.618x A)
━━━━━━━━━━━━━━━━━━━━━━━━━━━━━━━━━━━━
FLAT (40% Probability) Pattern: A-B-C (sideways consolidation)
• Wave (A): Moderate move
• Wave (B): Recovery that reclaims wave A (~80-120% of A)
• Wave (C): Normally sharp 1-2-3-4-5 impulse (~50-120% of A)
If price retraces 100% of wave 1 (above $3,956) Structure INVALID
MY BIAS: ZIGZAG
Wave 1 was powerful → Sharp corrections follow
Support: $3,956 (invalidation level)
Resistance: $4,150 - $4,200 - $4,250
IMPORTANT ELLIOTT WAVE RULES FOR WAVE 2:
━━━━━━━━━━━━━━━━━━━━━━━━━━━━━━━━━━━━━━━━
✓ Wave 2 CANNOT retrace more than 100% of wave 1 (invalidation rule)
✓ Wave 2 CANNOT be a triangle (only B and (iv) can be triangles)
✓ Wave 2 CANNOT be a combination beginning with a zigzag
(combinations only if starting with a flat)
These rules help us eliminate possibilities and confirm structure.

Gold -Alternative TradeMy preferred entry level didn’t materialize yet may not, so it’s time to create an alternative tactic.
Main idea is to trade pennant pattern breakout. The take-profit target remains the same, but both the entry and stop levels are lower, reducing the risk-reward ratio from 3.98 to 2.85. This setup carries higher risk.
I will trade whichever pending order will be hit first and cancel the other one.
Original idea:

XAUUSD Daily Outlook – Bearish Trend Still IntactGold (XAUUSD) has been moving in a clear bearish trend for the last two weeks, showing consistent lower highs and lower lows. Despite short-term pullbacks, the market continues to respect the downward structure as sellers remain in control.
The 4000/4020 level is acting as a strong resistance zone, and price rejection from this area confirms continuation toward 3895. Momentum and volume both support further downside movement.
KEY POINTS:
CURRENT PRICE: 3980
TARGET: LEVEL : 3935
TARGET LEVEL : 3895
RESISTANCE : 4000/ 4020

Gold Buy at 4080 and sell at 4240Now gold in consolidation mode and trying to book profits and make the retail traders into the trap so for now we need to be patience and buy at 4080 and close at 4240, after the fed interest cut gold will come down so sell at 4240 and wait for long selling till 3966. This method is Wd Gann inspiration i made and am still learning, this one sharing for study purpose so trade with your own analysis.

XAUUSD: Bullish Reversal Setup From Triangle SupportHello everyone, here is my breakdown of the current Gold setup.
Market Analysis
Gold (XAUUSD) continues to trade within a larger bullish market structure, maintaining higher lows above its key ascending Trend Line. After a strong impulsive rally that pushed the price above the 4,200 resistance, the market faced rejection near the top of the Range and entered a corrective phase. This correction evolved into a triangle pattern, with price now testing the Triangle Support Line, aligning closely with the horizontal Support area around 4,020 – 4,000 — a historically important demand zone.
Currently, the price is consolidating near the lower boundary of this structure, showing early signs of stabilization. This region also coincides with the previous breakout point, adding further confluence for potential buyer interest.
My Scenario & Strategy
I expect the price to hold above the Triangle Support Line and form a bullish reversal structure, signaling that buyers are once again defending this level. A confirmed breakout above the Triangle Resistance Line would indicate renewed bullish momentum and a potential continuation of the overall uptrend.
My primary target zone lies around 4,215, where previous resistance and the upper range boundary converge. However, if the support near 4,000 fails to hold, it could trigger a deeper correction toward 3,950, where the next demand zone is located. This setup offers a favorable risk-to-reward opportunity for traders anticipating a rebound from a major technical confluence zone.
That's the setup I'm tracking. Thank you for your attention, and always manage your risk.

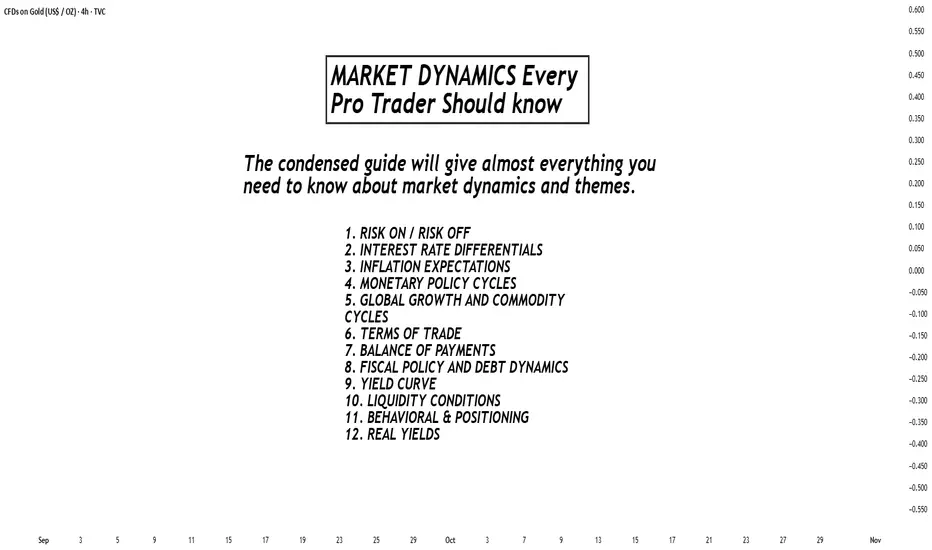
Markets Dynamics Every Pro Trader Should KnowMarkets move based on fundamental forces that shape pro traders behavior, capital flows, and asset valuations. I will cover the most important concepts that drive market behavior across all asset classes and are fundamental to professional traders.
RISK-ON / RISK-OFF DYNAMICS
The most important concept is the oscillation between risk-on and risk-off sentiment—investor willingness to take on risk in pursuit of returns.
Risk-On: Equities, commodities, high-yield bonds, and risk-sensitive currencies like AUD, NZD rise.
Typical triggers are: positive economic data, easy central bank policies, geopolitical stability.
Risk-Off: Safe-haven assets : USD, JPY, CHF, U.S. Treasuries, gold strengthen. This happens as money managers and investors prioritize capital preservation.
Typical triggers: negative economic data, geopolitical tensions, financial crises.
Why USD strengthens during risk-off:
USD has a global reserve currency status, and that structurally creates demand; deepest treasury market for holding capital; trillions in global debt denominated in USD.
Why JPY strengthens during risk-off:
Carry trade unwinding (investors close positions by buying back yen); Japanese institutions bring back home trillions in foreign assets during crises.
INTEREST RATE DIFFERENTIALS
Capital moves toward countries offering higher real interest rates (real rates = nominal rates minus inflation). This creates currency trends over weeks, months, and years.
Higher interest rates leads to higher bond yields, increasing capital inflows, resulting in currency appreciates
The Carry Trade: Borrow in low-yield currencies (JPY, CHF), invest in high-yield currencies (AUD, NZD), profit from interest rate differential. Carry trades unwind strongly during risk-off times due to leverage and crowded positioning.
INFLATION EXPECTATIONS
Markets trade based on where they expect inflation to be in the future, not current readings. Rising inflation expectations means central banks are likely to tighten policy, hence Bond yields rise and that may lead to currency strengthening initially.
Key metrics: CPI (Consumer Price Index), PCE, core vs. headline inflation, break-even inflation from TIPS spreads.
MONETARY POLICY CYCLES
Central banks are the most powerful players in financial markets. They control interest rates and balance sheet operations.
Tightening Cycle (hiking rates, quantitative tightening): Strengthens currency, negative for equities, bond prices fall, slows economic activity.
Easing Cycle (cutting rates, QE): Weakens currency, positive for equities, bond prices rise, stimulates economic activity.
GLOBAL GROWTH AND COMMODITY CYCLES
Strong global growth means higher demand for energy/metals = Commodity prices rise = Strengthens commodity currencies (AUD, CAD, NOK, BRL).
Key indicators to watch: Global PMIs, global trade data, commodity indices, China growth indicators.
TERMS OF TRADE
When a country's export prices rise more than its import prices, local income increases and currency typically strengthens. Example: Australia's AUD strengthens when iron ore and coal prices rise.
BALANCE OF PAYMENTS
Current account measures trade balance, income flows, and transfers.
Surplus (exports > imports): This accumulates foreign reserves, and generally supports currency.
Deficit (imports > exports): This requires capital inflows to fund deficit, and can pressure currency lower.
FISCAL POLICY AND DEBT DYNAMICS
Government spending and taxation are another dynamic that can influence economic growth and inflation.
Expansionary Policy: Higher spending or lower taxes = short-term growth boost = can increase inflation = increases deficit.
Contractionary Policy: Lower spending or higher taxes (this is know as “austerity”) = slows growth =reduces inflation = improves budget balance.
YIELD CURVE
One of the most important dynamics: it plots interest rates of government bonds across different maturities (2-year, 10-year, 30-year).
Normal/Steep Curve: Growth and inflation optimism, typically supports risk-on sentiment.
Flat Curve: Uncertainty about future growth, usually in late-cycle economies.
Inverted Curve (short rates > long rates): Recession warning. markets expect the central bank to cut rates due to the slowing economy. The inverted curve has preceded almost every U.S. recession in the past half decade.
LIQUIDITY CONDITIONS
Liquidity means availability of credit in the financial system.
High Liquidity: Credit is easy and cheap, supports asset prices, enhances risk appetite. Sources of ample liquidity are central bank QE, low interest rates.
Tight liquidity: Credit becomes scarce and expensive, forces deleveraging, triggers risk-off sentiment. Reasons that can lead to low liquidity are central bank QT, rising rates, banking stress.
BEHAVIORAL & POSITIONING DYNAMICS
When too many investors are positioned the same way (crowded trade), small sentiment changes can trigger strong reversals. Extreme bullishness can signal sell opportunities when everyone is fully invested. Extreme bearishness can signal buy opportunities when selling pressure is exhausted.
Key indicators to measure market positioning are: CFTC positioning data, VIX (volatility index), put/call ratios, fund flow data.
REAL YIELDS
Real Yield = Nominal Yield - Expected Inflation
Rising Real Yields: Stronger currency (attracts foreign capital), weaker gold (higher opportunity cost), pressure on growth stocks.
Falling Real Yields: Weaker currency, stronger gold, support for growth/tech equities.
Real yields drive cross-asset flows through opportunity cost (risk-free alternative return), discount rate changes (affects stock valuations), and dollar funding (global capital flows).
BOTTOM-LINE AND DYNAMICS INTERACTIONS
Markets are driven by multiple forces simultaneously. The strongest moves occur when multiple dynamics align in the same direction. Identify the dominant theme (inflation? growth? central bank policy?), understand asset class implications, look for alignment, and monitor for shifts.
Example Scenario - Fed Aggressive Tightening: Fed raises rates and begins QT → U.S. yields rise → Rising real yields → Tighter liquidity → Risk-off sentiment → USD strengthens, AUD/NZD/EM weaken, gold falls, growth stocks underperform.
Success comes from identifying the dominant market theme, understanding implications across asset classes, looking for alignment when multiple dynamics point in the same direction, and monitoring for theme shifts that can reverse the entire market structure quickly.
If you have questions or need any explanation don't hesitate to drop a comment.
After the gold shock, there may be a chance to break below 4000
News:
Last Friday, the US released CPI data. The reported decline in the figure supports the Fed's interest rate cut, which is bullish for gold, pushing it as high as 4135. However, the overall gain was not particularly strong, with continued volatility due to the limited rebound in the data, closing around 4114.
Next week will be the Fed's interest rate decision. Next week is the Federal Reserve’s interest rate decision. A rate cut is a foregone conclusion, and the extent of the positive impact is already limited. The increase before and after the data is released is estimated to be small. Therefore, after the volatility, I am optimistic that the gold price will weaken and fall next week, and it may break below the 4,000 mark. The idea is to rebound and short.
Specifically:
After the double top of gold in 4 hours, gold still fluctuated back and forth under the pressure of the neckline of the double top in 4 hours. Although the CPI was bullish for gold on Friday, it did not allow the gold bulls to break through 4160. This shows that the gold bulls are still under pressure in the short term, and gold will continue to fluctuate in a large range. If gold cannot break through 4160 at the beginning of next week, it will still be bearish, and we will continue to pay attention to the support around 4000.
If gold is stimulated by safe-haven news next weekend or directly breaks through 4160, then gold bulls may start to fight back and continue to go long at that time.
Trading strategy:
Buy: 4135-4125, SL: 4145, TP: 4105-4080

Today's gold trading strategyPolicy Shift Foundation: Transition from "Passive Defense" to "Proactive Easing"
1.Reinterpretation of the Nature of Rate Cuts: Defining this rate cut as a "defensive operation", its essence is Powell's rhetoric strategy to balance the hawkish and dovish differences. The U.S. non-farm payrolls increased by only 120,000 and 105,000 in August and September respectively, continuously below the "employment stability threshold" of 150,000. The unemployment rate has risen from 3.8% to 4.2%, and the inflection point of the employment market is clear. Under such circumstances, this rate cut is by no means a "one-off hedge", but rather a confirmation of the downward pressure on the economy. Historical data shows that after the first "defensive rate cut", the probability of subsequent rate cuts by the Federal Reserve within three months is 82%, and the average increase in gold is over 6%.
2.Substantial Weakening of Inflation Constraints: Although Powell mentioned inflation risks, the core PCE has been below 3% for three consecutive months, and was recorded at 2.7% in September, just one step away from the 2% target. More importantly, the year-on-year service inflation has dropped from 4.5% to 3.8%, indicating that inflation stickiness is dissipating. This opens up space for subsequent easing - when the dual goals of inflation and employment form a "loose resonance", the interest rate sensitive rise in gold will be triggered.
Today's gold trading strategy
buy:3910-3920
tp:3940-3950
sl:3895

Gold Elliott Wave Analysis – Potential Wave (4) Completion ZoneGold (XAU/USD) on the daily chart appears to be completing a classic Elliott Wave 5-wave impulse structure. After a strong rally into the wave (3) high, price is currently retracing toward the projected wave (4) correction zone.
The highlighted support area aligns with key Fibonacci retracement levels:
0.5 retracement: around $3,845
0.618 retracement: around $3,718
This region also coincides with the lower boundary of the ascending channel, adding confluence for potential bullish reversal.
If wave (4) finds support within this zone and maintains structure, a new impulsive rally toward wave (5) could begin — targeting the upper trendline resistance near $4,500–$4,600.

Will gold fall below 3900 again on October 29?
Current Market Characterization: Volatile with a bearish bias. Gold prices have broken below the key psychological level of $4,000, indicating short-term technical weakness. The market is currently caught between long-term bullish fundamentals and short-term factors such as easing geopolitical risks and improved risk appetite. Ahead of the Federal Reserve's interest rate meeting, volatile and range-bound trading is likely to persist.
I. Core Market Logic
Short-Term Bearish Factors:
Technical Selling Pressure: Last week’s significant sell-off has led to further weakness in technical indicators.
Improved Risk Appetite: Signs of easing geopolitical tensions (e.g., trade negotiations) have reduced gold’s appeal as a safe-haven asset.
Break of Key Support: The loss of the $4,000 level (coinciding with the long-term uptrend line) has intensified bearish sentiment.
Medium- to Long-Term Supporting Factors:
Fed Rate Cut Expectations: The market has almost fully priced in a 25-basis-point rate cut in October, with another cut expected in December. This limits the downside for gold prices in the long run.
II. Key Price Levels
Bullish Defense Line: $4,020
If gold fails to reclaim and stabilize above this level, the short-term bearish trend is likely to continue.
Core Resistance Zone: $3,970 - $3,990
This area, formed by the 5-day and 10-day moving averages, serves as a strong short-term resistance zone and an ideal entry point for short positions.
Support Zone: $3,880 - $3,890
This is the current near-term key support band. If gold stabilizes here, a technical rebound may occur.
Breakdown Target:
If the $3,880 - $3,890 support band is decisively broken, bears will likely test lower support levels.
III. Intraday Trading Strategy
Primary Approach: Prefer selling on rallies, with light long positions at key support levels as a secondary strategy.
Short Strategy (Primary):
Entry Timing: Wait for gold to rebound to the $3,970 - $3,990 resistance zone and show signs of rejection before entering short positions.
Profit Target: Initial target at the $3,900 - $3,910 support band. Secondary target at $3,870 - $3,880.
Stop Loss: Place above $4,000.
Long Strategy (Secondary):
Entry Timing: If gold retraces to the $3,880 - $3,890 support band and shows signs of stabilization or reversal on shorter timeframes (e.g., 1-hour/4-hour charts), consider entering light long positions.
Profit Target: Aim for $3,950 - $3,970.
Stop Loss: Place below $3,870.
IV. Trading Discipline and Risk Warnings
Follow the Trend: As long as the price remains below $4,020, the overall strategy should favor selling on rallies rather than attempting to buy the dip against the trend.
Exercise Patience: Only execute trades when prices approach key resistance or support levels. Avoid impulsive trading in intermediate ranges and refrain from chasing the market.
Strict Risk Management: Market sensitivity is heightened ahead of the Fed meeting. Always adhere to stop-loss orders to mitigate risks from unexpected fluctuations.

GOLD (XAU/USD): Important Bearish Breakout📉GOLD has a high potential to continue falling
after a breakout of a key daily/intraday horizontal support.
Next supports: 3900

CONFIRMATION CANDLE If this current h2 candle in the circle closes bearish or very small bullish by 2pm UTC then close all your buys because it will sell more but if it closes big bullish then you will have to close your sells rather.
