Gold 30-Min — Volume Buy Reversal Triggered⚡Base : Hanzo Trading Alpha Algorithm
The algorithm calculates volatility displacement vs liquidity recovery, identifying where probability meets imbalance.
It trades only where precision, volume, and manipulation intersect —only logic.
Technical Reasons
/ Direction — LONG / Reversal 4147 Area
☄️Bullish momentum confirmed through strong candle body.
☄️Structure shifted with higher-low near key demand base.
☄️Volume expanding confirms order-flow alignment upward.
☄️Buyers reclaimed imbalance with sustained clean break.
☄️Algorithm detects rising momentum under low liquidity.
⚙️ Hanzo Alpha Trading Protocol
The Alpha Candle defines the day’s real control zone — the first battle of momentum.
From this origin, the Volume Window reveals where the next precision strike begins.
⚙️ Hanzo Volume Window / Map
Window tracked from 10:30 — mapping true market behavior.
POC alignment exposes institutional bias and breakout potential zones.
⚙️ Hanzo Delta Window / Pulse
Delta window monitors real buying vs. selling power behind each move.
Tracks volume aggression to expose who controls the candle — buyers or sellers.
When Delta aligns with Volume Map, momentum becomes undeniable.
Trade ideas
Gold UpdateIndex and commodity futures are missing hours of data from last night for some reason. I noticed gold futures weren't updating which is one of the reasons why I posted gold spot price instead.
Still looks bullish in terms of chart pattern, but indicators hit overbought on both RSI and MFI. I closed out this morning on the pop, made some money off my FOMO trade, lol. Probably should have gone with silver instead, that would be true FOMO.
I guess it's just not my style to hold options for an extended time or to chase and overbought condition hoping for a melt up. It's just not the way I trade. I'll just wait for the next buy signal.
Note: I was right about MFI heading up, though I admit it was a FOMO trade.

Gold UpdateNot sure what's up with the futures chart but GLD trades on spot price, and the breakout is a lot more clear on spot price.
RSI did hit overbought, but melt up is possible since MFI is not overbought.

GOLD → Distribution phase. Focus on 4150...FX:XAUUSD is trading at a one-and-a-half-week high, supported by a weaker dollar and growing expectations of Fed policy easing. More news ahead...
US PPI inflation showed signs of slowing (2.7% y/y). Retail sales and consumer confidence were weaker than expected. The probability of a Fed rate cut in December rose to 85%. Fed members (Williams, Waller, Miran) supported the possibility of easing
However, progress in Russia-Ukraine negotiations is limiting growth
Today, attention is focused on data on jobless claims and durable goods orders
The combination of soft monetary policy, geopolitical risks, and structural demand from the Central Bank creates a favorable backdrop.
Resistance levels: 4156, 4211
Support levels: 4146, 4111
Gold continues to recover after breaking out of consolidation and holding above 4110. Focus on the next trading range (consolidation) of 4156 - 4111. If the bulls keep the price above 4146 - 4156, the next target could be 4211 - 4245.
Best regards, R. Linda!

XAUUSD (Gold) Expected Bullish Bounce from Demand ZonePrice has dropped into a Demand Zone (purple area), where buyers are expected to be strong.
The chart marks a Break of Structure (BOS) and Equal Highs (EQH) above, which means there is liquidity sitting on the highs.
There is a Weak High above that price may try to take out.
The arrow shows a projected bullish move from the Demand Zone up toward the Target Level.
Simple idea
The chart suggests that gold (XAUUSD) might:
1. Bounce from the Demand Zone,
2. Move upward,
3. Take liquidity above Equal Highs,
4. Reach the target zone marked on the chart.
Basically: Buyers expected from the demand zone → price may push up to break previous highs.
❤️ please support with Boost and Comment I will be Glad ❤️

Will gold prices fall after a surgeWhat will become ofthe marketGold Technical Analysis: Today, the gold market was paralyzed due to a data malfunction on the CME Group, leading to the closure of all gold trading. Due to the Thanksgiving holiday, trading was relatively quiet, and overall price fluctuations were not significant. However, the overall trend remains bullish. Looking at the intraday price action, fundamental uncertainties exacerbated market sentiment volatility, but the overall trading range remained within the expected range of 4220-4155. This indicates that with the US market closed today, market sentiment remains cautious, not blindly following sudden fundamental developments or completely deviating from technical expectations. However, this also reflects the current market's lack of direction and the risk of sudden price movements due to other factors.
Gold is still trading within an upward channel on the hourly chart. A pullback to the lower channel support suggests a continued bullish trend. During the US session, gold is expected to fall back to 4160, presenting an opportunity to buy on dips. The hourly chart also shows gold at the upper edge of a range-bound pattern, potentially forming a support/resistance level. Support lies around 4160, the starting point of the morning's rise, which could become a key level for determining future direction. Key resistance is around 4220; a break above this level could lead to a challenge of the previous high near 4245. The recent upward movement after the open may be due to pent-up energy from the past two days of consolidation. Currently, the market trend leans towards an upward consolidation, so our trading strategy should focus on the bullish direction.In summary, the recommended trading strategy for gold is to primarily buy on dips and secondarily sell on rallies. The key resistance level to watch in the short term is 4240-4250, while the key support level is 4170-4160. Please stay tuned for further updates.

Elise | XAUUSD 2H — Liquidity Sweep + Retest SetupOANDA:XAUUSD
After sweeping liquidity at every breakout stage, XAUUSD formed clear consolidation boxes acting as accumulation zones. Each breakout has been followed by a retest, confirming continuation. The current move has broken above liquidity pivot zone highs, and price is now expected to retest the level at 4165–4175 before continuation toward major liquidity above.
Key Scenarios
🚀 Bullish Case (Primary Bias)
If price retests and holds 4165–4175 zone:
🎯 Target 1: 4235–4250
🎯 Target 2 (Final): 4310–4350 liquidity zone
Expect sweep of equal highs followed by continuation.
📉 Bearish Case (Invalidation)
Break and close below 4110–4125 zone would weaken bullish structure and potentially send price back toward the lower range zone.
Current Levels to Watch
Retest Buy Zone: 4165–4175
Support Range: 4110–4125
Liquidity Targets: 4235 → 4310+
⚠️ Disclaimer: This analysis is for educational purposes only. Not financial advice.

THE KOG REPORT - UpdateEnd of day update from us here at KOG:
Slow day but nothing has changed. Earlier, we wanted a pull back into the 4130's which we did get, not on point, but the red boxes confirmed the move upside and we managed to get in level to level on our way to the level we want above.
For now, we'll stick with it and look at the two hotspots as areas of interest for the sessions ahead. Support stands around the hot spot 4150 while resistance is just below at 4170. Ideally, we would like to see this encounter a RIP from one of these resistance levels, lets see what tomorrow brings!
As always, trade safe.
KOG

XAU/USD Daily Outlook
Yesterday’s daily candle formation provides valuable context for today’s plan. The recent sequence suggests profit-taking after a strong bullish run, while expectations of a possible interest rate cut (that market already anticipated) have contributed to a limited buying sequence. This aligns with the broader market sentiment of caution ahead of key U.S. economic data.
The previous day’s rejection candle with a long lower wick is particularly important, it signals reinforced indecision and lack of strong bearish follow-through. This price behavior gives me more confidence in long positions, provided the technical conditions align.
Price is currently consolidating inside the ascending channel on H4. I'll wait for NY session confirmation and break above 4,200 and enter above Donchian Channel middle line.
This fundamental backdrop, combined with the technical structure, suggests that the market is in a wait-and-see mode until NY session volatility kicks in.
Today’s Initial Jobless Claims will be the key driver

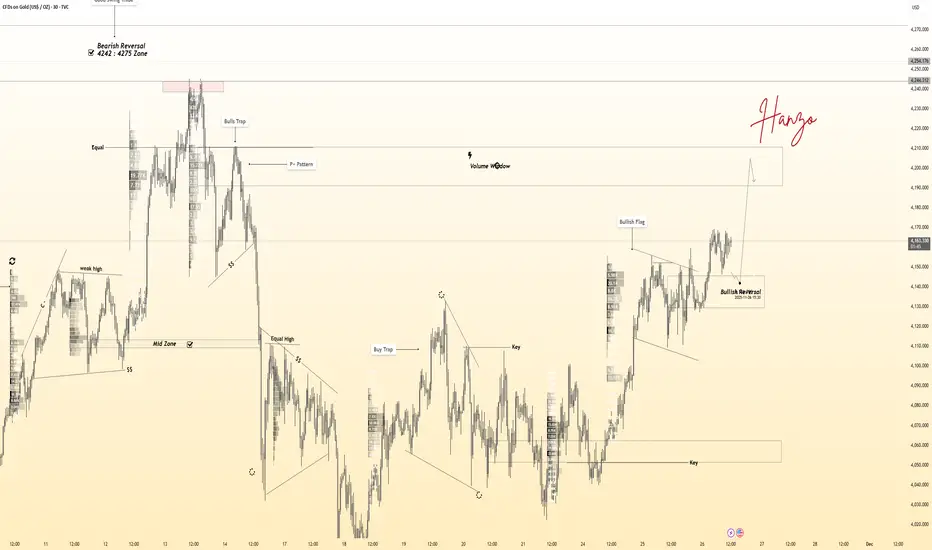
Gold 30-Min — Volume Sell Reversal Triggered⚡Base : Hanzo Trading Alpha Algorithm
The algorithm calculates volatility displacement vs liquidity recovery, identifying where probability meets imbalance.
It trades only where precision, volume, and manipulation intersect —only logic.
✈️ Technical Reasons
/ Direction — SHORT / Reversal 4215 Area
☄️Bearish rejection confirmed through sharp candle body.
☄️Lower-high forming beneath resistance supply region.
☄️Volume decreasing confirms exhaustion in price rally.
☄️Sellers regained imbalance with heavy top rejection.
☄️Algorithm detects fading demand and shift to control.
⚙️ Hanzo Alpha Trading Protocol
The Alpha Candle defines the day’s real control zone — the first battle of momentum.
From this origin, the Volume Window reveals where the next precision strike begins.
⚙️ Hanzo Volume Window / Map
Window tracked from 10:30 — mapping true market behavior.
POC alignment exposes institutional bias and breakout potential zones.
⚙️ Hanzo Delta Window / Pulse
Delta window monitors real buying vs. selling power behind each move.
Tracks volume aggression to expose who controls the candle — buyers or sellers.
When Delta aligns with Volume Map, momentum becomes undeniable.

Buy Zone Respected, Bull Trend AliveAfter breaking out on Friday during a low-liquidity environment and tapping the 4250 resistance zone on Monday, gold did exactly what strong markets do — it corrected.
The pullback reached the ideal buy zone at 4160–4170, respected it perfectly, and the market reversed sharply from there.
Now, price is trading comfortably above 4200, holding around 4220, and the structure remains firmly bullish.
From here, I expect:
- A new bullish leg,
- Followed by a clean break above the 4250 zone.
If that breakout materializes, the next major target for buyers becomes a retest of the ATH at 4380.
I remain bullish as long as yesterday’s low holds, and in my view, buying dips continues to be the dominant play in this market.

Gold Market Outlook: Rising Momentum Toward ResistanceOverall Market Structure
The gold price (XAUUSD) is moving inside a wide horizontal range:
Resistance zone: around 4,250 – 4,280
Support zone: around 4,160 – 4,120
Price is currently near 4,203, sitting in the middle of the range.
---
✅ Key Features on the Chart
1. Descending trendline break
You can see a downward diagonal trendline that has been broken earlier.
This normally signals that selling pressure has weakened.
2. Ichimoku Cloud
Price is hovering around the cloud:
When price is inside the cloud → market is uncertain
When price pushes above the cloud → bullish momentum increases
Right now it seems price is trying to climb above the cloud.
3. Arrows showing a potential upward move
The chart marks two upside targets:
Target 1: ~4,229
Target 2: ~4,250
These align with:
Minor resistance
Major resistance (range top)
---
✅ What the Price Needs for an Up-Move
For gold to move higher:
1. Hold above 4,200–4,205 support
2. Break above 4,220–4,230
3. Momentum toward 4,250 becomes more likely
---
✅ What Could Signal Weakness
If price drops:
Below 4,200, sellers gain control again
A fall back to 4,160 becomes possible (bottom of the big range)
---
⭐ Summary
The chart suggests possible bullish momentum forming.
But major resistance sits near 4,250–4,280, which has rejected price before.
The market is still range-bound, not in a strong trend.

GOLD 1H CHART ROUTE MAP UPDATE & TRADING PLAN FOR THE WEEKHey Everyone,
Please see our updated 1h chart levels and targets for the coming week.
We are seeing price play between two weighted levels with a gap above at 4100 and a gap below at 4057. We will need to see ema5 cross and lock on either weighted level to determine the next range.
We will see levels tested side by side until one of the weighted levels break and lock to confirm direction for the next range.
We will keep the above in mind when taking buys from dips. Our updated levels and weighted levels will allow us to track the movement down and then catch bounces up.
We will continue to buy dips using our support levels taking 20 to 40 pips. As stated before each of our level structures give 20 to 40 pip bounces, which is enough for a nice entry and exit. If you back test the levels we shared every week for the past 24 months, you can see how effectively they were used to trade with or against short/mid term swings and trends.
The swing range give bigger bounces then our weighted levels that's the difference between weighted levels and swing ranges.
BULLISH TARGET
4100
EMA5 CROSS AND LOCK ABOVE 4100 WILL OPEN THE FOLLOWING BULLISH TARGETS
4140
EMA5 CROSS AND LOCK ABOVE 4140 WILL OPEN THE FOLLOWING BULLISH TARGET
4193
EMA5 CROSS AND LOCK ABOVE 4193 WILL OPEN THE FOLLOWING BULLISH TARGET
4233
EMA5 CROSS AND LOCK ABOVE 4233 WILL OPEN THE FOLLOWING BULLISH TARGET
4275
BEARISH TARGETS
4057
EMA5 CROSS AND LOCK BELOW 4057 WILL OPEN THE FOLLOWING BEARISH TARGET
4016
EMA5 CROSS AND LOCK BELOW 4016 WILL OPEN THE FOLLOWING BEARISH TARGET
3965
EMA5 CROSS AND LOCK BELOW 3965 WILL OPEN THE SWING RANGE
3923
3861
As always, we will keep you all updated with regular updates throughout the week and how we manage the active ideas and setups. Thank you all for your likes, comments and follows, we really appreciate it!
Mr Gold
GoldViewFX

XAU/USD Bullish Setup Developing Toward 4226 and 4257The XAUUSD chart shows price stabilizing after a corrective move within the descending channel, with buyers defending the highlighted support zone. Candles are attempting to build momentum above the Ichimoku cloud, indicating early signs of a potential bullish shift. The structure suggests that if price maintains support near the 4200–4205 region, upside continuation becomes likely. A break and hold above the minor consolidation area could open the way for a progressive move toward the first target at 4226. Sustained strength above this level may attract further buying interest, driving price toward the second target at 4255. Overall, the market is showing signs of recovery as long as support remains intact.
If you found this XAUUSD analysis helpful, don’t forget to LIKE 👍 and COMMENT 💬!

XAUUSD – LANA WATCH SELL 4190–4194 AND BUY 4100–4102 ON 04/12 XAUUSD – LANA WATCH SELL 4190–4194 AND BUY 4100–4102 ON 04/12
1. Fundamental Analysis
The current context revolves around concerns of a global economic growth slowdown. In a recession cycle, yields in the US and Europe tend to drop faster than in Japan due to more "room" to cut interest rates.
This leads to:
Narrowing yield spreads, USD/JPY carry trade transactions being reversed.
Increased risk aversion, with capital flows tending to return to JPY and defensive assets like gold.
If the risk-off wave is strong, USD/JPY may not decline gradually but could experience quite rapid drops. In such an environment, currency market volatility can easily lead to strong fluctuations in gold, creating trading opportunities in more attractive liquidity zones instead of chasing prices.
2. Technical Analysis
On the H1 chart, gold is compressed between:
Descending trendline above: connecting from the peak area 4,245–4,260, selling pressure remains present whenever the price touches this trendline.
Ascending trendline below: extending from the bottom of last month, acting as support for the medium-term trend.
Some key areas on the chart:
Timing zone 4190–4194: close to the descending trendline, coinciding with the previous Volume cluster, is the area Lana prioritizes for short-term Sell watch.
Buy POC – VAL Volume Profile zone below: a price area where the market previously traded heavily, buying force may return when the price adjusts deeply.
Buy Liquidity zone 4100–4102 lies right above the large ascending trendline: this is a beautiful liquidity area to seek Buy opportunities in line with the longer trend if the market shakes off strongly.
In summary, Lana leans towards the scenario:
The price may rebound to test 4190–4194 then weaken.
If it drops deeply to 4100–4102 and holds the ascending trendline, this will be the area to consider buying back up.
3. Price Areas to Watch
Resistance / Sell watch zone: 4190 – 4194
Invalidation zone for Sell setup (wide SL): 4219 – 4231
Support / Buy watch zone: 4100 – 4102
SL levels for Buy setup: 4081 – 4063 – 4045 (depending on individual risk tolerance)
4. Trading Scenarios
⭐️ Short-term Sell scenario
Sell entry: 4190 – 4194
SL: 4219 – 4231
TP: 4181 – 4155
⭐️ Deep Buy scenario following the trend
Buy entry: 4100 – 4102
SL: 4081 – 4063 – 4045

Elite | XAUUSD 15m – Bullish Continuation SetupOANDA:XAUUSD
After sweeping liquidity beneath major support, the market broke downward structure and initiated a bullish correction phase. The breakout above internal range highs and the descending trendline confirms a bullish shift, supported by strong demand rejections. Price is now trading above reclaimed structure and targeting the upper liquidity zone toward $4,256 – $4,260.
Key Scenarios
✅ Bullish Case 🚀
Hold above the re-test demand zone:
🎯 Target 1: $4,230
🎯 Target 2: $4,256 – $4,260 (final liquidity objective)
❌ Bearish Case 📉
Only active if price breaks and closes below $4,210
🎯 Downside Target: $4,170 (previous accumulation level)
Current Levels to Watch
Resistance 🔴: $4,230 / $4,260
Support 🟢: $4,218 / $4,170 / $4,150
⚠️ Disclaimer: This analysis is for educational purposes only. It is not financial advice.

Gold Moves Sideways Ahead of the FED DecisionGold continues to trade within an extremely tight range, even as the USD Index (DXY) stabilises around 99–100. This signals that pressure from the dollar is no longer as dominant as before, while safe-haven flows quietly circulate beneath the surface—especially as global equities soften and sentiment grows cautious ahead of the FED’s rate announcement this month. Everything now hinges on a single question: will the FED deliver its third rate cut of the year? If so, the USD is likely to weaken, and gold could benefit directly and even aggressively from the shift.
On the 1H timeframe, gold remains sideways between 4,210–4,220 after retracing from 4,245–4,260. Notably, recent selling appears to come primarily from short-term profit-taking rather than genuine reversal pressure. The lower FVG zones at 4,185–4,195 and 4,160–4,170 continue to act as liquidity pockets where price may dip to gather momentum before following the prevailing trend. These areas have provided precise reactions in previous sessions and could again serve as springboards should gold pull back deeper.
If gold holds 4,210 and shows a strong bullish response, a retest of 4,245 becomes highly likely, with a potential breakout above 4,260 toward the broader target near 4,285—the key high from November. Conversely, a clean break below 4,210 opens the path for price to drift naturally into the 4,185–4,195 FVG before buyers step in. In the broader structure, the short-term uptrend remains intact; current pullbacks are functioning as liquidity sweeps rather than structural breaks.
With all of this in mind, my bias stays bullish. The 4,185–4,195 region is where I prefer looking for trend-aligned entries instead of chasing price near the 4,245–4,260 resistance, where sellers repeatedly wait. Should the FED deliver the dovish signal the market expects, gold could easily extend its upward trajectory in the sessions ahead.

Gold Pushes Higher as Buyers Dominate Above 4,180Hello everyone,
Gold is extending its momentum after a clean breakout through the 4,180 barrier, climbing to 4,189 USD with strong follow-through. The advance is supported by consecutive bullish FVG structures underneath the price, signaling that buyers are not only active but also willing to drive the market higher. Previous volume congestion zones have been absorbed entirely, reinforcing the idea that the bullish side is firmly in control.
In the short term, 4,180 has flipped into fresh support. If momentum persists, the next natural target sits at the psychological 4,200 level—an area that often fuels additional liquidity inflows. Should gold retrace, the 4,110–4,140 zone stands out as a well-tested support cluster and a potential area to accumulate in line with the broader bullish trend.
Macro conditions continue to favor precious metals. The USD is softening on expectations of a December 2025 rate cut, and this sentiment remains a major catalyst behind gold’s advance. Meanwhile, consistent central-bank buying and steady ETF inflows, noted by Morgan Stanley, help sustain longer-term demand. With these foundations, projections toward 4,500 USD in mid-2026 appear increasingly reasonable.
Short-term volatility may still occur if key economic releases shift interest-rate expectations. A rebound in the USD or a sudden change in Fed tone could trigger deeper pullbacks before the uptrend resumes.
Overall, gold maintains a strong bullish structure backed by both technical and macro drivers. Watching support levels closely could offer valuable opportunities during dips.
What do you think—will this momentum continue?

Breaking 4,200 USD: A New Bullish Cycle Emerging?Hello everyone,
Gold continues to maintain a robust upward structure, with higher highs and higher lows. The recent break above the 4,200 USD level further confirms the bullish trend, indicating that buyers are still firmly controlling the market rhythm. Notably, a series of FVGs (Fair Value Gaps) appear consistently below, showing that proactive buying is absorbing most corrective moves.
1. Technical perspective: Uptrend remains dominant
Gold formed a higher low around 4,120 – 4,140 and broke through the 4,200 barrier, which had held for nearly 10 days. FVGs at 4,165, 4,120 – 4,135, and 4,080 – 4,100 serve as potential retracement zones where the market may revisit to regain bullish momentum. Volume Profile also shows heavy activity around 4,150 – 4,170, suggesting a pause before the next leg upward.
2. Forecast for gold’s next move
The bullish structure remains clear. Therefore, a mild pullback before further ascent is the dominant scenario. From the 4,215 zone, gold may retreat to 4,180 – 4,165 to form a base, then rally towards 4,240 – 4,260. If buying remains strong, further targets could reach 4,300 – 4,320.
An immediate surge is also possible, particularly if the USD weakens or macro news supports it. In such a case, gold could push directly to 4,240 – 4,250, though this type of rally is usually prone to quick profit-taking.
3. News perspective: The market supporting gold
At the US close, gold eased slightly to 4,159 USD/oz—a healthy cooling after a strong rally. Meanwhile, Morgan Stanley continues to target 4,500 USD in 2026, supported by the strongest ETF inflows since 2020, net purchases from central banks, and expectations of lower interest rates—all reinforcing the long-term uptrend.
However, short-term risks remain, such as rising real rates or a USD rebound. These could create pressure, but overall, the trend still favours buyers.

XAUUSD 1H — Bullish Structure Holding | Retest Setup ActiveGold has moved out of a range market and built momentum toward premium pricing. After a liquidity grab and correction, the market is now retesting the breakout structure. If the retest holds, this will likely serve as the continuation point toward the next liquidity target at 4378.
Key Scenarios
✅ Bullish Case 🚀
If price retests 4156–4175 and holds with bullish reaction:
🎯 Target 1: 4255
🎯 Target 2: 4378 (major liquidity sweep)
❌ Bearish Case 📉
A sustained break and close below 4107 may shift momentum and open deeper corrective downside.
Current Levels to Watch
Support / Retest Zone: 4156–4175
Secondary Support: 4107
Liquidity Target: 4378
⚠️ Disclaimer: This analysis is for educational purposes only. Not financial advice OANDA:XAUUSD OANDA:XAUUSD

XAUUSD: Inverse H&S Points Toward 4270 TargetHi!
Gold has formed a clear Inverse Head & Shoulders structure, signaling a potential bullish reversal. The support zone around the head held strongly, forming the left shoulder, head, and right shoulder in sequence. Price has now broken above the neckline, confirming the pattern and showing renewed bullish momentum.
If price retests the neckline successfully, it can provide a higher-probability long entry. A sustained hold above this level keeps the bullish structure intact, with the measured target projected near 4265–4270 USD.
However, if price dips deeper, the right scenario remains a potential bullish retest, as long as the structure stays above the neckline zone. Only a drop back below the head invalidates the pattern.
Overall, as long as buyers defend the neckline, the market maintains a bullish outlook toward the target zone.
Disclaimer: As part of ThinkMarkets’ Influencer Program, I am sponsored to share and publish their charts in my analysis.

Gold next move (mild correction is on the cards)(01-12-2025)Go through the analysis carefully and do trade accordingly.
Anup 'BIAS for the day (01-12-2025)
Current price- 4245
"if Price stays below 4263, then next target is 4230, 4216 and 4190 and 4170 and above that 4280, 4300 ".
-POSSIBILITY-1
Wait (as geopolitical situation are worsening )
-POSSIBILITY-2
Wait (as geopolitical situation are worsening)
Best of luck
Never risk more than 1% of principal to follow any position.
Support us by liking and sharing the post.

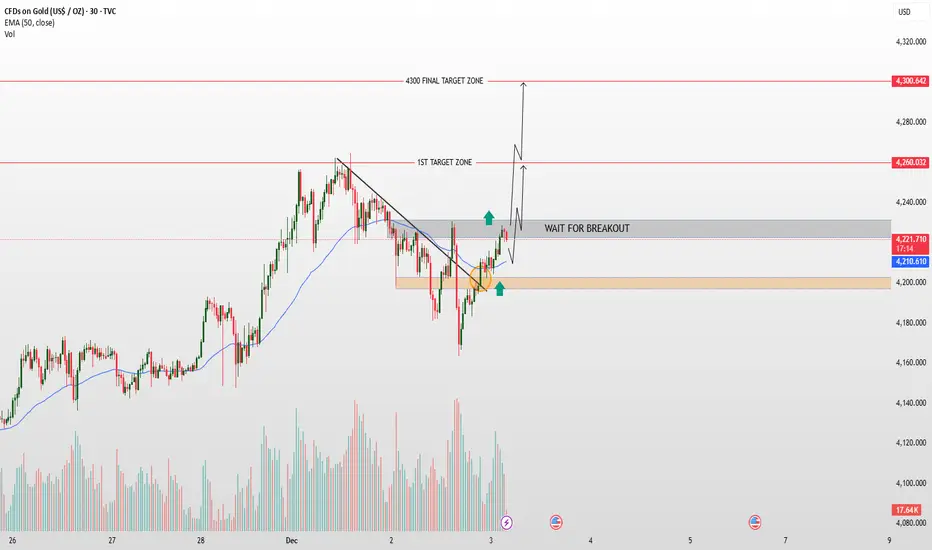
Gold Breakout Alert! Major Move Incoming!Technical Analysis – Gold (30-min Chart)
Price is currently trading just above the broken descending trendline, indicating early signs of bullish momentum. The recent retest of the breakout zone (highlighted area) has held as support, suggesting buyers are defending this level. Price is now approaching the 4,223–4,240 resistance zone, where a clear breakout and confirmation would strengthen bullish continuation toward the 1st target zone around 4,260.
A sustained move above 4,260 may open the path toward the final target at 4,300. However, failure to break the immediate resistance could lead to another retest of the support zone near 4,200.
Bias remains bullish, but confirmation through a clean breakout is key for further upside.