Gold Quick Profit StrategyRecently, we have primarily focused on ultra-short-term trading for quick profits. Ultra-short-term trading involves identifying actionable opportunities within a very small price range, quickly entering the market, taking profits, and then immediately closing the position to wait for the next opportunity.
Gold's performance this week has been quite noticeable. For the past four days, there hasn't been much change, with prices consolidating at low levels. Neither bulls nor bears have shown sustained momentum. Gold has recently exhibited a typical consolidation pattern, with the trading range narrowing over time, forming a converging triangle technically. Currently, it's oscillating within the 3960-4020 range. The following are suggestions for very short-term trading:GOLD
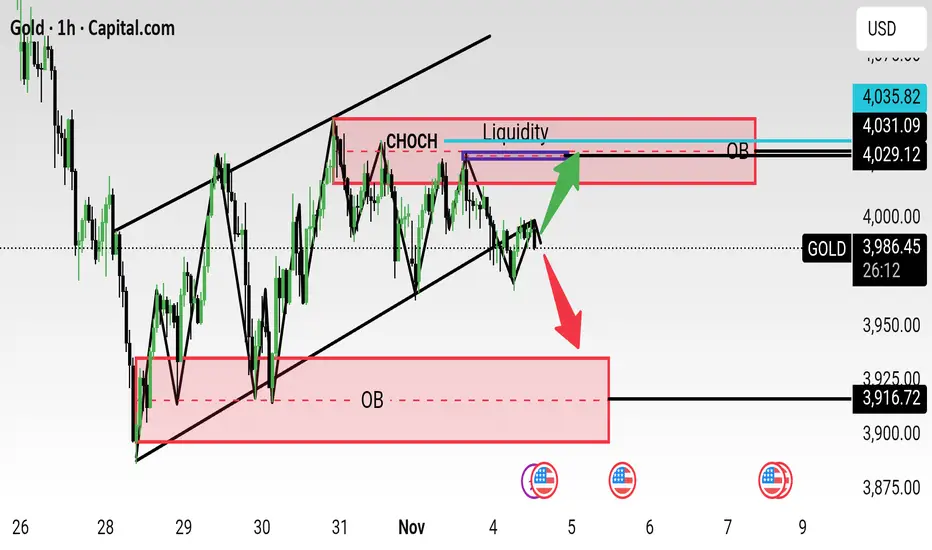
BUY
Entry: 3980/3985/
TP: 4000 / 4010 / 4020
SL: 3965
Gold
Sell
Entry Price: 4000/4010/4020
Take Profit Price: 3985 / 3980 / 3975
Stop Loss Price: 4030
Trade ideas

$XAU: Buyers are aggressive in this zone? TVC:XAU / TVC:GOLD Analysis 🪙
Daily TF: Still bullish.
4H TF: Showing an external bearish structure which is red flag however, right after bearish move on 4h internal structure shifted (CISD reversal) indicating that buyers are aggressive in this zone.
Based on this there’s a strong chance for an upside move from here.
Reasons:
1- New OB has formed on 4H timeframe.
2- Price has re-entered previous range, signaling strength.
3- Bearish trendline broke confirming a potential bullish shift.
4- Equal highs above are still intact showing liquidity pool on upper side.
Currently, price is trading right on the OB, making this a key reaction zone for a possible bullish move.

XAU/USD – Selling Opportunity Near Resistance ZoneGold is currently approaching a strong resistance level after an extended bullish move.

GOLD Very Near Perfect Place For See , 500 Pips Waiting !Here is My 30 Mins Gold Chart , and here is my opinion , we again Below 4050.00 With 4H Candle and the price come back to retest it ! and we have a 4H Candle closure below it And Perfect Breakout and this give us a very good confirmation , so we have a good confirmation now to can sell after the price go back to retest the broken area between 4050.00 : 4055.00 , and give us a good wicks as previous wicks ! and we can targeting 100 to 200 pips . if we have a daily closure above this area this mean this idea will not be valid anymore .
Reasons To Enter :
1- Perfect Touch For The Area .
2- Clear Bearish Price Action .
3- Bigger T.F Giving Good Bearish P.A .
4- Over Bought .
5- Perfect 30 Mins Closure .

XAUUSD: Daily OTE & CRT Setup - Targeting the DrawdownTimeframe: Daily (1D) Chart Analysis: Smart Money Concepts (SMC) / ICT
Gold (XAUUSD) is setting up a high-probability move as it consolidates beneath the recent Daily OTE High. The daily candle is painting a potential CRT Manipulation phase before a distribution down to clear liquidity.
The Setup: Targeting the CRT Drawdown
Current Range (CRT): Price is currently held within the range of the last major daily candle, suggesting Accumulation/Distribution is in progress.
OTE High Resistance: The overhead resistance at $3,991.82 (OTE High) is critical. A potential short-term sweep above this level (the Manipulation phase of CRT) could occur to grab liquidity before the main move.
The Liquidity Target: The projected path indicates a clear run to the Daily OTE Major Low at $3,929.78. This level is a major magnet for liquidity and represents an excellent area for the next Accumulation phase and a potential long entry.
🎯 Trade Plan:
Bearish Bias: Favor a move down toward the $3,929.78 zone.
High-Probability Entry: Wait for price to enter the lower OTE zone at $3,929.78 and look for a lower-timeframe Market Structure Shift (MSS) or bullish Displacement for a long entry confirmation.
The path of least resistance is lower to mitigate the recent Daily high and collect the sell-side liquidity.
Greetings,
MrYounity


( Gold Protocol ) Bearish After Break Detected Status: Active Reversal Protocol
Symbol: Gold
Session: London–New York Overlap (Smart Exit Window)
Confidence Level: ★★★★★ ( Hanzo Volume Detected )
☄️ Bearish After Break Out 4005
Reasons
1. Alpha Sequence Engaged
— Smart flow detected within Hanzo precision range.
2. Volume Window Synced
— Session energy aligns with internal volume pulse.
3. Liquidity Cycle Active
— Engineered sweep confirms smart money transition.
4. Time Lock Confirmed
— Market phase locked with directional intent.
5. Volume Map Aligned
— Cluster balance reveals real directional flow.
6. Hanzo Wick Detected
— Manipulation wick verified under Alpha filter.
⤵️Every like & comment on our TradingView posts helps us grow. More engagement means more exposure, which benefits everyone in the community!

Gold is Ready For Bull From SupportHello Traders
In This Chart GOLD HOURLY Forex Forecast By FOREX PLANET
today Gold analysis 👆
🟢This Chart includes_ (GOLD market update)
🟢What is The Next Opportunity on GOLD Market
🟢how to Enter to the Valid Entry With Assurance Profit
This CHART is For Trader's that Want to Improve Their Technical Analysis Skills and Their Trading By Understanding How To Analyze The Market Using Multiple Timeframes and Understanding The Bigger Picture on the Charts

Gold Trade Set Up Secured 450 pipsSet up played out perfectly, sweeping external BSL, tapping 15m supply to target lower SSL levels

XAU/USD: Possible up-move after the trapBulls may attempt to bring the price back into the blue ascending channel after the current drop. A rebound from the trap level could trigger a corrective move toward the upper boundary, testing the previous structure around Target 1. The key question — whether this recovery is just a pullback or the start of a renewed uptrend.

XAUUSD Breaks Out and Continues Its Bullish RallyOANDA:XAUUSD The market is still in a strong downtrend, yet the bearish momentum is gradually losing strength as a double bottom pattern begins to form, a classic signal that sellers are running out of steam.
After the second bottom took shape, buyers stepped in with growing confidence, and the price is now testing the neckline, confirming a structural shift toward a potential bullish reversal.
At this point, all eyes are fixed on the neckline. If a breakout above this level occurs, it will confirm the pattern and open the path for buyers to push the price higher toward 4,135.

Gold short term rallyGold is responding from institutional demand zone 🔴 but this move is for short term

Neutral Market Analysis — Key Zones in FocusPrice is currently consolidating within a key range, showing indecision between buyers and sellers.
The lower imbalance zone around 3960–3980 is acting as a strong support area, while the upper FVG near 4000 is serving as a short-term resistance.
If price manages to break and sustain above the FVG at 4000, it could open the path toward the Key Buy (KB) zone at 4016, signaling potential bullish continuation.
However, if the market faces rejection near 4000, price may retrace back toward the support zone at 3960, where previous demand remains active.
Key Levels:
FVG Resistance: 4000
KB Zone: 4016
Support: 3960
The market remains in a neutral phase; wait for a confirmed breakout or rejection before considering any position.
Today's gold trading strategy1.The technical breakout feature is highly significant, and the risk of a top divergence is imminent. The so-called "breakout trend" currently actually has fatal flaws: Although the London gold price has reached $3990.24, it has not stabilized above the 10-day moving average (4008 USD), and the 30-minute chart has formed a top divergence structure of "new price high + shortened MACD red bar", which is a typical trend reversal signal. More importantly, the increase in trading volume during the breakout has "water" - the highest daily increase was only 0.41%, while the trading volume has shrunk by 22% compared to the peak of the previous trading day, and although the active buy orders accounted for 61%, they were concentrated in the $3980 - $3985 USD range, and the buy volume above $3990 USD dropped sharply, confirming "insufficient willingness to buy at the high price". Historical data shows that when gold does not break through the key moving average, a top divergence occurs, and the probability of a 24-hour subsequent decline is 81%, with an average decline of over 1.2%.
2.Institutional funds have hidden differences, and the sustainability of ETF's increase in holdings is questionable. The "institutional increase in holdings" logic that is overly dependent on it has obvious flaws: The latest addition to SPDR gold ETF holdings data was on November 4th (increased by 2.58 tons), and there has been no new increase in holdings record since November 5th. Moreover, the main contract position of New York gold futures shows that the long position only increased slightly by 0.3%, while the short position increased by 1.8%, the ratio of long to short positions dropped from 1.2:1 to 1.17:1, and the institutional differences have already emerged. What is more alarming is that the gold sector index has been in a 3-day correction, with a single-day decline of 4.06% on November 4th, and the trading volume has also shrunk simultaneously, indicating that the precious metal funds in the stock market are accelerating their withdrawal, and this "cross-market capital flight" often precedes the decline in the spot market.
Today's gold trading strategy
sell:3985~3995
tp:3975~3965
sl:4005

Today's gold trading strategyKey turning point breakthrough confirmed, technical pattern opens up the main upward space
The London gold price has firmly held at the 4000 US dollar integer level today. The current price is 4009.86 US dollars, having rebounded by over 45 US dollars from the intraday low of 3964.42 US dollars, forming a strong structure of "breakthrough + retracement + further advance". Three technical signals confirm the trend
① After breaking through the upper edge of the previous oscillation platform (3990 US dollars), the trading volume has increased by 78% compared to the previous period, and the proportion of active buying orders has risen to 65%, indicating strong fund support
② The MACD indicator on the daily chart remains in a golden cross, the red bar continues to expand, and the price has stabilized above the 5-day, 10-day, and 20-day moving averages, forming a "bullish arrangement" pattern
③ From the Fibonacci extension levels, after breaking through 4000 US dollars, the next target is directly at 4050 US dollars (1.618 extension level). Historical data shows that after the gold breaks through a key integer level, the probability of continuing to rise within 24 hours is 89%
Today's gold trading strategy
buy:4000-4010
tp:4020-4030
sl:3990

Gold Market Analysis and Trading Strategy:Gold Market Analysis and Trading Strategy:
Technical Analysis: Gold is currently facing short-term pressure, and key price levels need to be monitored. Gold prices are currently in a consolidation phase.
Resistance Levels: $4030-$4050 and $4088 are key short-term resistance levels.
If gold prices fail to break through these resistance levels, the downside risk is significant.
Support Levels: Initial support is around $3960, with a more significant support zone in the $3800-$3700 area.
A break below these key support levels could trigger a deeper trend correction.
Trading Strategy: In the current volatile market, patience is advised. Avoid blindly chasing highs and lows.
Day Traders: Consider establishing a small short position near the $4030-$4050 resistance zone, with a stop-loss above $4070 and a target price of $3980-$3960.
Conversely, if gold prices fall back and stabilize around $3960-$3970, a small position can be established to profit from the rebound, but a strict stop-loss order must be set.
Current Trading Strategy:
Buy Price: $3970-$3980
Stop-Loss Price: $3950
Take-Profit Price: $4030-$4050-$4075

GOLDPreferably suitable for scalping and accurate as long as you watch carefully the price action with the drawn areas.
With your likes and comments, you give me enough energy to provide the best analysis on an ongoing basis.
And if you needed any analysis that was not on the page, you can ask me with a comment or a personal message.
Enjoy Trading ;)

XAUUSD is on Rangebound currently market is bullish biased and Rangebound from 3995-4040 -zone.
Although it's upside at 3998 was to quick.
What are my conditions For This setup?
- I'm waiting for buy from 3990-3980 area & expecting the reversal move towards 4028- 4047 target although currently I took bu6 from 3995-3990 area and holding till my Targets
- Second if H1-H4 candle closes above 4045 area I will straight Buy and target 4070-4090 .
✳️Secondly if H4-H1 candle closes below 3975-3970 our buying will be compromised

Gold Trade Set Up Nov 6 2025Price shifted structure to bullish during Asia and London on the 1h but on the 4h price is overbought and is sitting at a strong resistance so i would only buy if price can break and close above supply and most recent 15m swing high but if price stays closed below resistance and respects supply i will look to take sells back down to lower demand zones and SSL levels

XAUUSD XAU/USD – Gold Analysis
Gold is approaching the upper boundary of the descending channel after a strong bounce from the midline support earlier today.
As it nears this zone, price faces a confluence of resistance factors: the descending trendline, the 0.5 Fibonacci retracement, and the upper Bollinger Band.
From this area, I’ll be looking for a short setup, targeting a move back toward the midline of the channel to capture the liquidity left by today’s upward move.
Fundamental Outlook:
The U.S. dollar remains firm as investors continue to favor USD as a safe-haven amid ongoing geopolitical tensions and uncertainty around global growth.
The Federal Reserve’s cautious stance and limited expectations for rate cuts are supporting higher Treasury yields, which typically weigh on gold prices.
However, gold’s safe-haven demand could re-emerge if geopolitical risks intensify or U.S. economic data begins to soften.
For now, the short-term bias remains bearish, with gold under pressure from strong USD fundamentals and technical resistance zones above.
Summary:
📈 Testing major resistance (trendline + 0.5 Fibo + Bollinger top).
📉 Looking for short setups near 4024.
🎯 Target: Mid-channel around 3962.
⚙️ Fundamentals: Strong USD and yields keep gold capped short-term.
💡 Bias: Bearish near resistance, bullish only if price breaks above the channel.

Gold on Intra-day Selling pressureTechnical analysis: Sellers still haven’t missed their estimate as Gold aggressively invalidated #4,000.80 benchmark on multiple occasions (posing as an hard Support zone), due geo-political tensions as a strong catalyst which is putting DX in High demand on Weekly interval. Environment and general market sentiment remains however Gold friendly (about to engage relief rally) due to the Supply-Demand mechanism. DX and Gold are still diagonally correlated, their charts are again on Positive-Negative match which is elemental sign of correlation. This suggests that DX tested its multi-Month Resistance zone, and Gold is under mild Selling pressure. This doesn't affect my local Low’s Buying strategy even though Gold is isolated within Hourly 4 chart healthy Descending Channel that by my estimations will sustain according to all accounts and there are no signs of a rebound yet (it is a reversal pattern most of the times). Weekly chart was Trading near strong Support belt which was aggressively corrected Intra-day so I will not make a strategy shift and will trust my Medium to Long-term Bull model as long as Buying spree on Gold lasts. I have to be excessively careful with today's session as it represents crossroads for the Short-term.
My position: I have Sold Bought Gold throughout yesterday's session from #3,998.80 especially towards #4,008.80 (aggressive Scalps) and called it for the session. Gold delivered significant Intra-day losses on Asian session and turned timefrimes to Bearish territory. Today is Intra-day Sell session and will continue Selling Gold from my key entry points.

Daily live trade with XAUUSD in 15m/30m/1h 20251106Daily live trade with XAUUSD in 15m/30m/1h 20251106

Gold: Support at 4006–3994, Resistance Near 4030Yesterday, gold broke above the 30-minute MA60 resistance and then pulled back to retest the level, successfully turning it into support. After confirming the support, price continued to grind higher today, reaching around 4020. The MA60 remains the core support for this upward structure. Unless the market enters a strong one-way rally, a pullback is likely, with the MA20/MA30 serving as secondary support levels during the process.
On the 4-hour chart, price is currently testing the MA60 resistance while moving averages still maintain a bullish alignment. If price can successfully complete a resistance-to-support shift around the 4006-3994 zone on the 4H timeframe, it may open the door for a move toward the 4080-4100 resistance region. The first key resistance sits near 4030. Therefore, if price pulls back after testing 4030 but holds above the 4006-3994 support zone, it will retain potential to test 4050/4080-4100 area.
