XAUUSD(GOLD): From Previous Setup to this,POV remain the sameGold touched our risk entry and zone and dropped around +800 pips. We expect the price to continue falling and break through the channel. Once we have confirmation, we can focus on the risk area rather than having two selling entries. You can choose from three targets based on your setup. Please manage your risk effectively while trading gold. We wish you the best.
Good luck and trade safely.
Team Setupsfx_
Trade ideas

Gold Analysis and Trading Strategies | Monday✅ Technical Outlook (4-Hour Structure)
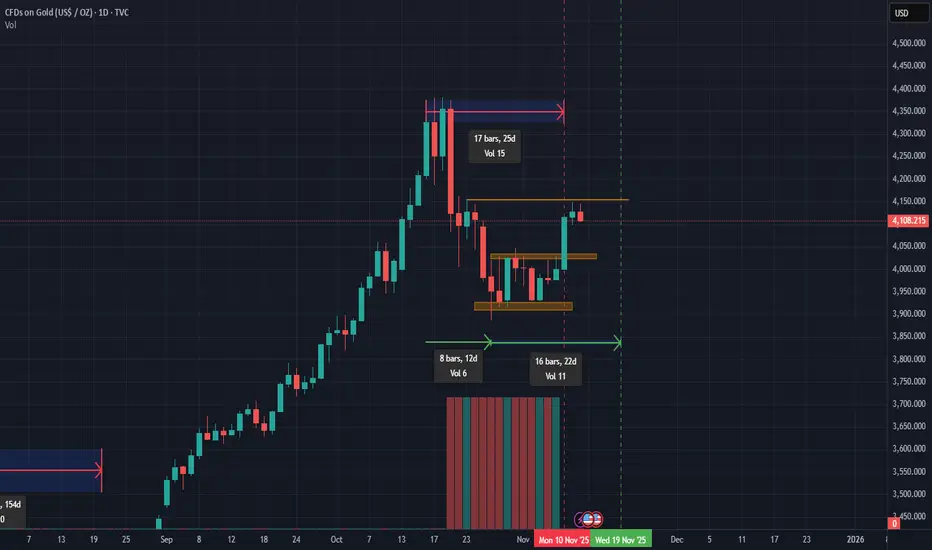
● After reaching the historical high of 4381, gold entered a corrective phase, forming a segmented structure of “decline → bottoming → rebound.”
Each segment has lasted for roughly one week.
Currently, after touching 4245, gold has entered the second corrective wave, and from a cycle perspective, this adjustment is not fully completed yet.
● Over the past two days, gold has repeatedly found support around the 4000 psychological level, showing signs of rebound. This indicates that buyers are actively defending this area and that short-term bullish interest remains.
● Short-term moving averages (MA5, MA10, MA20) are currently clustered around the 4080–4100 region, forming strong pressure and signaling that the short-term trend remains bearish.
However, the long-term moving averages are slowly turning upward, suggesting that downside support remains valid and that deeper declines may be limited.
● The Bollinger Bands continue to narrow, indicating a range-bound and repetitive price structure.
The lower band is gradually aligning with previous lows, which together limit the downside space for further price declines.
✅ Daily Chart Structure
● Gold remains in a consolidation phase, with the overall Bollinger Bands displaying a gradual narrowing pattern, suggesting that a one-directional move is unlikely in the near term.
● The lower band is steadily rising and aligning with prior lows → limiting further downside risk.
● The upper band remains near 4100–4130, serving as the main short-term resistance zone for rebounds.
🔴 Resistance Levels: 4100–4130
🟢 Support Levels: 4005–4000
🎯 Trading Strategy Reference
🔰 Strategy 1 (Sell on Rebound)
● Short around 4100–4105 in batches
Targets: 4050–4020
Breakdown target: 4000
🔰 Strategy 2 (Buy on Pullback)
● Buy around 4000–4005 in batches
Targets: 4020–4030
Breakout target: 4050
📌 Outlook for Next Week
Overall, gold remains in a structure of weak consolidation — supported but with limited rebound strength.
The price is expected to continue oscillating within the 4000–4100 USD range next week.
● If Federal Reserve officials sound more “hawkish”:
Rate-cut expectations decline → USD strengthens → Gold may retest the 4000 support.
● If Fed officials turn more “dovish”:
Rate-cut expectations rise → Gold may retest the 4100 resistance zone.
● If geopolitical tensions escalate:
Safe-haven demand may push gold to break above the upper boundary of the range.
Next Monday’s short-term focus remains the 4000–4100 range.
Wait for a breakout, then follow the direction accordingly.
XAU/USD – OTE Retracement Into Monthly VWAP ZoneGold is consolidating below the monthly VWAP and its ±1 deviations, while price continues to trade inside a balanced volume area.
I'm watching for a potential retracement into the OTE zone, aligning with the VWAP deviation and a low-volume pocket on the profile.
If price reaches this area and shows rejection, I expect a continuation lower toward the $4,000 – $3,886 liquidity zone, which sits just below the current range.
The plan:
Short-term push upward to grab liquidity into the OTE + VWAP zone
Then a potential bearish continuation toward the next clean downside targets

Gold NY Session Strategy 11/19: Will up to 4162 Gold Daily Plan – SMC Outlook (Nov 20)
Framework: CHoCH – BOS – FVG – POI – Premium/Discount Model
1. Market Context
Gold continues to recover after the sharp drop earlier this week. Price is now approaching the Premium zone of the current bullish swing and tapping into H1 supply. The market shows:
Buyers still in short-term control
Momentum weakening as price reaches resistance
A corrective pullback into Discount is likely before any further expansion
2. Structural Overview (SMC Logic)
🔻 Overall Market Structure
A key BOS formed around 4090–4100 → confirms short-term bullish structure
Follow-up CHoCH signals continuation of the intraday uptrend
Price is moving toward the upper FVG + Supply Zone (4160–4162)
🔸 Orderflow Notes
Strong reaction at the 4140 area → clear presence of passive Sell Limit absorption
Demand POI at 4091–4089 held exceptionally well → main bullish mitigation zone
3. Trading Zones (POI)
✅ BUY Zone (Discount Area)
4091 – 4089
Demand + previous CHoCH + fib 1.272 confluence
Ideal low-risk long setup within Discount
Suggested SL: 4087
BUY Scenario:
Price retraces to POI → shows bullish reaction → long toward Premium.
❗️ SELL Zones (Premium Area)
Aggressive Sell Zone:
4143 – 4145
SL: 4147
Optimal Sell Zone:
4160 – 4162
Major supply + imbalance + fib 2.618 extension
Highest probability for reversal
SL: 4165
4. Trade Scenarios
📌 Primary Scenario (High Probability)
Price retraces into 4091–4089 Demand
Look for CHoCH/BOS confirmation on lower timeframe
Enter BUY → target 4143 → 4160
→ Classic SMC model: Buy from Discount → Sell from Premium.
📌 Alternative Scenario
If price rallies straight into 4143–4162 without retracement:
ONLY enter SELL when a clear bearish CHoCH or strong rejection forms
Target: 4100 → 4090
5. Intraday Bias
→ Bullish in Discount zones – Bearish in Premium zones.
Trade based on orderflow → Do not chase price in the middle range.
6. Summary
BUY: 4091–4089 (SL 4087) → TP: 4140 – 4160
SELL:
• 4143–4145 (SL 4147)
• 4160–4162 (SL 4165)
Wait for confirmation at each POI; avoid mid-range entries.

How will gold break out of its current predicament next week?
news:
On Friday, Williams, president of the New York Fed and one of the Fed's "Big Three," made a decisive statement, both setting the tone and saving the market from crisis. As a key figure sharing power with Powell and Jefferson, he bluntly stated that interest rates are "very likely to be adjusted further in the near future."
Of course, the hawks didn't back down either. Boston Fed President Collins was worried about inflation, while Dallas Fed President Logan was even tougher, questioning whether they should have voted on the previous two rate cuts, although Logan doesn't have voting rights this year.
technology:
Regarding the Golden Week holiday, the gold market experienced range-bound trading over the past week. The highest price reached was $4132, and the lowest was $4022, with an overall fluctuation range of approximately $110. However, for most of the week, gold prices fluctuated repeatedly within the $4040-$4110 range, with the fluctuation range narrowing to around $70.
Currently, after touching $4240, gold prices are temporarily in a second downward correction phase, and judging from the timeframe, this correction is not yet fully over. However, gold prices have twice found support and rebounded near the $4000 level, indicating that bulls have the potential for a short-term counterattack at this level.
Looking at the 1-hour chart, the short-term resistance level to watch is around 4110, while the support level is around 4020. Technically, the trend is more inclined towards a correction followed by an upward move. I will provide specific trading strategies in the channel, so please pay close attention.
Strategy Signals:
buy:4040-4035,SL:4025,TP:4080,4100

Gold trend in the last week of November⚔️1. Trendline
Descending Trendline (upper red line)
Acts as the main dynamic resistance.
Every retest results in rejection → the overall trend remains bearish.
The 4.150 – 4.160 zone is likely where price may retest the trendline before reversing lower.
Ascending Trendline (lower red line)
Previously the nearest dynamic support but has now been broken.
The downside breakout signals weakening momentum, favoring SELL setups.
⚔️2. Resistance Zones
Resistance 1: 4.148 – 4.150 (Fibo 0.5 – 0.618)
Confluence of Fibonacci retracement and the descending trendline.
High probability that price will retest this area and reject strongly.
Resistance 2: 4.245 – 4.250
The strongest resistance zone (Fibo 1.0).
Only reachable if a strong bullish pullback occurs.
⚔️3. Support Zones
Support 1: 3.995 – 4.000 & 4.028 – 4.030
Confluence of static support + psychological level.
A technical bounce may appear here.
Support 2: 3.890 – 3.900
The strongest support zone.
Main downside target if the price gets rejected from the upper resistance.
⚔️4. Price Scenarios
⭐️Primary Scenario (Bearish)
Price pulls back to 4.148 – 4.152, retests the descending trendline → rejection → moves down toward:
TP1: 3.995
TP2: 3.890
⭐️Alternative Scenario (Bullish)
Valid only if:
Price breaks above the descending trendline
Closes above 4.160
→ Next target: 4.250
TRADING RECOMMENDATIONS
BUY GOLD: 3890 – 3888
SL: 3878
TP: 100 – 300 – 500 pips
SELL GOLD: 4250 – 4248
SL: 4260
TP: 100 – 300 – 500 pips

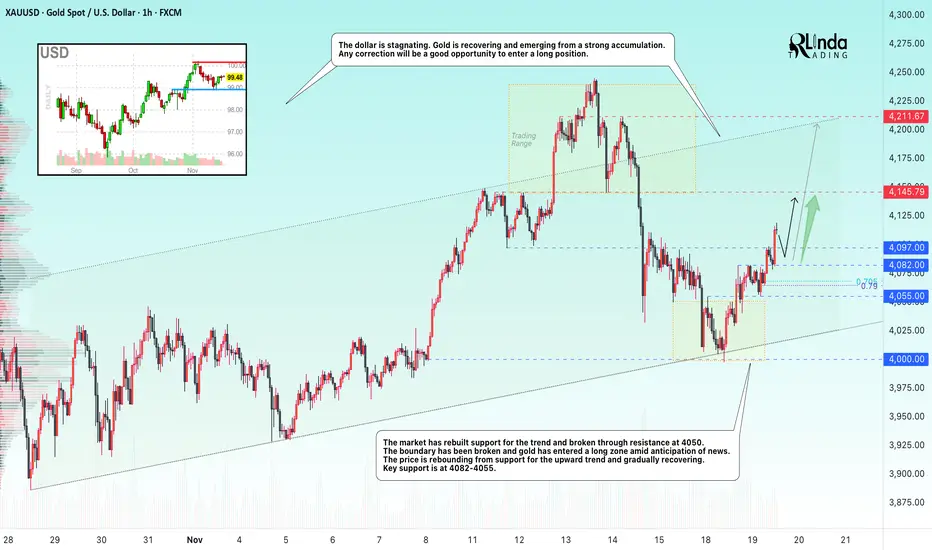
GOLD → Market support, exit from consolidationFX:XAUUSD is feeling market support ahead of the news. The price is rebounding from trend support, breaking through strong resistance and enjoying high interest from bulls...
The rise in demand for defensive assets is driven by concerns about the overvaluation of technology stocks and weak US labor market data. The number of applications for unemployment benefits rose significantly in October. Private employers cut jobs for four weeks. The Fed minutes may show disagreement over the regulator's future policy, and the probability of a rate cut in December is estimated at 50/50. The market's attention is focused on September NFP data (forecast: +50K).
Gold is awaiting signals from the Fed and employment data. The Fed's cautious stance and weak NFP data could support further price growth.
Resistance levels: 4145 - 4211
Support levels: 4097, 4082, 4055
Gold is entering a long zone. Any correction could be a good opportunity to enter the market. Pay attention to key support levels for trend trading...
Best regards, R. Linda!
Gold Nonfarm: Buy OB 4030, Target Break 4111🔍 Market Context – November 20, 2025
Gold initially dropped nearly 70 pips at the start of the day but quickly rebounded sharply from the 4030–4032 zone, demonstrating strong buying pressure and a refusal to decline further.
The market structure on the H1–H2 timeframe is forming a classic, well-defined Inverse Head & Shoulders pattern—a quintessential bullish reversal pattern—signaling a potential upward expansion if the neckline is successfully broken.
📅 Key News Events Today:
🇺🇸 Non-Farm Payrolls (NFP)
📉 US Unemployment Rate
🏛 FOMC Meeting Minutes
🗣 Speeches by Trump, Barkin, Williams
🧾 Initial Jobless Claims
⚠️ These events could trigger sharp volatility and will determine the confirmation or rejection of the reversal pattern.
📊 Technical Analysis
🛒 BUY SETUP – Primary Priority
✅ Entry: 4030 – 4032
🛡 Stop Loss (SL): 4027
🎯 Take Profit (TP):
TP1: 4039
TP2: 4047
TP3: 4059
💡 Rationale: Price bounced strongly at the OB + SSS zone. This is a crucial technical support area and the base of the Inverse H&S pattern. The objective is to break the neckline to trigger the uptrend.
🔻 SELL SETUP – Short-Term Strategy
📍 Entry: 4093 – 4095
🛡 SL: 4098
🎯 TP:
TP1: 4088
TP2: 4077
TP3: 4060
TP4: 4033
💡 Rationale: This strategy is only applicable if the price forms a false breakout of the BSL zone and reverses. This is an ideal entry point for quick scalping if the market reacts negatively to the news.
🔑 Key Price Zones
Buy Zone (OB + SSS): 4030 – 4032
→ Strong demand zone, the base of the Inverse Head & Shoulders pattern, confirming the reversal signal if held.
Breakout Neckline Zone: 4101 – 4111
→ The neckline of the Inverse H&S pattern. Breaking this zone will open up opportunities for a sharp rise.
Final Resistance Zone: 4133 – 4140
→ The final target if the breakout is successful and the bullish pattern is confirmed.
✅ Strategy Conclusion
🎯 Main Strategy: Priority is to BUY in the OB zone 4030–4032.
🩸 SELL is only for short-term scalping if there is a signal of rejection at the BSL zone.
🕓 Caution: Be careful entering trades near the Nonfarm news release time—wait for price action to confirm the direction.

Smart Money Concept (GOLD)📊 PROFESSIONAL BREAKDOWN
1️⃣ Accumulation + Liquidity build-up
Price formed a solid range where liquidity was built on both sides, preparing the institutional move.
2️⃣ ChoCH + BOS: Real bullish shift
The sequence confirms bullish intent with both a structural break and a change of character.
3️⃣ Fake Out / Liquidity Grab
A sweep above the range confirms manipulation and removes buy-side liquidity before the true move.
4️⃣ Clean rejection at support
The current rejection aligns perfectly with institutional demand, validating the BUY zone.
5️⃣ Optimal BUY at 4,056
Confluences:
• ChoCH retest
• Support zone
• Previous FVG
• Strong rejection
6️⃣ Professional SL at 4,028
Placement is clean, safe, and protected from volatility spikes.
7️⃣ Target areas
• TP1: 4,112 → resting liquidity
• TP2: 4,150 → FVG mitigation in 1H
Both targets align with institutional price delivery.
🌟 Motivational Message
“Mastery comes from understanding the story behind each candle. Keep sharpening your institutional eye.” GOOD LUCK TRADERS

Gold H1 – Is This Just a Range or a Break Incoming?🟡 XAUUSD – Intraday Smart Money Plan | by Ryan_TitanTrader (21/11)
📈 Market Context
Gold continues to trade inside a compressed intraday range as markets react to the latest discussion on whether the Federal Reserve is likely to cut interest rates anytime soon.
According to new reports, policymakers remain cautious, and early rate-cut expectations are fading as inflation progress slows.
This shift pushes USD stronger, increases Treasury yields, and temporarily weakens gold’s bullish momentum.
Key takeaways from the news:
• Fed officials note that inflation is “still not where it needs to be,” reducing the probability of early rate cuts.
• Markets have scaled back expectations for a Q1 cut, keeping USD supported.
• Higher yields → tighter financial conditions → gold struggles to break premium levels.
• Institutions are likely engineering liquidity grabs on both sides before committing to a new directional move.
Price is currently sitting near the 4030–4045 zone, right above discount liquidity, waiting for a catalyst to break out of the short-term compression.
🔎 Technical Analysis (1H / SMC Structure)
• Market Structure:
Gold has completed a clear CHoCH + short-term bearish sequence and is now compressing into the discount zone around 4030.
• Premium Sell Zone (4H Supply):
4128–4130 aligns with unmitigated supply + buy-side liquidity resting above internal highs.
• Discount Buy Zone:
4030–4028 sits inside the last clean demand zone where a previous sweep occurred.
• Liquidity Map:
→ Buy-side liquidity: above 4128–4135
→ Sell-side liquidity: below 4028–4020
Institutions are likely to sweep one side before delivering direction.
🔴 Sell Setup (Premium Reaction Zone)
• Entry: 4128 – 4130
• Stop-Loss: 4140
• Take-Profit:
→ 4080 (minor imbalance fill)
→ 4045 (range EQ)
→ 4030–4028 (discount demand retest)
📌 Execution rule: Wait for liquidity sweep into the zone + bearish CHoCH on M5–M15 before entering.
🟢 Buy Setup (Discount Reaction Zone)
• Entry: 4030 – 4028
• Stop-Loss: 4020
• Take-Profit:
→ 4060 (short-term reaction level)
→ 4095 (inefficiency fill)
→ 4120 (premium retest)
📌 Valid only if price sweeps the 4030–4028 pocket and shows bullish displacement from discount.
⚠️ Risk Management Notes
• USD strength may spike unexpectedly as rate-cut bets fade — reduce position size during volatility.
• Avoid trading inside the 4045–4085 chop zone unless a clean structure break forms.
• Manage trades aggressively once liquidity levels are taken.
• Expect engineered manipulation during low-volume Asian hours.
📝 Summary
Gold is compressing inside a narrow intraday range as markets reassess the likelihood of Fed rate cuts.
SMC structure suggests a two-sided liquidity sweep before a decisive move:
• Sell Zone: 4128–4130 (premium supply)
• Buy Zone: 4030–4028 (discount demand)
Expect classic accumulation → sweep → displacement patterns until macro conditions create a new trend.
📍 Follow @Ryan_TitanTrader for more Smart Money updates.

Gold Weak Below 4084 as Market Awaits PMI DataGOLD – Technical & Fundamental Outlook
FX:XAUUSD attempted a bounce from the 4030 support and is currently trying to approach the 4085 resistance, but overall momentum still appears weak.
From the fundamental side, recent data was mixed — NFP showed growth while the unemployment rate increased, creating higher volatility. Rate-cut expectations also remain muted, with markets pricing around 40% probability for another Fed cut, keeping the Fed cautious about premature easing.
Today, gold traders will monitor the PMI data, which may shape intraday volatility and short-term direction.
Technically Gold maintains a bearish structure in both the short and medium term while trading below 4084.
Below 4084, price is expected to retest 4030,
and a break below this zone can extend the decline toward 4008 – 3982,
as long as the fundamental backdrop remains unchanged.
On the upside, a 1H candle close above 4084 would invalidate the bearish setup
and open the door for a move toward 4104.
Pivot Line: 4051
Resistance: 4084, 4104, 4133
Support: 4030, 4008, 3982

XAUUSD Next Week Bull/Bears?The results of the analysis on xauusd, using ICT strategy.Please note: This is just an illustration.Trade according to your analysis and research Use good risk management

XAU/USD ANALYSIS 11/21/20251. Fundamental Analysis
a) Economics
– USD:
• The USD is slightly weakening as markets expect the FED to keep rates unchanged and still lean toward rate cuts in the upcoming quarters.
• No strong hawkish signals, so the USD is not putting significant pressure on gold this morning.
– U.S. Stock Market:
• U.S. equities edged higher last night thanks to rate-cut expectations, but the upside momentum is weak as markets await more economic data.
• Risk-on sentiment is mildly present, creating slight pressure on gold but nothing major.
– FED:
• The FED maintains a “data-dependent” stance without introducing new tightening signals.
• This provides medium-term support for gold (preventing deep declines).
– TRUMP:
• The Trump administration prioritizes tax cuts and economic support, increasing expectations of inflation.
• Long-term outlook: gold remains supported due to future Fed rate cuts.
– Gold ETF – SPDR:
• SPDR did not add holdings in the latest session → the gold market is waiting for December data.
• No large inflows → confirms a sideways, wait-and-see environment.
b) Geopolitics
• Middle East tensions have eased in the past 24 hours but are not fully resolved → no major gold volatility.
• Markets are watching the upcoming U.S.–EU diplomatic meeting on security issues.
c) Market Sentiment
• Current sentiment is mild risk-on, not strong.
• Risk-seeking investors are returning to equities but still keep a defensive allocation in gold → expectations for gold: sideways to slightly upward, not a strong decline.
2. Technical Analysis
– Trend:
• GOLD is moving sideways within the 4040 – 4115 range.
• RSI shows a mild bearish divergence, but not strong enough to create a downward trend.
– Key Levels:
• Major resistance: 4096 – 4125 – 4153
• Major support: 4050 – 4029 – 4000 (round number)
• Low volume → confirms a “hibernating market” as yesterday’s news was neutral.
– Projection for today:
• Gold is expected to continue ranging within 4040 – 4125 until a breakout later in the evening.
• High probability of retesting 4040–4050 before bouncing upward toward 4125, following the indicated arrow.
3. Yesterday’s Market
• GOLD moved within a sideways box pattern, repeatedly touching the top and bottom of the 4040–4100 range.
• No significant breakout occurred.
• Early top-picking and bottom-fishing trades were all “stop-hunted” both ways.
• Low liquidity at the end of the session → confirms the market is waiting for December data.
4. Trading Strategy for Today (Nov 21)
🪙SELL XAUUSD | 4147 - 4145
⚰️SL: 4153
⬆️TP1: 4137
⬆️TP2: 4129
🪙BUY XAUUSD | 4004 - 4006
⚰️SL: 3998
⬆️TP1: 4014
⬆️TP2: 4022

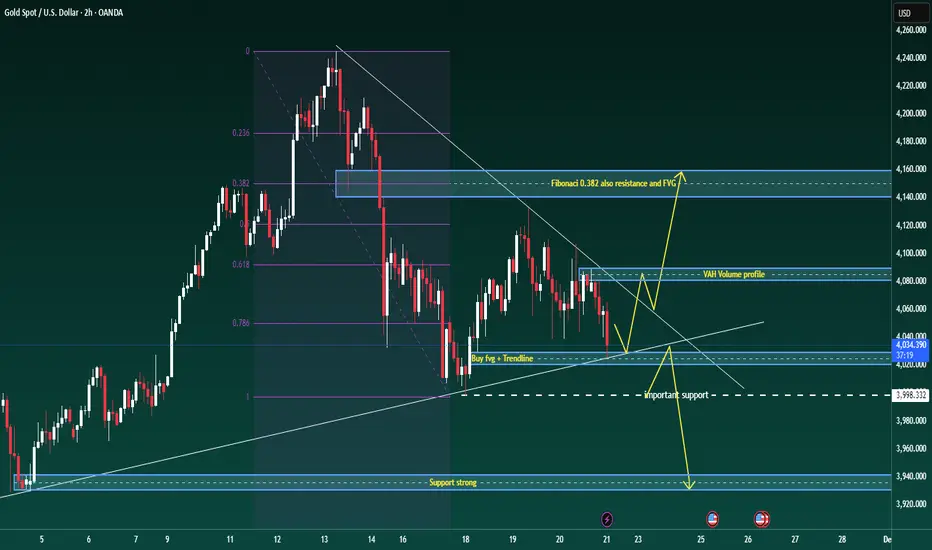
Gold is stuck in a wide range, ready for a decisive break.Good evening traders, Brian here with a fresh look at gold on the 2-hour chart.
Price is compressing in a broad sideways range, building energy for the next leg – the break from this structure will set the tone for the coming sessions.
Fundamental analysis
The core driver remains the Fed’s December decision. The market is effectively split on whether we see a cut or a delay:
A camp of institutions argues that rising unemployment and softer data could still justify a 25-basis-point cut in December, keeping pressure on the dollar and supporting gold on dips.
Others point out that the Fed is short of clean, up-to-date data and may prefer to wait until next year before committing to an easing cycle.
As a result, pricing for a December cut is roughly “fifty–fifty” and highly sensitive to the next run of labour-market and activity data.
In short: the macro backdrop is undecided, so intraday direction will be driven mainly by levels and liquidity until the next data catalyst hits.
Technical analysis
On the H2 chart, gold is in a broad consolidation after the recent sell-off:
Price is trading inside a descending structure, repeatedly respecting the short-term trendline from the recent high.
The Fibonacci retracement of the latest impulse shows the 0.382 level lining up with a prior fair-value gap and horizontal resistance – this forms a key rejection zone overhead.
Below price, there is a confluence of support where the rising trendline meets a small bullish FVG around 4027–4029, followed by a more important horizontal support band near 3998.
The volume profile highlights a Value Area High (VAH) around 4075–4080, which is likely to act as a reaction zone if price rotates back into it.
Until we break convincingly out of this structure, I treat it as a large accumulation range with a slight downside bias: sellers are still defending lower highs, but buyers are stepping in aggressively at trendline support.
Key levels
Resistance zones:
4080–4085 (VAH / short-term supply)
4135–4145 (Fibonacci 0.382 + FVG + structural resistance)
Support zones:
4027–4029 (trendline + FVG confluence buy area)
3995–4000 (important horizontal support)
3940 region (deeper support if the range finally breaks down)
Trade scenarios
1. Primary long – buy the trendline/FVG confluence
Entry: 4027–4029
Stop: 4023
Targets: 4035 – 4050 – 4068 – 4080
Idea: look for price to react at the rising trendline where it overlaps with the small FVG. A clean rejection candle or shift in intraday order flow from that zone sets up a rotation back towards the VAH and potentially the upper boundary of the range.
2. Break-and-retest short – if the trendline fails
Trigger: clear H1/H2 close below the rising trendline and the 4027 area
Plan: wait for price to retest the underside of the broken trendline / prior support
Entry: on rejection of that retest
Initial targets: 4000, then 3940 if momentum accelerates
This scenario treats any breakdown as a structural shift, using the retest as a lower-risk point to join the move rather than chasing the first leg.
3. Intraday scalp zones
These are discretionary, short-term opportunities for active traders:
Reaction sells: around 4085, and higher up if we spike into the 4135–4145 resistance band. Look for exhaustion or rejection patterns back into the range (potential targets 4060 then 4033).
Reaction buys: into 3998–4000 if we see a liquidity sweep below the current range, with tight stops and quick profit-taking back towards the mid-range.
DeGRAM | GOLD will test the $4000 level📊 Technical Analysis
● The XAU/USD hourly chart shows price failing to break above the descending resistance line, reinforcing a bearish structure.
● Price is now approaching the longterm rising support line near ~4,000; a break below this trendline would open downside toward ~3,930.
💡 Fundamental Analysis
● Gold faces pressure as U.S. Treasury yields climb and real U.S. rates remain elevated, reducing the appeal of zero-yielding bullion.
✨ Summary
Resistance: ~4,110. Support: ~4,000 → ~3,930. Short-term bias: bearish while below resistance and at risk of breakdown below trendline.
-------------------
Share your opinion in the comments and support the idea with a like. Thanks for your support!

Monthly Gold "The end"🟡 Comprehensive Analysis of Gold (XAUUSD)
In this analysis, we can clearly see that gold is still moving within a strong bullish channel. The price is respecting the structure formed by the upper resistance line and the two support lines (0 and 0.5) below.
🔵 The previous all-time high was around 1,952, and as shown on the chart, the price has broken above that level and continued into a powerful rally, reaching a new all-time high around 4,502.
✨ After this strong upward movement, the price touched the upper boundary of the channel — a zone that typically acts as a point of rejection. The chart illustrates a potential scenario where the price may start a pullback, enter a consolidation phase, and then drop to retest one of the support lines.
✔️ In other words: Gold is currently in a sensitive area. The new all-time high may trigger a correction before the market decides its next major move. However, the overall long-term trend remains bearish.
📉 The oscillator at the bottom shows strong overbought conditions, which increases the probability of a short-term downward correction.
🔔 Summary
Overall trend: bearish
Current position: At major resistance
Most likely scenario: long-term correction toward support (at 3510)
Best opportunities: May appear at lower levels after the market cools down
The Entries:
Downtrend: Until correction could be around (4000-3510)
If the price close under 4000 that mean we are going to 3510,
if the price close above the 4000 that mean we are going to rise maybe more than ATH could be 4800 or 5000.
Have a nice trade fellas.

Bullish bounce off?Gold (XAU/USD) has bounced off the pivot which aligns nicely with the 61.8% Fibonacci retracement and could potentially rise to the 1st resistance.
Pivot: 4,043.08
1st Support: 3,973.06
1st Resistance: 4,149.32
Disclaimer:
The opinions given above constitute general market commentary and do not constitute the opinion or advice of IC Markets or any form of personal or investment advice.
Any opinions, news, research, analyses, prices, other information, or links to third-party sites contained on this website are provided on an "as-is" basis, are intended to be informative only, and are not advice, a recommendation, research, a record of our trading prices, an offer of, or solicitation for, a transaction in any financial instrument and thus should not be treated as such. The information provided does not involve any specific investment objectives, financial situation, or needs of any specific person who may receive it. Please be aware that past performance is not a reliable indicator of future performance and/or results. Past performance or forward-looking scenarios based upon the reasonable beliefs of the third-party provider are not a guarantee of future performance. Actual results may differ materially from those anticipated in forward-looking or past performance statements. IC Markets makes no representation or warranty and assumes no liability as to the accuracy or completeness of the information provided, nor any loss arising from any investment based on a recommendation, forecast, or any information supplied by any third party.

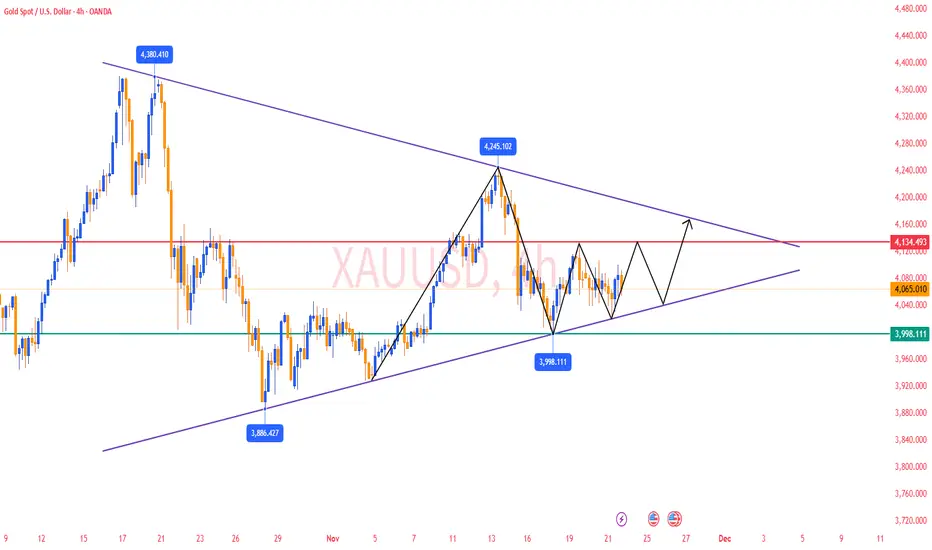
Gold remains bullish.Gold maintained its bullish structure, closing significantly higher on the daily chart. The New York closing price once again rose above the 10-day moving average (MA10) at 4105, with the 5-day and 7-day moving averages forming a golden cross and trending upwards. The RSI indicator is above the midline. On the shorter-term 4-hour and hourly charts, the Bollinger Bands are widening upwards, with the price maintaining its position in the upper half of the bands, and the moving average system showing an upward crossover. The trading strategy for gold remains unchanged from yesterday: prioritize buying on pullbacks to support levels, and only consider selling at higher levels.
At the Asian open today, gold experienced a rebound, reaching a high of 4144 before retracing. Currently, gold is still in a consolidating upward trend, and our overall bullish outlook remains unchanged. Gold is still developing within a narrowing triangle pattern on the daily chart, with the key level around $4150. A break above this level would open up further upside potential.
Key Levels:
First Support: 4108, Second Support: 4092, Third Support: 4074
First Resistance: 4150, Second Resistance: 4167, Third Resistance: 4183
Gold Intraday Trading Strategy:
BUY: 4085-4090, SL: 4070, TP: 4110-4120;
SELL: 4170-4175, SL: 4190, TP: 4150-4140;
More Analysis →

BUY GOLD XAUUSD*I am in no way a financial advisor and you should always do your own due diligence before placing any trade. Do not trade what you are not comfortable with losing. No trade is guaranteed.
Hold buys until the high
SL BELOW STRUCTURE OF PULL BACK , TP SET TO THE HIGH.

"XAUUSD"Gold quickly reached the resistance targets it had on its upward path.
The shape of the candles formed shows that it no longer has the strength to reach higher targets within the remaining time,
so a pullback of gold toward 3900 seems more likely.
Please review the previous analyses.
GOLD SURGING AFTER NFPsetup took the right direction as expected,even though there was manipulation before direction on 1H candle

XAUUSD: Bullish Rebound Setup as Price Holds Above Wedge SupportHello everyone, here is my breakdown of the current Gold setup.
Market Analysis
XAUUSD is currently maintaining a bullish market structure after rebounding from the key Wedge Support Line, which continues to act as a major dynamic support for the ongoing uptrend. The chart shows that Gold previously formed a broad Range at the top, followed by a sharp rejection from the Resistance Area near $4,170–$4,200, where strong sellers stepped in. This zone remains the primary supply region and aligns closely with the Wedge Resistance Line, creating a strong confluence barrier. After the rejection, price moved back into a correction phase, retesting both the Support Zone around $4,040–$4,070 and the ascending wedge structure. Notably, the recent bullish reaction inside this zone indicates that buyers are still defending this area effectively. Multiple breakouts and a prior fake breakout highlight that sellers are struggling to maintain downward momentum, while buyers continue to accumulate at lower levels.
Currently, XAUUSD is stabilizing just above the Support Zone, forming early signs of a potential upward continuation. As long as the price respects the wedge support and holds above $4,070, the bullish structure remains intact. The market behavior suggests increasing buyer interest, especially during retests of lower support.
My Scenario & Strategy
I expect Gold to continue its upward movement from the current support area and retest the $4,170–$4,200 Resistance Zone once again. This level will be the next major decision point; a successful breakout above this zone could open the path toward higher highs and potentially signal a continuation of the broader bullish trend.
However, if XAUUSD breaks below the Wedge Support Line, the bullish outlook would weaken, and the price could revisit deeper support levels before buyers attempt another recovery. For now, bullish continuation remains the most probable scenario as long as the support structure holds. Pullback-based long entries remain the best approach while price continues to trade above the key support zone and upward trendline.
That's the setup I'm tracking. Thank you for your attention, and always manage your risk.

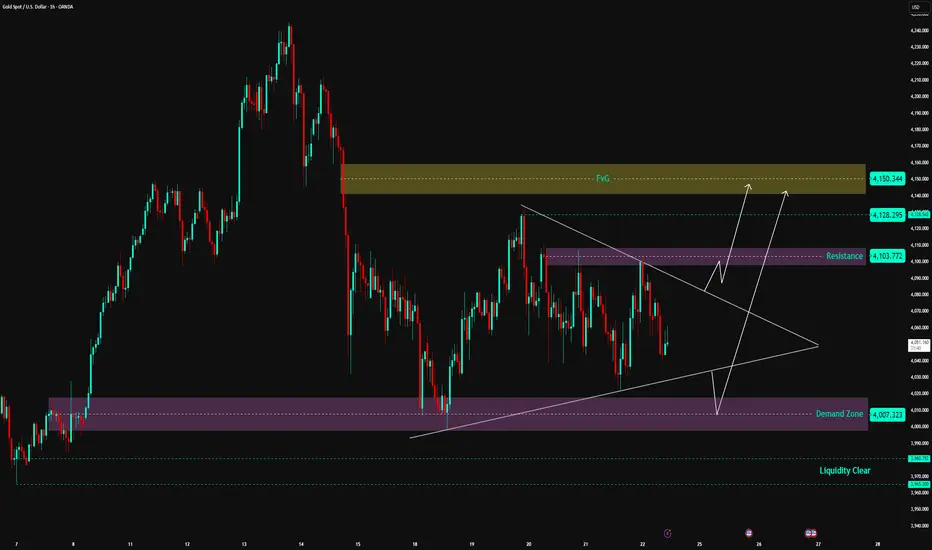
XAUUSD | Gold Set to Explode from Triangle Pattern—Act Now!📊 Market Structure
Gold is entering a tight accumulation phase within a Symmetrical Triangle pattern – indicating compression before a strong breakout.
On the downside, the price is still supported by the Demand Zone 4,007 – 4,020 USD , which is the main support area for the medium-term uptrend structure.
On the upside, the Resistance Zone 4,103 – 4,110 USD continuously exerts pressure, causing price rejection.
Currently, gold is trading right in the middle of the compression triangle → the market is preparing to choose a direction.
Looking at the wave structure, the trend slightly leans towards a break up to sweep liquidity in the high area.
💎 Key Technical Zones
• ⭐ FVG Supply Zone: 4,128 – 4,150 USD → expected strong reaction area if price breaks up
• 🟣 Resistance Zone: 4,103 – 4,110 USD → decisive area for direction
• 🟪 Demand Zone: 4,007 – 4,020 USD → strong base maintaining structure
• 🟦 Liquidity Clear: 3,980 USD → risk area if price collapses the triangle
🎯 Trading Plan – Two Possible Scenarios
1️⃣ BUY – Wait for Breakout from Triangle (priority scenario)
If the price breaks the resistance zone 4,103 – 4,110 with a strong H1 closing candle:
• Entry: 4,112 – 4,115
• SL: 4,095
• TP1: 4,128
• TP2: 4,145
• TP3: 4,150 (reach FVG)
→ This is a trend-following setup, with a high probability of sweeping liquidity above after the break.
2️⃣ BUY – Retest Demand Zone 4,007 – 4,020
If the price continues to follow the triangle pattern and falls to the trendline + demand zone:
• Entry: 4,010 – 4,017
• SL: 3,990
• TP1: 4,103
• TP2: 4,128
• TP3: 4,150
→ This is a very strong confluence area between Demand Zone + Trendline + pattern base.
❌ SELL? When is it valid?
Currently, selling is not prioritized, as the price is still above the Demand Zone and the larger structure still favors an uptrend.
Selling is only valid if the price:
• Breaks strongly below 4,007 USD
→ At this point, the market turns bearish, with a distant target of 3,980 USD.
🧠 Vincent’s View
Gold is under strong compression. When the triangle pattern is broken, the move will be extremely fast and decisive.
The current trend leans towards breaking up and heading straight into the FVG area 4,128 – 4,150 USD.
Just be patient and wait for the confirmation candle — don’t predict, react to the market.
⚡ “Breakout is born from pressure — patience profits.”
⏰ Timeframe: 1H
📅 Update: 24/11/2025
✍️ Analysis by: Captain Vincent