Gold (XAUUSD) – 25 Nov | Watching POI Zones 4094 & 4069🟡 Gold (XAUUSD) Analysis – 25 November
Hello Disciplined Traders,
Welcome to the Chart Is Mirror Community 👋
Market Context
• As per our yesterday’s analysis , the 4042.1–4031.2 demand zone was respected and the long setup played out beautifully.
• We witnessed nearly a 1000-pips upside momentum from this demand zone, resulting in a clear M15 structure shift to bullish .
• Price is now in the pullback phase , and we are patiently waiting for price to return to our POI zones for the next opportunity.
Key Observations
• The first potential POI for long setup is the 4094–4088 zone .
• The next potential POI for long setup lies lower at 4069–4063 .
• If either POI is respected with LTF bullish confirmation , we could see price move toward the 4162 level .
• If neither zone is respected, do not rush — we have a strong demand + HL level at 4049–4039 , which will act as the last buy zone .
• If this zone breaks downward, stay out — we will reassess the structure and plan accordingly.
Execution Plan
• Monitor price reaction at 4094–4088 and 4069–4063 .
• Only execute with LTF confirmation — no confirmation, no entry.
• If both zones fail, wait for reaction at 4049–4039 before considering any setup.
• The market is very volatile — manage position size and risk carefully .
The patient trader waits — the market always comes to structure.
📘 Shared by @ChartIsMirror
Trade ideas

GOLD rises amid uncertain signals from US economyOANDA:XAUUSD continued to rise in Wednesday's session, as investors increased their holdings of safe-haven assets amid the delay of US employment data due to the government shutdown and the market prepared for the minutes of the Federal Reserve's October meeting.
As of the morning of November 20, spot gold was trading around $4,078/ounce, up about $11, or 0.27%, from the previous day.
Gold's rise coincided with the stabilization of global stocks after a sell-off related to concerns about artificial intelligence valuations. However, investor sentiment remained cautious ahead of Nvidia's business results and a series of US economic data due this week.
Weakening labor market signals support OANDA:XAUUSD
Data released on Tuesday showed the number of Americans receiving unemployment benefits rose to a two-month high in mid-October, a sign that the labor market may be losing momentum.
Against this backdrop, any signs of labor market weakness would reinforce expectations that the Fed may have to ease policy more quickly, providing support for gold, a non-yielding asset that benefits from lower interest rates.
Market focus: Fed minutes and delayed jobs data
Investors are turning their attention to the minutes from the Fed’s October meeting, due at 2 p.m. ET. Despite the 25 basis point cut at its most recent meeting, Chairman Jerome Powell continued to maintain a cautious stance, leaving open the possibility of a pause in easing if inflation risks return.
Separately, the September jobs report, delayed by the government shutdown, is due out on Thursday. This is seen as an early indicator of economic growth strength, with Reuters forecasting non-farm payrolls to rise by around 50,000 jobs.
Any weaker-than-expected figure could boost haven demand and continue to support gold prices.
Rising interest rate cut expectations, a key driver of OANDA:XAUUSD
According to CME FedWatch, the market now rates a 51% chance of the Fed cutting rates again at its next meeting, up from 46% in the previous session.
This increase in expectations is the core factor triggering capital flows to gold, in the context of falling real yields and investors looking for value preservation as the growth outlook becomes more uncertain.
TECHNICAL ANALYSIS AND SUGGESTIONS OANDA:XAUUSD
After recovering from the bottom around $4,000, gold price hit the 0.236 Fibonacci retracement at $4,128 and was immediately rejected, showing that profit-taking pressure is still strong.
• The main trend is still up, as the price is still in the medium-term uptrend channel and above the important MA line.
• The 3,972 area (Fib 0.382) is acting as short-term support, accompanied by the MA line right below around 3,942.
• Since it has not been able to break the 0.382 Fib level, gold is currently not in the best condition for a new uptrend.
RSI has rebounded but has not yet exceeded 60, showing that the buyers have not fully returned, but there are no signs of strong weakness.
SELL XAUUSD PRICE 4108 - 4106⚡️
↠↠ Stop Loss 4112
→Take Profit 1 4100
↨
→Take Profit 2 4094
BUY XAUUSD PRICE 3982 - 3984⚡️
↠↠ Stop Loss 3978
→Take Profit 1 3990
↨
→Take Profit 2 3996

shortI’m taking a short-term short position on Gold after the market created a clear Change of Character (CHOCH) on the lower timeframe.
This shift shows early weakness and confirms that price may retrace before continuing its overall bullish trend.
🎯 Target:
The main target for this short is the 1-Hour BOS zone, which is the most logical area for a deeper pullback and where buyers may re-enter the market.
📌 Reasoning:
Higher timeframes remain bullish, so this is a short-term countertrend trade.
Lower timeframe CHOCH confirms momentum shifting temporarily to the downside.
Liquidity above previous highs has been taken, increasing probability of a retracement.
The 1H BOS zone is a strong demand area where price is likely to react.
⚠️ Note:
This is a tactical short, not a long-term reversal. I’ll switch back to longs once price reaches the 1H BOS zone and shows bullish confirmation.

Gold Reversal heading towards 4140Gold Re- Buy Opportunity
Entry zone 4050-55 stopout below 4045
Targets : 40_70_80_90_4100 extends
Price Got rejected to break below 4030s Demand Zone , if Failed to closes above 4070 Reaccumulation and if brokes through the 4070 s
Targeting 4100
Demand + fvg tap near 4025 , plus Trendline liquidity resting above and Equal highs At 4060
This is not a financial advice , For educational purposes

Gold dailyGold, after previous declines, has created a foundation for a long-term upward trend in the global ounce. This safe-haven asset is expected to record new monthly highs again. However, for short-term analysis, from the current price of $4,056, we set a target of $4,100 to $4,120 for the coming week or the next ten-day period.
Sasha Charkhchian

XAUUSD – Where Smart Money Strikes Today🌐 MARKET CONTEXT
Gold begins today’s session after a phase of controlled volatility, where price continued to sweep both sides of the range but failed to commit to a direction. The broader intraday structure remains bearish, with price rejecting premium levels and forming consistent lower highs.
Recent Drivers:
USD shows moderate resilience following firm Fed communication
Market sentiment cautious ahead of late-week economic announcements
No significant safe-haven inflow → neutral risk environment
Session Expectations:
London Session: Likely to trigger early liquidity sweeps above premium wicks
NY Session: Expected to deliver the main directional push
Bias: Bearish unless price reaches deep discount zones and prints a CHoCH
Price is currently trading within the middle of the intraday range → best setups remain at extremes (premium sells / discount buys).
📉 TECHNICAL ANALYSIS (SMC + LIQUIDITY STRUCTURE)
Market Structure
M30 structure remains bearish (Lower Highs → Lower Lows)
Current equilibrium zone: 4060–4080
Inducement stacking above 4147 and 4081
Liquidity Map
Buy-Side Liquidity (BSL): Above 4147 and 4081
Sell-Side Liquidity (SSL): Below 4033 and deeper cluster at 3993
These layers show engineered liquidity designed to trap impatient traders.
Imbalances (FVG Zones)
Bearish FVG: 4147–4148 → strong premium rejection zone
Minor FVG: 4079–4081 → ideal scalp sweep zone
Discount FVGs: 4033 and 3993 → high-quality buy reactions
🔑 KEY PRICE ZONES (Clear & Engaging Explanations)
4148–4147 ▶️ Premium Liquidity Trap – High-Probability Sell
This zone holds a clean bearish OB + untouched BSL above 4147.
Institutional traders typically use this area to trigger breakout buyers before reversing the move sharply downward.
4079–4081 ▶️ Mid-Premium Inducement – Scalp Rejection Zone
A compact liquidity pool sitting just above equilibrium.
Market often sweeps here during London session to induce buys before dropping.
4035–4033 ▶️ Discount Reaction Zone – Reliable Scalping Demand
Micro OB + SSL alignment makes this zone ideal for sharp intraday rebounds.
Expect fast reactions with minimal drawdown.
3995–3993 ▶️ Deep Discount Pool – Strong Reversal Zone
This region contains layered SSL + higher-timeframe discount confluence.
If price taps this zone, a significant intraday reversal becomes highly probable.
⚙️ TRADE SETUPS (SMC-Based, High Precision)
✔️ SELL SETUP 1 – Premium Rejection
Entry: 4148–4147
Stop-loss: 4126
TP1: 4135
TP2: 4105
TP3: 4080
Logic: BSL sweep + FVG mitigation → strong bearish displacement expected.
✔️ SELL SCALP – Mid-Range Liquidity Sweep
Entry: 4079–4081
Stop-loss: 4087
TP1: 4065
TP2: 4048
TP3: 4033
Logic: Sweep of inducement above mini-BSL before continuation down.
✔️ BUY SCALP – Intraday Discount Rebound
Entry: 4035–4033
Stop-loss: 4027
TP1: 4048
TP2: 4070
Logic: SSL sweep triggers a micro CHoCH → quick bullish bounce.
✔️ BUY SETUP 2 – Deep Discount Reversal
Entry: 3995–3993
Stop-loss: 3987
TP1: 4010
TP2: 4040
TP3: 4070
Logic: Key institutionally favoured zone → strong liquidity-driven reversal.
🧠 NOTES / SESSION PLAN
Only trade at extremes — avoid mid-range to prevent chop
Expect engineered fake-outs at London open
NY session likely delivers true directional movement
Wait for M5/M15 confirmation: CHoCH + BOS before executing
Avoid buying near premium zones to avoid falling into liquidity traps
🏁 CONCLUSION
Gold maintains a bearish M30 structure, favouring sell setups at 4147 and 4081.
Discount zones at 4033 and 3993 offer high-probability buy opportunities for intraday rebounds or full reversals.
Stay disciplined.
Let liquidity be your guide.
Strike only when the trap is set.

Spot gold traded under pressure and fluctuated, with the market Spot gold traded under pressure and fluctuated, with the market awaiting US data for guidance.
On Monday (November 24), spot gold continued its recent decline, facing renewed selling pressure. Gold prices are currently trading around $4050 per ounce, down approximately 0.35% on the day. Despite conflicting signals from Federal Reserve officials, the US dollar index remains high, hovering near its highest level since late May, continuing to suppress dollar-denominated gold. Meanwhile, global stock markets generally strengthened, and market risk appetite rebounded, further weakening the appeal of safe-haven precious metals. Furthermore, signs of easing tensions in the Russia-Ukraine conflict may weaken gold's safe-haven premium, suppressing bullish momentum. Over the past week, gold has generally maintained a range-bound trading pattern, without a clear direction.
The US dollar index remains firmly above the important psychological level of 100, consolidating around 100.15 on Monday, just a step away from the late May high of 100.39. The market is closely watching a series of upcoming US economic data releases, including Tuesday's PPI and retail sales figures, Wednesday's initial jobless claims, and various indicators that have gradually resumed release since the US government shutdown. These data will provide key clues about the future direction of the US dollar and could inject new volatility momentum into gold, a non-interest-bearing asset.
On the other hand, market expectations for another Federal Reserve rate cut in December have intensified. According to the CME Group's FedWatch tool, federal funds futures traders have raised their probability of a December rate cut to 70%-74%. This optimism has boosted investor appetite for risk assets, with most Asian stock markets rebounding on Monday, further weakening the safe-haven demand for gold.
This week sees a flurry of key data releases, potentially setting a direction for gold.
The US will release a number of economic data points this week, including:
US September Retail Sales (MoM)
US September PPI (YoY and MoM)
US November Conference Board Consumer Confidence Index
US November Richmond Fed Manufacturing Index
US Initial Jobless Claims for the week ending November 22nd
These data will provide important insights into the health of the US economy. Weak data could reignite market expectations of a Fed rate cut, driving gold prices to rebound and potentially even back above $4100; conversely, strong data would reduce the probability of a rate cut, potentially causing gold to break below the key $4000 support level. Furthermore, the US dollar index is currently near a six-month high; if it continues to hold above 100, it will exert sustained downward pressure on gold prices.
Technical Analysis: The range-bound pattern continues; watch for a breakout.
From a technical perspective, gold traded in a range last week. Gold prices closed lower on Monday, rebounded after hitting a weekly low of $3998 on Tuesday, and then fell back on Wednesday, closing with a small bullish candle with a long upper shadow. Thursday and Friday saw consecutive doji candles. The weekly chart ultimately recorded a small bearish candle with upper and lower shadows, indicating a stalemate between bulls and bears.
From a daily chart perspective, since gold prices encountered resistance around $4132, they have repeatedly tested the lows and rebounded, suggesting that the current trend is a rebound rather than a reversal. However, there is significant resistance around the previous high of $4110, and further upward movement will be difficult without significant positive catalysts. Although gold prices briefly rose to $4100 last Friday, they failed to break through the previous high of $4110 and quickly fell back to around $4050, showing typical consolidation characteristics.
With a lack of major news stimuli at the beginning of this week, gold is expected to continue to fluctuate within the $4000-$4130 range. Trading should focus on range trading, paying close attention to breakouts at key levels. If gold prices fail to break out effectively, the consolidation pattern may continue. Trading Strategy Recommendations:
Overall Strategy: Range-bound trading, primarily shorting on rallies, with long positions as a secondary strategy. Strict stop-loss orders are essential to control position risk.
Short Position Strategy:
Short positions in batches around 4100-4105, with position size limited to 20% of total capital. Stop-loss at 8 points. Target 4050-4030, with a further target of 4020 if the price breaks below.
Long Position Strategy:
Long positions in batches around 4020-4025, with position size limited to 20% of total capital. Stop-loss at 8 points. Target 4040-4060, with a further target of 4080 if the price breaks above.
Key Resistance and Support:
Resistance: $4110-$4130
Support: $4020-$4000
Investors should closely monitor real-time market movements and data releases, adjusting their strategies accordingly.

XAAUSD short term tradeWe saw a massive bullish trend over the past few months and now, we can see how XAAUSD is taking a breath, and trying to build a new price range between $3920-$4000 and $4200-$4350, I hardly belive that the gold will get back to a bullish movement soon, so what we should do then? I guess using trading in this range is the best decistion which we can make so far, I would prefer just to catch long and short entry points and close positions once the price reaches a necessary level, for instance, right now there is a lot of liquidity from short traders around $4100 and higher, if the price break out the triangle pattern and then it will make the retest with holding above that level, we may see a good movement to $4200 level and higher.

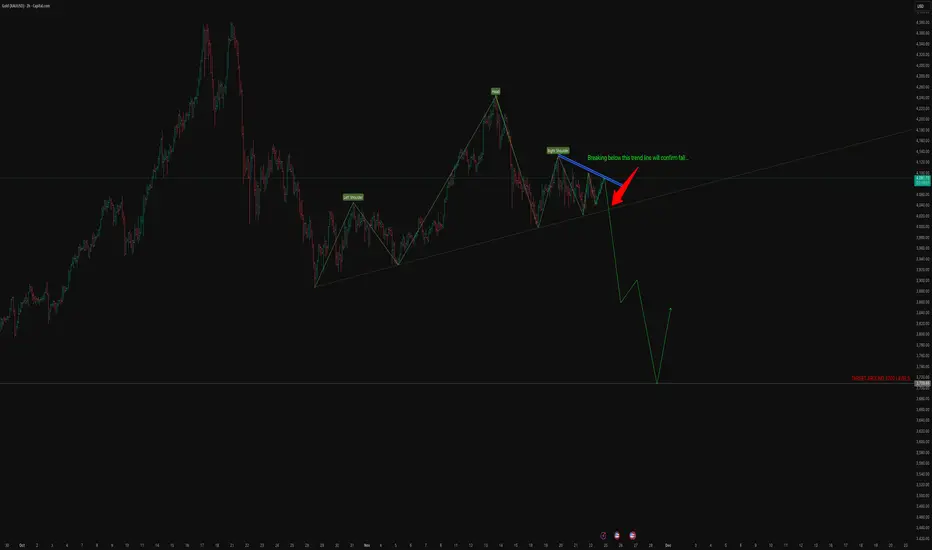
Analysis for GOLD (30-min chart)GOLD – Technical Analysis (Based on Your Chart Structure)
Timeframe: 30-min
Bias: Strongly Bearish
Expected Target: ≈ 3700
1. Pattern Structure Identified
chart clearly shows:
A. Completed Head & Shoulders Pattern
Left Shoulder – confirmed
Head – sharp rise and rejection
Right Shoulder – weak lower-high formation
The neckline is drawn exactly through the trendline support you have highlighted.
Chart correctly marks 3700 as a high-probability target because:
Major horizontal support from past structure
Confluence of measured move of Head & Shoulders
Matches Fibonacci projection (1.618 extension) of the right-shoulder decline
Strong liquidity zone—big banks accumulate there
Realistic target and technically justified.
6. Immediate Levels to Watch
LevelAction4120 – 4130Breakdown trigger zone (critical)4050First reaction zone3950 – 3920Intermediate support, temporary bounce possible3700Final target (high probability)
7. Trading View (Summary)
Structure: Head & Shoulders top
Trend: Bearish
Trigger: Break of rising trendline
Confirmation: Close below neckline with follow-through
Target: 3700
Invalidation: Close above right shoulder high
Conclusion
As per accurate analysis,
If the neckline breaks, Gold has a clean path toward 3700 with intermediate pullbacks.
Structure, volume, and trendline confluence all support this bearish continuation.
Disclaimer
This analysis is for educational purposes only and not investment advice. Market conditions can change, and risk management is essential.
XAU about to go downXAUUSD is currently developing a valid high-quality harmonic confluence.
This potential reversal zone is further reinforced by multiple structural elements:
Overhead supply zone
A prior bearish order block
Liquidity resting above B, adding inducement
All confluences point to a high-probability bearish reaction if price reaches the D-completion zone.

TIME TO FLY
Time to fly and if you have courage it's best to hold it because this could be the beginning of a higher high on weekly but it had to clear many people out before the real move,
least place for a close should be at 4115-20 but if you want more cash and brave as well then hold it

Seize the opportunity to short sell at high levels.Technically, gold closed last week in a range-bound manner, and short positions once again yielded good profits. Shorting in the 4080-4100 range, focusing on selling at higher levels, offered considerable profit potential. Given the overall bearish structure on the 4-hour chart, the strategy of buying low and selling high within the lower range, relying on strong resistance and support (primarily shorting), was also favorable for those who went long. However, given the overall bearish trend, going long against the trend is generally cautious and should be avoided, especially chasing rallies in the middle. There's not much to say technically; the overall strategy remains to patiently sell on rallies. Intraday, if there's another rebound, shorting in batches within the 4080-4100 range can be considered.

XAUUSD Tapped 4080 Twice!!The price tapped 4080 twice now, We expect another impulsive move down to 4050 which is our Support! Lets catch this drop.

2 area sellThere are 2 areas for us to position the cell with POI support and the one above POI resistance, SL is simply above the nearest resistance

Gold BUYFurther upside for gold , Grey lines are key levels for me waiting for a pullback into the fvg zone for a possible buy

Elliott Wave Analysis XAUUSD – November W4, 2025
1. Momentum
W1 – Weekly timeframe
Weekly momentum is showing early signs of a reversal. If next week forms a confirmed bullish weekly candle, the market may enter 4–5 consecutive bullish weeks, pushing weekly momentum into the overbought zone.
D1 – Daily timeframe
Daily momentum continues to rise, suggesting the market may experience 1–2 more days of upward movement before reaching the overbought region.
H4 – 4-hour timeframe
H4 momentum remains bullish, indicating that Monday is likely to show a continuation of upward movement or sideways consolidation.
________________________________________
2. Elliott Wave Structure
Weekly Structure (W1)
The last three weekly candles are bullish, but not strongly decisive:
• Two candles have short bodies
• One is a bullish candle with an upper wick
This behavior suggests the market is completing wave X (purple). Therefore, the main expectation is a continued decline to complete wave Y (purple) toward the lower target zones. Once wave Y finishes and weekly momentum confirms reversal, a new major bullish trend is likely to begin.
________________________________________
Daily Structure (D1)
• Wave X (purple) is likely complete.
• Price is now progressing within wave Y (purple).
Inside wave Y:
• Wave 1 (red) appears to have finished.
• Price is currently in wave 2 (red) or has already started the early phase of wave 3 (red).
🔸 Key confirmation level:
A break below 4001 would confirm that the market has entered wave 3 (red), leading to a sharp and decisive decline.
🔸 Alternative scenario:
Because D1 momentum is still rising, wave 2 (red) may be forming a WXY corrective pattern (green zigzag), meaning the market may still produce a final upward swing before the next strong decline.
________________________________________
3. H4 Wave Structure
At the moment, there are two scenarios in line with the D1 structure:
• The market may already be in the early phase of wave 3 (red).
• Or price is completing the final leg of the WXY correction of wave 2 (red) (indicated by the green zigzag).
The zone around 4081 currently acts as the balance area, also the region with the highest traded volume (green POC line).
• If price stays below 4081 during Monday, the probability favors wave 3 (red), meaning strong support zones 4020 and 3958 are likely to break.
• If price stays above 4081, upside targets at 4145 and 4184 become ideal levels for completing wave 2 (red).
________________________________________
4. Trading Plan
📌 Preferred Limit Sell Zones:
• 4145
• 4184
📌 Direct Sell Zone:
• 4020 → only valid if a strong H4 candle closes below 4020, followed by a retest.
A more detailed trading plan will be updated on Monday, once fresh market data becomes available.
