XAUUSD: Inverse H&S Points Toward 4270 TargetHi!
Gold has formed a clear Inverse Head & Shoulders structure, signaling a potential bullish reversal. The support zone around the head held strongly, forming the left shoulder, head, and right shoulder in sequence. Price has now broken above the neckline, confirming the pattern and showing renewed bullish momentum.
If price retests the neckline successfully, it can provide a higher-probability long entry. A sustained hold above this level keeps the bullish structure intact, with the measured target projected near 4265–4270 USD.
However, if price dips deeper, the right scenario remains a potential bullish retest, as long as the structure stays above the neckline zone. Only a drop back below the head invalidates the pattern.
Overall, as long as buyers defend the neckline, the market maintains a bullish outlook toward the target zone.
Disclaimer: As part of ThinkMarkets’ Influencer Program, I am sponsored to share and publish their charts in my analysis.
Trade ideas

Gold Bulls Smash Through the Flag PatternGold has climbed sharply, and after that sudden burst of momentum, the market naturally shifted into a cooling phase, forming a descending flag.
This pullback does not reflect weakness; instead, it represents a controlled pause as the market resets after a strong advance.
Sellers are attempting to push prices lower, yet the decline remains shallow. That limited retracement reveals that buyers are still firmly positioned and ready to defend the trend at every dip.
At this stage, price is breaking out of the flag with clear conviction, signaling that bullish strength is returning to the market. The breakout candle, supported by increasing volume, highlights strong market intent and renewed confidence from buyers.
With momentum building again, the next impulsive move is likely to extend toward the 4,300 target.

Gold next move (mild correction is on the cards)(01-12-2025)Go through the analysis carefully and do trade accordingly.
Anup 'BIAS for the day (01-12-2025)
Current price- 4245
"if Price stays below 4263, then next target is 4230, 4216 and 4190 and 4170 and above that 4280, 4300 ".
-POSSIBILITY-1
Wait (as geopolitical situation are worsening )
-POSSIBILITY-2
Wait (as geopolitical situation are worsening)
Best of luck
Never risk more than 1% of principal to follow any position.
Support us by liking and sharing the post.

Gold 30-Min — Volume Sell Reversal Triggered⚡Base : Hanzo Trading Alpha Algorithm
The algorithm calculates volatility displacement vs liquidity recovery, identifying where probability meets imbalance.
It trades only where precision, volume, and manipulation intersect —only logic.
✈️ Technical Reasons
/ Direction — SHORT / Reversal 4215 Area
☄️Bearish rejection confirmed through sharp candle body.
☄️Lower-high forming beneath resistance supply region.
☄️Volume decreasing confirms exhaustion in price rally.
☄️Sellers regained imbalance with heavy top rejection.
☄️Algorithm detects fading demand and shift to control.
⚙️ Hanzo Alpha Trading Protocol
The Alpha Candle defines the day’s real control zone — the first battle of momentum.
From this origin, the Volume Window reveals where the next precision strike begins.
⚙️ Hanzo Volume Window / Map
Window tracked from 10:30 — mapping true market behavior.
POC alignment exposes institutional bias and breakout potential zones.
⚙️ Hanzo Delta Window / Pulse
Delta window monitors real buying vs. selling power behind each move.
Tracks volume aggression to expose who controls the candle — buyers or sellers.
When Delta aligns with Volume Map, momentum becomes undeniable.

Gold Extends Rally Toward New Highs as Fed Cut Bets IncreaseGold Extends Rally Toward New Highs as Fed Cut Bets Increase
We are following gold from 4030 to the current price and the price has already reached our first major target at 4150.
Currently, gold came out of a strong area near 4130. We can also see that Gold wanted to fall again but stopped near 4110.
After the weaker-than-expected US PPI data, the market is expecting a possible rate cut from the FED meeting in December, thus increasing the chances of gold rising further.
Volume is still low but it may increase during the coming days. Gold appears poised to reach 4,230 and 4,290.
Our analysis did not change because there is nothing to change :)
You may find more details in the chart!
Thank you and Good Luck!
❤️PS: Please support with a like or comment if you find this analysis useful for your trading day❤️

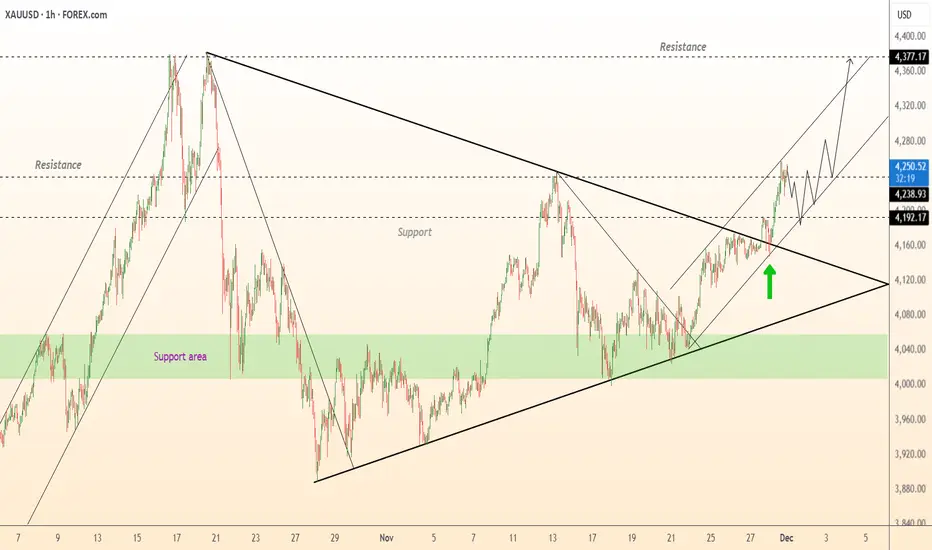
DeGRAM | GOLD will break the $4250 level📊 Technical Analysis
● XAU/USD broke out of a long-term triangle and retested the confluence of trendline support and the 4,190 zone, confirming bullish continuation.
● Price is now moving inside an ascending channel, targeting the 4,300–4,380 resistance region as momentum strengthens after the breakout.
💡 Fundamental Analysis
● Falling U.S. yields and renewed safe-haven demand support further upside in gold as markets price in a softer Fed stance.
✨ Summary
● Bullish bias above 4,190. Targets: 4,300 → 4,377. Key support: 4,190.
-------------------
Share your opinion in the comments and support the idea with a like. Thanks for your support!
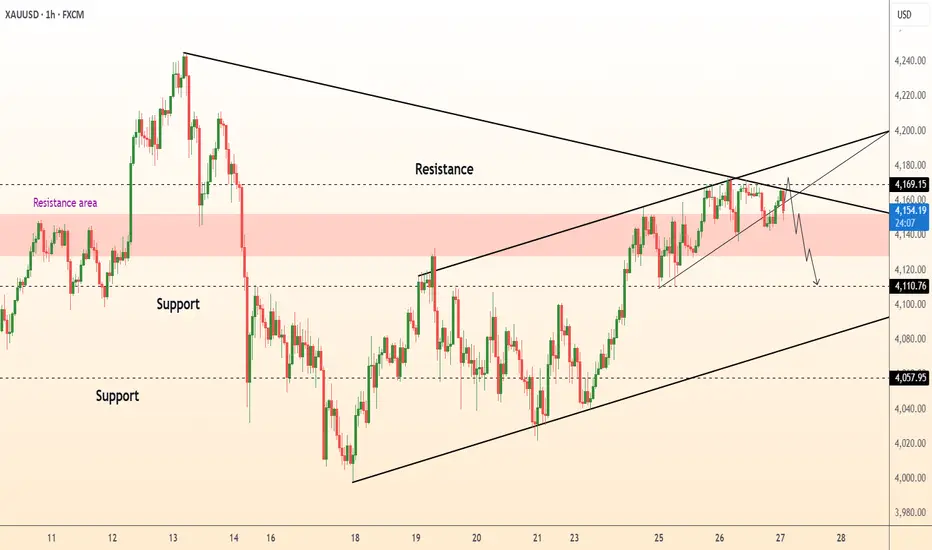
DeGRAM | GOLD is expecting a slight pullback📊 Technical Analysis
● XAU/USD is repeatedly rejecting the descending resistance line and the 4,155–4,170 supply zone, signalling weakening bullish momentum at a key confluence area.
● Failure to hold above the resistance-area retest suggests a likely drop toward 4,110, followed by a deeper move toward 4,058 as the rising structure loses strength.
💡 Fundamental Analysis
● Gold is softening as U.S. yields stabilize and risk appetite improves, reducing short-term safe-haven demand.
✨ Summary
● Bearish bias below 4,170. Targets: 4,110 → 4,058. Resistance: 4,170.
-------------------
Share your opinion in the comments and support the idea with a like. Thanks for your support!
GOLD attempting to regain bullish momentumGold continues to consolidate while respecting the ascending channel structure. After rising to 4220, price retraced back toward support amid expectations of potential monetary easing from the Federal Reserve. This pullback brought gold into the key support zone between 4190–4180, where buyers have shown renewed interest.
Currently, price is attempting to regain bullish momentum. As long as gold maintains support above this 4190–4180 area, the broader bullish structure remains intact.
If buyers continue to defend this zone, gold may develop fresh upward momentum and retest the upper boundary of the channel. Under sustained support and renewed demand, the next upside targets are projected at: 4252 to 4300,
You may find more details in the chart,
Trade wisely best of luck buddies.
Ps; Support with like and comments for better analysis thanks for supporting.

Gold 1H – 4262 Sweep Drop or 4188 Hold the Floor?🟡 XAUUSD – Intraday Smart Money Plan | by Ryan_TitanTrader (03/12)
📈 Market Context
Gold is trading into policy-driven liquidity engineering as former White House adviser Kevin Hassett gains renewed spotlight after public commentary from former U.S. President Donald Trump referencing potential Federal Reserve leadership influence. Expect sharp liquidity sweeps both sides before institutions commit.
Technically, H1 price coils between premium and discount extremes, and the next leg unlocks only after MSS (CHoCH) + BOS + displacement validation.
🔎 Technical Framework – Smart Money Structure (1H)
Current phase = liquidity-rich compression at H1 extremes
Liquidity zones & key triggers
• 🔴 SELL GOLD 4265 – 4267 | SL 4275
Institutional idea: sweep above premium → bearish MSS + valid BOS down → FVG/OB retest → delivery into discount.
• 🟢 BUY GOLD 4186 – 4184 | SL 4176
Institutional idea: sweep below discount → bullish MSS + BOS up → FVG/OB retest → demand expansion.
• 🟡 Equilibrium / Chop: no trading unless structure proves intent.
Expected sequence = Sweep → MSS/CHoCH → BOS → Displacement → Retest → Expansion
🎯 Execution Rules (unchanged methodology, matching your zones)
🔴 SELL GOLD 4265 – 4267 | SL 4275
Rules:
✔ Price taps 4266 zone → bearish MSS/CHoCH (M5–M15)
✔ Confirm clean bearish BOS down with displacement
✔ Enter on FVG fill or OB retest after displacement
Targets:
1. 4245 – 4240
2. 4225 – 4215
3. 4186 – 4184
🟢 BUY GOLD 4186 – 4184 | SL 4176
Rules:
✔ Price sweeps 4185 → bullish MSS/CHoCH + BOS up
✔ Confirm displacement away from discount
✔ Enter on wick rejection + FVG fill or OB retest confirmation
Targets:
1. 4215
2. 4240
3. 4265+
⚠️ Risk Notes
• Both sweeps = traps until BOS + displacement proves intent.
• No averaging inside compression.
• SL = structure invalidation only.
• Reduce lot size during volatility spikes from headline risk.
📍 Summary
Two institutional routes today:
• 4266 sweep → bearish MSS/BOS → retest → delivery into 4185
or
• 4185 sweep → bullish MSS/BOS → retest → expansion into new 4266+
Trade the structure. Let price narrate intent. Patience = edge.
📌 Follow @Ryan_TitanTrader for daily Smart Money breakdowns.

XAU/USD Bullish Setup Developing Toward 4226 and 4257The XAUUSD chart shows price stabilizing after a corrective move within the descending channel, with buyers defending the highlighted support zone. Candles are attempting to build momentum above the Ichimoku cloud, indicating early signs of a potential bullish shift. The structure suggests that if price maintains support near the 4200–4205 region, upside continuation becomes likely. A break and hold above the minor consolidation area could open the way for a progressive move toward the first target at 4226. Sustained strength above this level may attract further buying interest, driving price toward the second target at 4255. Overall, the market is showing signs of recovery as long as support remains intact.
If you found this XAUUSD analysis helpful, don’t forget to LIKE 👍 and COMMENT 💬!

XAUUSD / GOLDGold highlighting a potential bullish continuation setup after a period of consolidation.
Over the past several sessions, price has broken out of a descending trendline, transitioning from a bearish phase into a more constructive, upward-leaning structure. Following the breakout, Gold has consistently respected a newly formed ascending trendline, which now acts as dynamic support.
Multiple horizontal demand zones (grey areas) can be seen beneath the current price, showing where buyers previously stepped in. Price retraced into one of these demand zones and bounced, suggesting ongoing buying interest. After reclaiming this zone, Gold has been forming higher lows, signalling growing bullish momentum.
The chart also displays a projected bullish path, where price may experience a small pullback into the ascending trendline before making another upward impulse. Two clearly marked TARGET zones above the current price indicate potential take-profit areas if bullish momentum continues. These targets align with previous supply zones where price has reacted strongly in the past.
The green shaded region represents the buying area and profit zone, showing the anticipated move toward the upper resistance zone around 4,225. The red region underneath marks the risk zone (stop-loss area), highlighting the level where the bullish setup would be invalidated if price falls below it.
Overall, the chart communicates a structured and disciplined bullish setup:
✔ A breakout from the downtrend
✔ Support formed at an ascending trendline
✔ Demand zones holding
✔ Bullish targets identified ahead
This provides traders with a clear framework of how price may behave if the trend continues upward while also defining the risk in case the market reverses.
If you find it helpful please like and comments for this post and share thanks.

Fib Analysis - Bullish Trendbased on previous analysis with Fib. This is the idea i have for the current trend on XAU USD. Also based on potential news later on in the day in the US. I can see this being very bullish

XAUUSD–Volume Profile buy scenario around 4,200, target 4,265+XAUUSD–Volume Profile buy scenario around 4,200, target 4,265+
Brian – Prioritize buying with the trend, use VAL to position entry
Market snapshot
At the end of the US session yesterday, gold had a strong increase and then stabilized, currently moving sideways around 4,216 on H1.
The structure is still an uptrend, the current decline is mainly a technical correction within the value area.
On the chart, the 4,264–4,265 area is marked as important resistance, where if broken, the medium-term uptrend could be unleashed more strongly.
Volume Profile & key price areas
The VAL (Value Area Low) of the Volume Profile is currently around 4,200 – this is an area where the market has previously accepted a large volume of trades, suitable for trend-following buys.
A deeper support area is around 4,164 (Supportsides on the chart), where buyers have previously intervened very clearly.
Above: 4,265 – confirmed resistance, if broken will strengthen the scenario of gold heading to higher price areas, matching the "super cycle 5,000 USD" story in the long term.
Trading plan for next week (according to H1 & Volume Profile)
Priority scenario – Buy at VAL with the trend
Buying area: around 4,200 (VAL of Volume Profile).
Can flexibly range 4,198–4,203 depending on spread and market conditions.
Idea: wait for the price to pull back to the VAL area, observe H1 candle reactions (long lower tail, rejection candles...) before entering the order.
Immediate targets:
TP1: area 4,240–4,245
TP2: 4,265 – important resistance marked as "important resistance, confirming medium term increase".
If the price closes clearly above 4,265 and successfully retests, consider holding part of the position or finding additional entry points, according to the scenario of expanding to higher areas in the new cycle.
Defensive scenario – Deep support
If the 4,200 area does not hold, the 4,164 area will be the next support to watch.
Closing H1/D1 below 4,164 will be a signal to reduce short-term expectations and wait for a new structure instead of trying to "buy every dip".
Fundamental context – Reasons gold is still supported
Gold is heading for its best growth year since 1979, with an increase of over 60% in 2025 – this is the context of a true bull market, not just a recovery wave.
YTD performance of XAU outperforms BTC, showing that large capital flows prioritize stability and gold's safe haven role.
Current supporting factors: US bond yields cooling, USD weakening.
Geopolitical tensions escalating, Russia–US negotiations have not brought clear breakthroughs.
The market prices in nearly a 90% chance of the Fed cutting rates at the next meeting, making non-yielding assets like gold more attractive.
Follow Brian to share the Gold scenario together

Lingrid | GOLD Complex Correction Short SetupOANDA:XAUUSD is testing the 4,150 resistance zone, where price might form a potential fake break. The move stalled right at confluence between the red long-term resistance trendline and the ceiling of the range, signaling possible buyer exhaustion. Price is now slipping back beneath the broken breakout level, suggesting that momentum is shifting back in favor of sellers as intraday structure loses strength.
If bearish pressure continues, TVC:GOLD is positioned to rotate toward 4,095, with the broader correction where the next liquidity cluster sits. As long as price remains capped under 4,160, the downside scenario remains dominant, especially with markets awaiting key USD-driven macro catalysts (PPI) that could strengthen the dollar and weigh further on gold.
➡️ Primary scenario: rejection holds → drop toward 4,095.
⚠️ Risk scenario: a clean breakout above channel flips momentum and opens room toward higher levels.
If this idea resonates with you or you have your own opinion, traders, hit the comments. I’m excited to read your thoughts!

BUY SIGNAL Trend trade setupAccording to the 4hr/1hr chart TF: Gold is in a BULLISH MODE
On 1hr chart we encounter a shallow correcting and the mini sellers are done.
BULLS are to resume with the trend.
This is my 1st attempt long.
Will be holding till price reaches the recent high on daily TF or till momentum begin to fade.
Trade is ACTIVE!
Eventually Trading
Undefeated!
#gold #buy #anesuralph #xauusd #daytrader #trendcontinuation #signal

Gold Price Holding Near Range SupportGold is moving sideways near a key support zone after breaking its short-term trendline. If the price stays below the mid-range area, the chart suggests potential pressure toward the lower support zone. This idea highlights important levels without providing any trade signals.

Gold Chart Analysis XAUUSD (15m) Breakout, Support & Resistance📊 Chart Analysis – XAUUSD (15m) Breakout, Support & Resistance
1️⃣ Support Zone (Pink Area)
The shaded pink box marks a strong support zone where price has previously bounced multiple times.
Notice how candles wick into this zone, showing buying pressure each time price dips here.
This is the level where buyers stepped in earlier and created the last bullish push.
Meaning:
If price returns to this zone again, it may act as a re-entry area for buyers, unless it breaks cleanly with strong volume.
2️⃣ Resistance Zone (Green Area)
The green box shows a clear resistance area where price was rejected.
The last attempt to break above this zone failed, creating a sharp drop afterward.
Sellers are clearly active here.
Meaning:
Price needs a clean breakout and hold above this zone to continue bullish momentum.
3️⃣ Current Move – Pullback Toward Support
After hitting resistance, price sharply sold off.
Volume increased during the drop, showing strong seller reaction.
Your green arrow projection suggests a bullish pullback setup:
Price dips into/near support
Buyers react
Then price climbs back toward resistance
This is a classic pullback-to-support → retest → breakout scenario.
4️⃣ Breakout Trade Logic
A breakout trade above resistance would look like:
✔️ Price bounces from support
✔️ Price builds higher lows
✔️ Price pushes into resistance with momentum
✔️ Breaks above the green zone
✔️ Holds above (retest confirmation)
This would signal a clean bullish continuation.
Summary
Support zone (pink): Where buyers likely defend.
Resistance zone (green): Where sellers reject price.
Current action: Price pulling back after rejection.
Trade idea: Wait for price reaction at support, the look for a move back toward resistance and potential breakout.

GOLD more likely Sceanrio LongGold is showing strength and is most likley that price will pullback from this support to again all time high price. THese ar the the two support from where price may pullback.

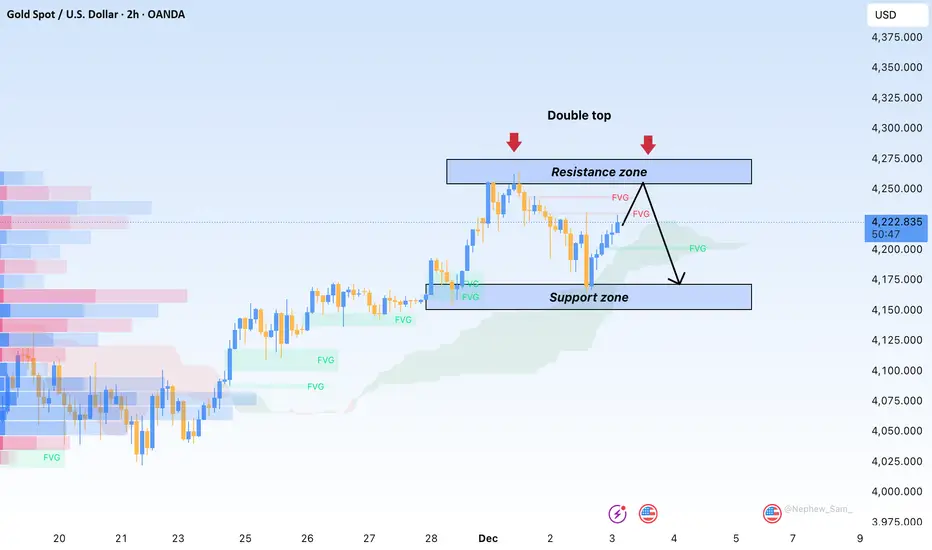
Gold Surges Strongly but Fails to Maintain MomentumHello everyone, the recent movement of gold reflects a market heavily influenced by “news-driven support overshadowed by selling pressure.” XAUUSD made an impressive breakout to 4,237 USD/ounce — the highest level in six weeks — as safe-haven flows returned on geopolitical tensions and expectations that the Fed will continue its rate-cut cycle. But only hours later, profit-taking rushed in, sending gold down more than 30 USD and pulling the metal back to the 4,207 USD region this morning.
This weakness mainly stems from improving risk sentiment: US equities rebounded, with the S&P 500 turning green and the Nasdaq pushing higher as tech stocks led the move. Japanese markets also stabilised as bonds cooled, reducing demand for safety. And with the DXY climbing to 99.18, downward pressure on gold became even more evident — a stronger USD rarely favours the precious metal.
From a technical perspective, the 4,180–4,190 FVG zone helped lift price again after the sharp drop, but gold remains capped beneath the upper FVG resistance. The Ichimoku cloud on the 2H timeframe shows price approaching the Kijun–Senkou intersection — an area that historically attracts selling pressure. This keeps the current price action more aligned with a supply retest rather than the beginning of a genuine bullish trend.
In summary, gold is facing an important test. The 4,235–4,245 region remains the key barrier: a breakout could quickly extend momentum toward 4,260–4,285, while another rejection could push XAUUSD back toward 4,190 to collect liquidity before deciding on its next direction.
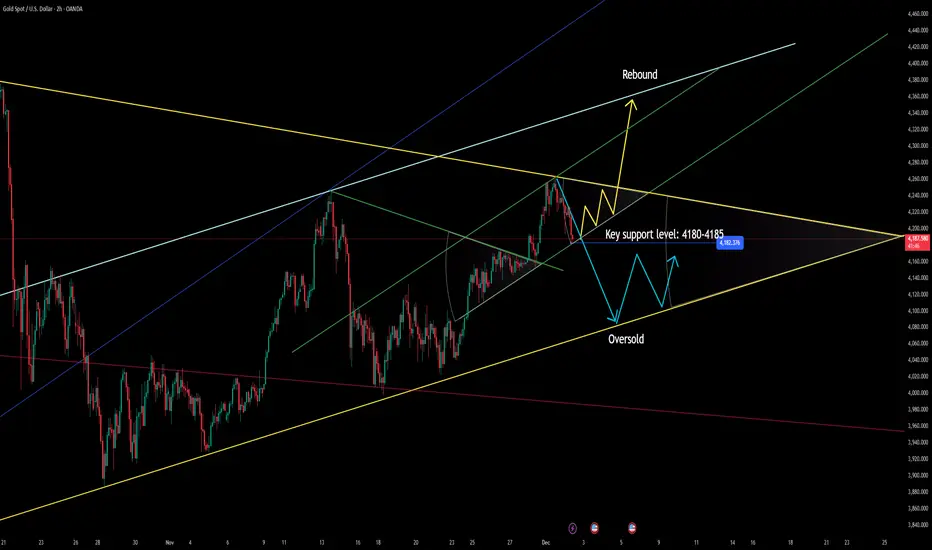
Key Support Levels for Gold Prices: 4180-4185Key Support Levels for Gold Prices: 4180-4185
Currently, gold prices are around $4187 per ounce.
Next Step: Rebound? Or Oversold?
We need to clarify the following points:
1. Last week, gold prices broke upwards near $4180-4185, with $4180 marking the start of an uptrend.
2. If gold prices fall below $4180 today, they may enter oversold territory, potentially falling by more than $100.
3. The price fluctuations within the $4180-4190 range indicate that both bullish and bearish forces have exhausted their strength. Only a significant increase or decrease in trading volume can reveal the true meaning of gold price movements.
4. Upward momentum has largely been exhausted; the market needs new drivers to move forward.
Current Long Strategy:
Buy: 4185-4190
Stop Loss: 4170
Take Profit: 4200-4250
Current Short Strategy:
Sell: 4190-4200
Stop Loss: 4220
Take Profit: 4140-4120-4100-4080
Strategy Summary:
Key Points:
1: Buying at the bottom has a higher cost-effectiveness ratio, while shorting incurs a lower cost-effectiveness ratio.
2: Win Rate: Long 30%; Short 70%
Many people may find this confusing, but it's simply a choice. Technical analysis can only help you determine what's in your favor; it cannot predict future outcomes.
What truly makes you money is whether your trading plan can overcome greed and fear and be strictly executed.
Consistently doing things with a high probability of success will make you money.
As a professional trader, I possess a complete trading system.
This is always a higher-dimensional analysis of human nature and its choices, rather than a technical analysis.
Upward ChannelExpecting to complete wave 5. Watching closely at the very top if will break out or Sell opportunity will be the next move.

Why USD is a forex King !USD continues to show why it’s considered the king of the forex market—its strength sets the tone across major pairs. I’m watching how its momentum influences broader market structure

GOLD Bullish ContinuationGOLD Trading Idea (Based on Up Channel Structure)
Market Structure:
Gold is currently moving inside a clear Up Channel, showing strong bullish momentum. Price has recently bounced from the Demand Zone, confirming buyer interest.
Idea:
If the price pulls back slightly toward the lower boundary of the channel, it may offer a good buying opportunity. As long as the price stays inside the channel, the bullish trend remains valid.
Entry Zone:
👉 Look for buy entries near the demand zone / channel support.
Target:
🎯 Upside target is near the 4,220 – 4,240 zone (as shown on your chart).
Risk Management:
🛑 Place stop-loss below the demand zone to protect against a bearish breakout.
Summary:
Gold is bullish, respecting the up channel. A pullback to channel support could provide a high-probability buy setup toward the upper resistance area.
