GOLD Bullish ContinuationGOLD Trading Idea (Based on Up Channel Structure)
Market Structure:
Gold is currently moving inside a clear Up Channel, showing strong bullish momentum. Price has recently bounced from the Demand Zone, confirming buyer interest.
Idea:
If the price pulls back slightly toward the lower boundary of the channel, it may offer a good buying opportunity. As long as the price stays inside the channel, the bullish trend remains valid.
Entry Zone:
👉 Look for buy entries near the demand zone / channel support.
Target:
🎯 Upside target is near the 4,220 – 4,240 zone (as shown on your chart).
Risk Management:
🛑 Place stop-loss below the demand zone to protect against a bearish breakout.
Summary:
Gold is bullish, respecting the up channel. A pullback to channel support could provide a high-probability buy setup toward the upper resistance area.
Trade ideas

Gold's Final PushGold is clearly bullish, but the liquidity accumulation phase is not yet complete.
In my view, Gold is preparing to break the current Daily High Swing, but this high looks weak because of the recent sweep from the bottom.
The High-Probability Scenario:
Expect the price to sweep the high (a liquidity grab).
Immediate rejection back down to collect continuation Demand that is waiting.
Final structural break to the upside.
My ultimate target is the extreme high at 4300++. I view this as the final wave of this leg, which will likely involve a final, deep sweep down to the absolute swing bottom demand before the most powerful, structurally perfect breakout occurs.
Caveat: If extreme FOMO takes over, this controlled liquidity accumulation phase will be completely invalidated.
If you appreciate detailed, phase-by-phase SMC analysis, hit Like and Follow to track this roadmap with me!

Gold next move (sell continued but it is risky now)(02-12-2025)Go through the analysis carefully and do trade accordingly.
Anup 'BIAS for the day (02-12-2025)
Current price- 4231
"if Price stays below 4242, then next target is 4221, 4200 and 4190 and 4170 and above that 4280, 4300 ".
if price managed to break and close above 4235 on 1H time frame, then we may buy as marked in the chart.
-POSSIBILITY-1
Wait (as geopolitical situation are worsening )
-POSSIBILITY-2
Wait (as geopolitical situation are worsening)
Best of luck
Never risk more than 1% of principal to follow any position.
Support us by liking and sharing the post.

XAU/USD | Gold Holds Strong and Targets Higher Levels!By analyzing the 4 hour chart for TVC:GOLD , we can see that after the bullish move earlier today, price dipped to $4040 but immediately bounced as demand stepped in. Gold is now trading around $4091.
If this momentum continues, I expect a push toward $4100, $4110, and $4130. After that, we’ll monitor the reaction around the levels mentioned in the previous analysis. The overall structure remains bullish as long as demand stays active.
Please support me with your likes and comments to motivate me to share more analysis with you and share your opinion about the possible trend of this chart with me !
Best Regards , Arman Shaban

Hellena | GOLD (4H): LONG to resistance area of 4298.I suggest to consider the lower timeframe (1H), which has some peculiarities.
I see here an upward impulse in the red wave “3”, which is not over yet.
I believe that we should expect the price in the resistance area of 4298.33.
A small correction in the form of continuation of wave "4" to the area of 4174.78 is also possible. But in general, I am set for long positions.
Manage your capital correctly and competently! Only enter trades based on reliable patterns!

Gold prices fluctuated, experiencing repeated oscillations.
Gold prices retreated during Thursday's Asian session, primarily reflecting improved market risk appetite and reduced safe-haven demand amid thin holiday trading. As market expectations for another Fed rate cut in December intensified, coupled with rising hopes for regional peace negotiations, global market sentiment turned optimistic, prompting some funds to flow from gold to risk assets. This week's US economic data was mixed, but overall did not change the market's assessment of the Fed's policy path. Data from the US Commerce Department showed that durable goods orders rose 0.5% in September, a significant slowdown from the previous 3.0%, but still higher than the market forecast of 0.3%. Excluding transportation, orders rose 0.6%, indicating continued resilience within the manufacturing sector. Gold prices retreated slightly after previous gains, mainly influenced by improved market risk appetite and rising expectations for peace negotiations. However, strong expectations of a Fed rate cut in December put pressure on the dollar, continuing to support gold. While various US economic data showed mixed results, they did not shake the market's judgment on a rate cut.
Recent speeches by several Federal Reserve officials have clearly shifted towards a dovish stance. John Williams of the New York Fed stated that if the economy remains as it is, interest rate cuts would not affect the inflation target; while Fed Governor Waller pointed out that the weakness in the labor market is sufficient to support another rate cut. Against this backdrop, the dollar index fell to a one-week low, continuing to be a significant supporting factor for gold. On the other hand, signs of improvement in the atmosphere surrounding regional peace negotiations have further boosted risk appetite. Multiple statements indicate that while negotiations remain far off, external sentiment has improved, thus weakening gold's safe-haven appeal. Overall, gold's fundamentals present a mixed structure of "cooling safe-haven demand + support from interest rate expectations." Short-term fluctuations in gold are more driven by sentiment than by trend reversal signals. From the combined perspective of interest rate expectations, dollar performance, and technical structure, this round of correction is more like a natural adjustment within an upward trend. If subsequent economic data continues to support expectations of rate cuts, then gold still has the potential to resume its upward trend after retracing to key support levels. However, it should be noted that fluctuations in peace negotiation expectations could bring additional volatility. There are no key data releases or events to watch today. The gold market will close two hours early due to Thanksgiving in the US, but this can be disregarded.
Gold Price Analysis:
Gold touched around 4173 in the US session yesterday before falling back. We identified the 4170-75 resistance level yesterday, a key resistance point we've emphasized in the past two days. If this level continues to act as resistance today, the downward momentum may persist. This morning, gold saw a slight pullback to around 4140 before consolidating in a narrow range. This morning's pullback is likely a tentative move; we will continue to monitor the resistance level to see how much further it may fall.
Looking at the four-hour chart, the triangle consolidation pattern for gold remains unchanged. The downward trendline resistance is at 4173-75. Only a decisive break above this trendline will allow for further upward movement and a new opportunity. Otherwise, it will remain in consolidation at the end of the consolidation phase. On the one-hour chart, the price has started to break below the short-term support zone and is now under pressure from the short-term moving averages. There may be some room for adjustment in the short term; we will monitor the short-term correction. Today, continue to focus on the resistance level of the upper trendline of the triangle pattern, which is also the watershed between bulls and bears. If the resistance holds, expect a pullback. Therefore, we still need to try to establish short positions today. If there is a rebound to around 4168-73, we can short. In summary, the short-term trading strategy for gold today is to focus on selling on rallies. The key resistance level to watch in the short term is 4173-4175, and the key support level is 4110-4100. Please keep up with the pace.

GOLD : Bullish ContinuationThere is a strong likelihood that Gold will continue to appreciate following a confirmed breakout above a significant intraday/daily resistance cluster.
We anticipate a move upwards to at least 4300.

Gold 30-Min — Volume Buy & Sell Reversal Triggered⚡Base : Hanzo Trading Alpha Algorithm
The algorithm calculates volatility displacement vs liquidity recovery, identifying where probability meets imbalance.
It trades only where precision, volume, and manipulation intersect —only logic.
✈️ Technical Reasons
/ Direction — LONG / Reversal 4218 Area
☄️Bullish momentum confirmed through strong candle body.
☄️Structure shifted with higher-low near key demand base.
☄️Volume expanding confirms order-flow alignment upward.
☄️Buyers reclaimed imbalance with sustained clean break.
☄️Algorithm detects rising momentum under low liquidity.
✈️ Technical Reasons
/ Direction — SHORT / Reversal 4325 Area
☄️Bearish rejection confirmed through sharp candle body.
☄️Lower-high forming beneath resistance supply region.
☄️Volume decreasing confirms exhaustion in price rally.
☄️Sellers regained imbalance with heavy top rejection.
☄️Algorithm detects fading demand and shift to control.
⚙️ Hanzo Alpha Trading Protocol
The Alpha Candle defines the day’s real control zone — the first battle of momentum.
From this origin, the Volume Window reveals where the next precision strike begins.
⚙️ Hanzo Volume Window / Map
Window tracked from 10:30 — mapping true market behavior.
POC alignment exposes institutional bias and breakout potential zones.
⚙️ Hanzo Delta Window / Pulse
Delta window monitors real buying vs. selling power behind each move.
Tracks volume aggression to expose who controls the candle — buyers or sellers.
When Delta aligns with Volume Map, momentum becomes undeniable.

Most Realistic (Yet Profitable) Trading Strategy Signals in 2026CRAZY RESULTS. Setting up and checking the performance reports of one of the most realistic strategy signals on TradingView.
This is what I personally use on all my trades, newly upgraded and refined with new features.

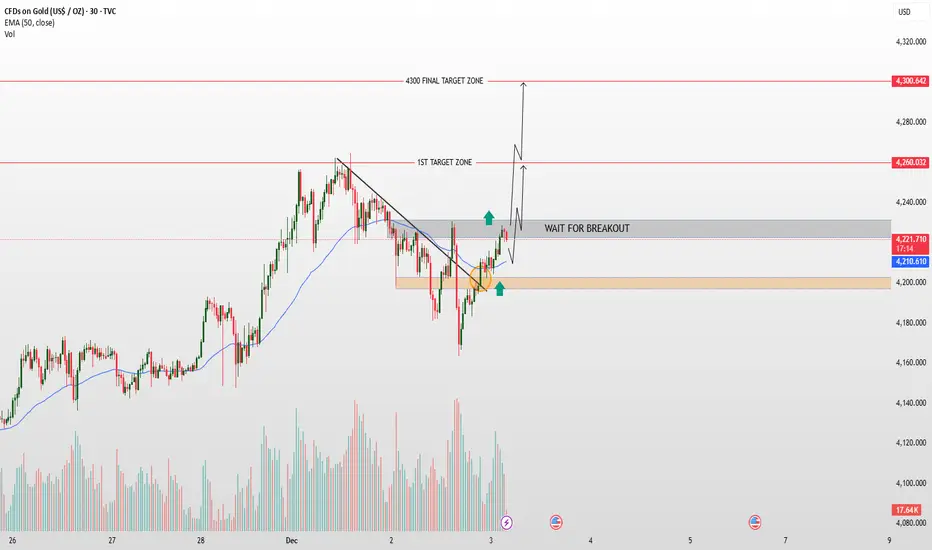
Gold Breakout Alert! Major Move Incoming!Technical Analysis – Gold (30-min Chart)
Price is currently trading just above the broken descending trendline, indicating early signs of bullish momentum. The recent retest of the breakout zone (highlighted area) has held as support, suggesting buyers are defending this level. Price is now approaching the 4,223–4,240 resistance zone, where a clear breakout and confirmation would strengthen bullish continuation toward the 1st target zone around 4,260.
A sustained move above 4,260 may open the path toward the final target at 4,300. However, failure to break the immediate resistance could lead to another retest of the support zone near 4,200.
Bias remains bullish, but confirmation through a clean breakout is key for further upside.
XAUUSD: Imminent reversal, don't miss outThe price of gold continues to rise steadily, driven by strong demand that’s pushing the market higher. However, the price is now facing a significant resistance zone, where sellers have previously intervened with conviction. This zone is critical: if buyers lose momentum here and sellers successfully defend the resistance level, we are likely to see a price decline, triggering a correction.
If this rejection is confirmed, it will be a clear signal that sellers will take control and push prices lower. I expect the price could drop to around 4,130.

XAUUSD Update Breakout Triangle PatternAfter approximately 1 month of consolidation and forming a triangle pattern, the gold price finally broke through the upper area.
It have a big possibility that gold movement have a target to make a new ATH around 4400-4500 level.
Becarefull with a resistance area at 4244 level and 4272 level.
Jump in when the price make a correction ( pullback ).
Have a blessing week ahead !

Gold Reaches Exhaustion Zone — Sell Momentum LoadingGold Reaches Exhaustion Zone — Sell Momentum Loading
Gold is showing signs of upside exhaustion, with price repeatedly failing to gain momentum as it approaches the mid-range premium zone near the 4,245 area. The recent structure reflects a market transitioning from short-term recovery into renewed weakness, with each bullish attempt losing strength faster than the previous one.
Order flow remains dominated by distribution behaviour, and the chart signals a potential liquidity sweep followed by a bearish continuation. The projected rejection zone suggests that buyers are running into an area of heavy supply, where institutional activity has previously triggered aggressive downside extensions. Volume distribution across the range also highlights diminishing demand at higher prices, reinforcing the likelihood of a downward rotation.
As the market continues to respect its broader range ceiling, the probability increases for price to revisit deeper value regions. With momentum fading and the current leg showing hesitation, gold is positioned for a potential sell-side move toward lower mean-reversion levels.

XAUUSD(GOLD): Reaching Our Premium Selling Zone! Get Ready ! Gold is approaching a critical level and we believe this will be a significant move. The $4350-$4400 region has a high volume of sellers, which will be decisive for traders. A price reversal could lead to a substantial decline.
Good luck and trade safe!
Team Setupsfx_
Gold H1 – Will 4212 Hold and Drop to 4160 Today?🟡 XAUUSD – Intraday Smart Money Plan | by Ryan_TitanTrader (27/11)
📈 Market Context
Gold is currently trading within a rising institutional channel after strong H1 displacement. The market is compressing into a liquidity-rich consolidation phase — a classic Smart Money trap environment before engineered expansion.
What Smart Money desks are targeting today:
• Expectation of USD strength shaping bearish bias
• Liquidity sweeps above internal range highs
• Consolidation fakeouts to induce retail mis-positioning
• CHoCH/BOS confirmation required before real directional move
The chart shows equal liquidity zones positioned at premium (sell opportunity) and discount (re-entry buy region).
🔎 Technical Framework – Smart Money Structure (H1)
Current state = Accumulation / Redistribution phase
Liquidity map highlighted zones:
• Premium liquidity zone: 4212 – 4214 (target for short trap)
• Discount liquidity origin zone: 4165 – 4163 (higher timeframe demand re-entry)
• Equilibrium / Chop zone: 4180 – 4195 (no trade unless displaced)
• Trendline support: ~4173 region (must break for downside continuation)
Expected sequence:
Sweep → CHoCH/MSS → BOS → Displacement → Retest (FVG/OB) → Expansion
🎯 Trade Plans for Today
🔴 SELL GOLD 4212 – 4214 | SL 4222
Thesis: Liquidity sweep at premium highs before bearish displacement
Entry activation rules (must wait):
• Price taps 4214 liquidity pocket
• Bearish CHoCH/MSS + BOS down on M5–M15
• Entry taken at FVG fill or order block retest after BOS
Targets:
1. 4200 (first reaction)
2. 4187 – 4185 (BOS retest zone)
3. 4170 (channel mid-equilibrium)
4. 4165 – 4163 (H1 demand retest / profit core)
🟢 BUY GOLD 4165 – 4163 | SL 4143
Thesis: Discount origin tap for impulse continuation buy
Entry activation rules (must wait):
• Price sweeps into 4163 pool
• Bullish CHoCH/MSS + BOS up on M5–M15
• Strong bullish rejection wick + FVG fill confirmation
Targets:
1. 4185 – 4187 reclaim zone
2. 4200+ institutional expansion target
3. 4212+ premium revisit
⚠️ Risk Management
• Avoid trading inside 4180 – 4195 unless displaced
• Do NOT interpret sweeps as trend entries — they are traps
• SL = structure invalidation, no averaging in consolidation
• Reduce size during monetary headlines unless MSS confirms
📝 Summary
Gold is currently in engineered liquidity mode. Expect either:
• Sweep 4214 → MSS/BOS down → drop into 4163 discount retest,
or
• Tap 4163 → bullish MSS/BOS up → expand toward 4200 – 4212+
Today = confirmation-based execution only, not trend chasing.
📍 Follow @Ryan_TitanTrader for daily Smart Money updates.

Gold 30-Min — Volume Sell Reversal Triggered⚡Base : Hanzo Trading Alpha Algorithm
The algorithm calculates volatility displacement vs liquidity recovery, identifying where probability meets imbalance.
It trades only where precision, volume, and manipulation intersect —only logic.
✈️ Technical Reasons
/ Direction — SHORT / Reversal 4215 Area
☄️Bearish rejection confirmed through sharp candle body.
☄️Lower-high forming beneath resistance supply region.
☄️Volume decreasing confirms exhaustion in price rally.
☄️Sellers regained imbalance with heavy top rejection.
☄️Algorithm detects fading demand and shift to control.
⚙️ Hanzo Alpha Trading Protocol
The Alpha Candle defines the day’s real control zone — the first battle of momentum.
From this origin, the Volume Window reveals where the next precision strike begins.
⚙️ Hanzo Volume Window / Map
Window tracked from 10:30 — mapping true market behavior.
POC alignment exposes institutional bias and breakout potential zones.
⚙️ Hanzo Delta Window / Pulse
Delta window monitors real buying vs. selling power behind each move.
Tracks volume aggression to expose who controls the candle — buyers or sellers.
When Delta aligns with Volume Map, momentum becomes undeniable.


Selena | XAUUSD 2H — Bullish Continuation SetupFOREXCOM:XAUUSD
Market Overview
Price has built liquidity through multiple sweeps and consolidations, suggesting a possible continuation phase. If price retests the demand zone and holds, buyers may step in to push toward upper structure resistance levels.
Key Scenarios
✅ Bullish Case 🚀
If price holds above 4,157 zone
→ 🎯 Target 1: 4,300
→ 🎯 Target 2: 4,375–4,400 (major resistance / channel top)
❌ Bearish Case 📉
Break and close below 4,052 invalidation zone
→ 🎯 Downside Target: 4,000–3,950 support range
Current Levels to Watch
Resistance 🔴: 4,300 | 4,375–4,400
Support 🟢: 4,157 | 4,122 (demand zone)
Invalidation ⚠️: 4,052
⚠️ Disclaimer: This analysis is for educational purposes only — not financial advice.

Accumulation and recovery - resistance 4275⭐️GOLDEN INFORMATION:
Gold (XAU/USD) extends Tuesday’s rebound from the $4,164 zone in Wednesday’s Asian session, gaining fresh momentum and edging back toward Monday’s two-week high. The metal remains supported by expectations of another Fed rate cut next week, while speculation about a dovish successor to Chair Powell keeps the US Dollar subdued near a two-week low, further boosting the non-yielding asset
⭐️Personal comments NOVA:
Buying power remains above 4200, gold price recovers and grows. The market is waiting for today's ADP-NF results to continue increasing in price.
⭐️SET UP GOLD PRICE:
🔥SELL GOLD zone: 4275 - 4277 SL 4282
TP1: $4260
TP2: $4245
TP3: $4230
🔥BUY GOLD zone: 4193 - 4191 SL 4186
TP1: $4208
TP2: $4220
TP3: $4235
⭐️Technical analysis:
Based on technical indicators EMA 34, EMA89 and support resistance areas to set up a reasonable BUY order.
⭐️NOTE:
Note: Nova wishes traders to manage their capital well
- take the number of lots that match your capital
- Takeprofit equal to 4-6% of capital account
- Stoplose equal to 2-3% of capital account

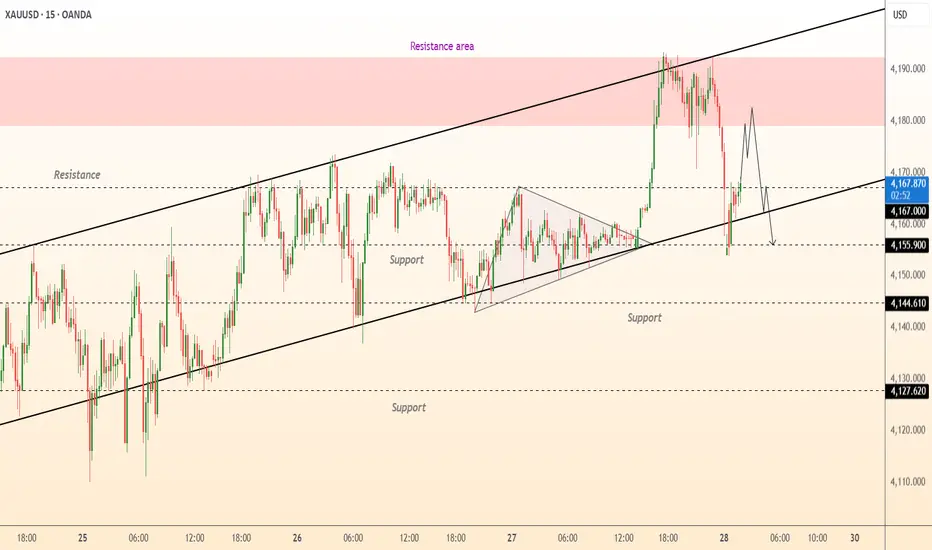
DeGRAM | GOLD is correcting📊 Technical Analysis
● XAU/USD rejected the upper boundary of the ascending channel and the 4,185–4,195 resistance area, producing a sharp bearish reaction and breaking intraday momentum.
● Price is retesting the mid-channel zone, and failure to reclaim 4,175 increases the probability of a drop toward 4,167 and the deeper support at 4,155.
💡 Fundamental Analysis
● Gold is pressured by a mild rebound in U.S. yields after stronger jobless-claims data, limiting short-term upside.
✨ Summary
● Bearish bias below 4,175. Targets: 4,167 → 4,155. Resistance: 4,185.
-------------------
Share your opinion in the comments and support the idea with a like. Thanks for your support!
“Gold Market Structure Update: BOS, CHoCH & Key Levels to Watch”Gold (XAUUSD) is showing a clear market structure transition after forming a strong Double Top followed by a Descending Triangle pattern. Price broke down from the Double Top neckline and later broke out bullish from the Descending Triangle, confirming a shift in trend.
Double Top formation signaling early bearish pressure
Descending Triangle Breakout initiating bullish momentum
Multiple BOS (Break of Structure) and CHoCH confirming trend reversal
Price moved into a clear uptrend, respecting bullish structure
Current rejection area suggests a possible short-term pullback toward the 4160–4120 support range
Watching for reaction at key levels to determine continuation or deeper correction
This setup provides a clean roadmap for both trend-followers and pullback traders.
Not financial advice – for educational purposes only.

XAUUSD : H3 Quick Update , 4200$ Time To Back Fall Gold ??Lets Start Our Journey Of Trading Lets Learn And Grow Together Oky Guys Stay Tuned And Stay With Us
In This Anaylsis We Are Waiting For A Confirmation To Sell Xauusd Down Trend Lets Goo Gold And The Second Setup Is We Are Waiting For Bullish Setup From CISD or ORDER BLOCK to Buy Gold Target Will Same Where We Are Selling Stay Strong Be Patient
Thanks 🙏 Can Comment Your Opinion And Kindly Share This Post As Possible Boost And Follow My Account ✅

Gold - This bullrun is now over!🚨Gold ( TVC:GOLD ) won't create new highs:
🔎Analysis summary:
All the way back in 2019, Gold confirmed its rounding bottom formation. This breakout was then followed by a major rally of about +200% over the past couple of years. But at this moment, Gold is retesting a major resistance trendline and will therefore end its bullrun.
📝Levels to watch:
$4,200
SwingTraderPhil
SwingTrading.Simplified. | Investing.Simplified. | #LONGTERMVISION
