Accumulation and recovery - resistance 4275⭐️GOLDEN INFORMATION:
Gold (XAU/USD) extends Tuesday’s rebound from the $4,164 zone in Wednesday’s Asian session, gaining fresh momentum and edging back toward Monday’s two-week high. The metal remains supported by expectations of another Fed rate cut next week, while speculation about a dovish successor to Chair Powell keeps the US Dollar subdued near a two-week low, further boosting the non-yielding asset
⭐️Personal comments NOVA:
Buying power remains above 4200, gold price recovers and grows. The market is waiting for today's ADP-NF results to continue increasing in price.
⭐️SET UP GOLD PRICE:
🔥SELL GOLD zone: 4275 - 4277 SL 4282
TP1: $4260
TP2: $4245
TP3: $4230
🔥BUY GOLD zone: 4193 - 4191 SL 4186
TP1: $4208
TP2: $4220
TP3: $4235
⭐️Technical analysis:
Based on technical indicators EMA 34, EMA89 and support resistance areas to set up a reasonable BUY order.
⭐️NOTE:
Note: Nova wishes traders to manage their capital well
- take the number of lots that match your capital
- Takeprofit equal to 4-6% of capital account
- Stoplose equal to 2-3% of capital account
Trade ideas

Gold - This bullrun is now over!🚨Gold ( TVC:GOLD ) won't create new highs:
🔎Analysis summary:
All the way back in 2019, Gold confirmed its rounding bottom formation. This breakout was then followed by a major rally of about +200% over the past couple of years. But at this moment, Gold is retesting a major resistance trendline and will therefore end its bullrun.
📝Levels to watch:
$4,200
SwingTraderPhil
SwingTrading.Simplified. | Investing.Simplified. | #LONGTERMVISION

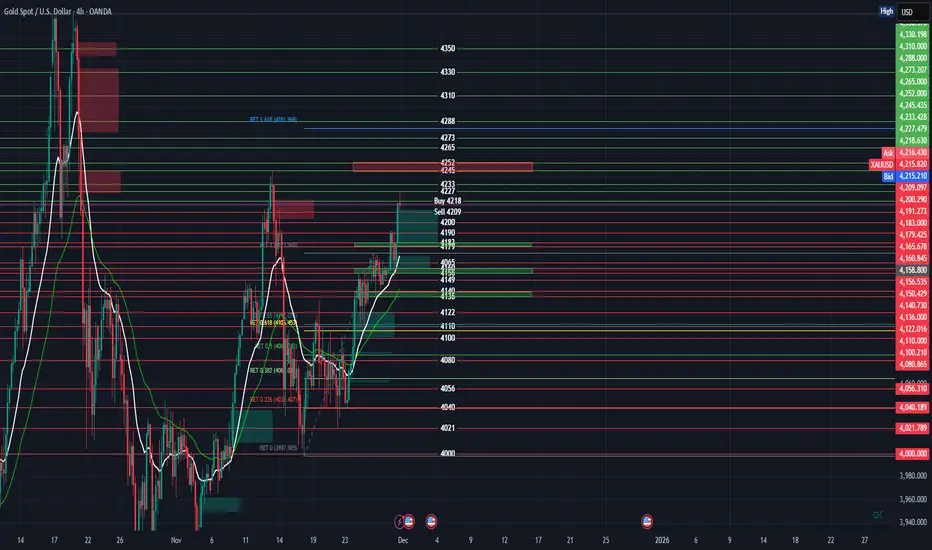
Gold weekly chart (4 hour) with buy and sell entriesChart Overview: XAU/USD 4-Hour
Current Trend: The market is in a corrective phase (bearish pullback) following an aggressive parabolic rally to a high of ~4381.
Momentum: Bearish. The White Moving Average (likely a shorter period, e.g., 20 or 50) has crossed below the Green Moving Average (likely a longer period, e.g., 200), signaling downward momentum.
🔴 Potential Sell Entries (Red Zones)
Major Resistance / Supply Zone: 4245.00 - 4252.00
Technicals: This red shaded box represents a Bearish Order Block (Supply Zone). Price previously broke down from this level with impulsive red candles, leaving trapped buyers. When price retraces to this area, these buyers often sell to break even, and institutional sellers reload shorts.
Secondary Sell signal (Text on chart): The label "Sell 4209" suggests a breakout trade. If price loses the 4209 local support, it confirms a continuation of the lower-low structure.
Suggested Take Profits (TP):
TP 1: 4165 (First Green Zone)
TP 2: 4136 (Second Green Zone)
TP 3: 4105 (0.618 Fibonacci Golden Pocket)
🟢 Potential Buy Entries (Green Zones)
Zone 1: 4160.00 - 4165.00
Technicals: This is the first area of structural support. It aligns with previous consolidation tops before the massive breakout. It acts as a "flip zone" (resistance turned support).
Zone 2: 4136.00 - 4140.00 (Stronger Support)
Technicals: This is a stronger Demand Zone. It sits just above the significant Fibonacci levels. If the correction deepens, this is the area where institutional algorithms often step in to defend the larger uptrend.
Text Signal "Buy 4218": The label "Buy 4218" on your chart suggests a momentum reversal trade—essentially waiting for the price to reclaim the immediate resistance before going long.
Suggested Take Profits (TP):
TP 1: 4210 (Local deviation)
TP 2: 4245 (Testing the bottom of the Red Supply Zone)
TP 3: 4280 (continuation of trend)
Summary Strategy
Short Term: The bias is Bearish as long as price is below the Moving Average crossover. Look for rejections at the 4245 red box to Sell.
Medium Term: Watch for bullish reversal patterns (doji, hammer candles) inside the green 4136 - 4165 zones to catch the next leg up of the macro bull run.
Gold analysis and signalENTRY:4170 TO 4200
SL: 4238
TP: 4011
R/R=2.5
Be successful and profitable.
**Please observe capital management. There is no responsibility for your profit or loss.**

$XAUUSD WEEKLY ANALYSIS BULL READY FOR FLY (READ CAPTION)hello traders! today is 30 November 2025 and here is my New Week Analysis chart please read it and send me your ideas for more analysis.
( OANDA:XAUUSD ) is currently at ($4218) with a 1.37% increase in the last 24 hours.
The bullish trend is intact, with potential for further gains towards ($4240) and beyond.
However, we may see some selling pressure around ($4270). A break above ($4300) could signal a continuation of the bullish trend. And market may be make new higher high. Some analysts expect gold to reach ($4400) in the long term.
If market going downside then we focus our strong support Area ($4165) and market pullback here and take again his bullish track.
Bullish Targets:
Target 1: ($4240)
Supply zone: ($4270)
Resistance zone ($4300)
Support Area: ($4165) ($4147)
Strong Resistance Zone: ($4323) ($4351)
please dont forget like and comment for more XAUUSD latest updates.
This analysis is for informational purposes only. Trade is own your risk.

XAU/USD Bullish trend analysis Read The captionSMC Trading point update
Technical analysis of XAUUSD (Gold) – Bullish Reversal Expectation
Timeframe: 1H
Current Price: ~ 4189
Indicators:
50 EMA (blue) above price → short-term bearish momentum recently
200 EMA (black) touched → strong long-term support
Key Support Zone: 4160 – 4170 area successfully held
Market Structure Insight
Price bounced strongly from the major support zone where liquidity was grabbed below previous lows.
Rejection candle off the 200 EMA + support region indicates buyers stepped in aggressively.
Expected scenario: Market may form a higher low → start bullish continuation.
---
Bullish Forecast Path
The sketched projection shows:
1. Pullback and retest near 50 EMA (4210 zone)
2. Break of structure highs
3. Continuation to targets
Target Levels
Level Purpose
4264 First take profit / previous structure top
4300 Final target / strong resistance
---
Key Confirmation Required
For the bullish plan to stay valid:
Price must hold above 4160 zone
Break and close above 4208–4215 for continuation strength
---
Trade Idea Concept
> Buy from support zone retest or break above 4210
SL: below 4155
TP1: 4264
TP2: 4300
Mr SMC Trading point
---
Overall Idea Summary
Strong bullish rejection from key support
Liquidity sweep + EMA confluence
High potential for reversal continuation
---
Please support boost 🚀 this analysis

Gold Trend AnalysisGold continues to maintain a robust upward structure, with higher highs and higher lows. The recent break above the 4,200 USD level further confirms the bullish trend, indicating that buyers are still firmly controlling the market rhythm. Notably, a series of FVGs (Fair Value Gaps) appear consistently below, showing that proactive buying is absorbing most corrective moves.
1. Technical perspective: Uptrend remains dominant
Gold formed a higher low around 4,120 – 4,140 and broke through the 4,200 barrier, which had held for nearly 10 days. FVGs at 4,165, 4,120 – 4,135, and 4,080 – 4,100 serve as potential retracement zones where the market may revisit to regain bullish momentum. Volume Profile also shows heavy activity around 4,150 – 4,170, suggesting a pause before the next leg upward.
2. Forecast for gold’s next move
The bullish structure remains clear. Therefore, a mild pullback before further ascent is the dominant scenario. From the 4,215 zone, gold may retreat to 4,180 – 4,165 to form a base, then rally towards 4,240 – 4,260. If buying remains strong, further targets could reach 4,300 – 4,320.
An immediate surge is also possible, particularly if the USD weakens or macro news supports it. In such a case, gold could push directly to 4,240 – 4,250, though this type of rally is usually prone to quick profit-taking.
3. News perspective: The market supporting gold
At the US close, gold eased slightly to 4,159 USD/oz—a healthy cooling after a strong rally. Meanwhile, Morgan Stanley continues to target 4,500 USD in 2026, supported by the strongest ETF inflows since 2020, net purchases from central banks, and expectations of lower interest rates—all reinforcing the long-term uptrend.
However, short-term risks remain, such as rising real rates or a USD rebound. These could create pressure, but overall, the trend still favours buyers.

Wave 3 Expansion from Demand Zone SMC + Elliott+Dow Confluence OANDA:XAUUSD Wave 3 Expansion from Demand Zone | SMC + Elliott + Dow Confluence
📌 Recommendation: BUY
Entry: 4151.25
TP1: 4156.00
TP2: 4162.75
TP3: 4174.00
SL: 4144.30
🔍 Insights
📐 Market Structure
Trend: Bullish microstructure forming higher lows above 4144.30.
Supply/Demand Zones:
Demand Zone: 4144.30–4151.25 (liquidity sweep + bullish reaction).
Supply Zone: 4162.75–4174.00 (Fibonacci confluence + prior rejection).
🧠 Smart Money Concepts (SMC)
Liquidity Pools: Sell-side liquidity swept below 4144.30, triggering bullish order block.
Order Block: Confirmed bullish OB at 4144.30–4151.25 with volume spike and RSI recovery.
Volume Profile: High activity near 4155.00 suggests institutional accumulation.
🌊 Elliott Wave Theory
Wave Count:
Wave 1: Impulse from 4133.80 → 4156.00.
Wave 2: Retracement to 4144.30 (approx. 0.618 Fib).
Wave 3: Currently unfolding, targeting 4162.75 and 4174.00.
Corrective Structure: Zigzag ABC into Wave 2 completed.
📈 Dow Theory Confirmation
Higher Highs & Lows: Confirmed with swing low at 4144.30 and swing high at 4156.00.
Accumulation Phase: RSI and MACD support bullish continuation from demand zone.
🛡️ Suggestions
Risk Management:
Fixed SL at 4144.30 (below OB and liquidity sweep).
Risk ≤ 1–2% per trade.
Scaling Strategy:
Partial exit at TP1.
Trail SL to breakeven after TP1 hit.
Use trailing SL below each higher low for TP2 and TP3.
Timeframe Alignment:
Confirm bullish bias on H1/H4 for stronger confluence.
Use M15 for refined entry confirmation (e.g., bullish engulfing, RSI divergence).
⚠️ Disclaimer:This analysis is for educational and informational purposes only. It does not constitute financial advice. Trading involves risk, and past performance is not indicative of future results. Always manage risk appropriately and trade at your own discretion.

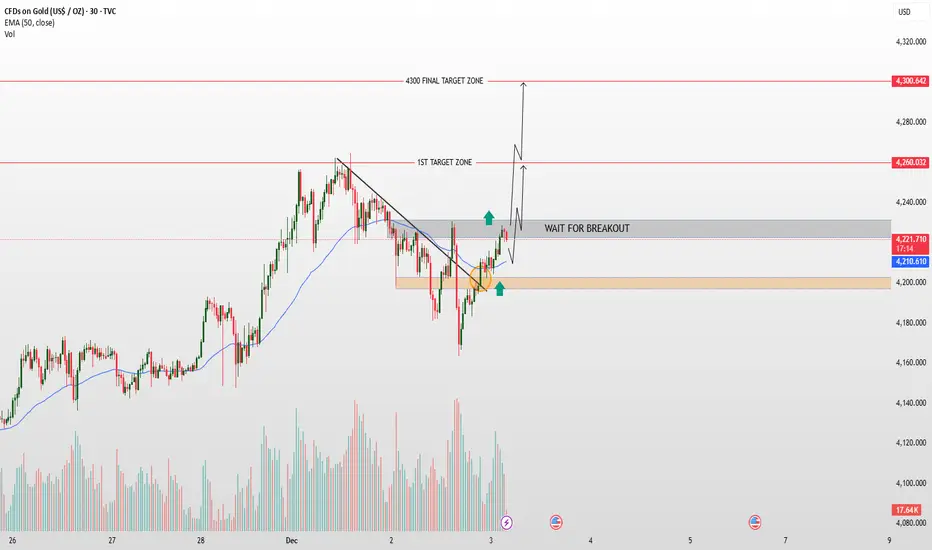
Gold Breakout Alert! Major Move Incoming!Technical Analysis – Gold (30-min Chart)
Price is currently trading just above the broken descending trendline, indicating early signs of bullish momentum. The recent retest of the breakout zone (highlighted area) has held as support, suggesting buyers are defending this level. Price is now approaching the 4,223–4,240 resistance zone, where a clear breakout and confirmation would strengthen bullish continuation toward the 1st target zone around 4,260.
A sustained move above 4,260 may open the path toward the final target at 4,300. However, failure to break the immediate resistance could lead to another retest of the support zone near 4,200.
Bias remains bullish, but confirmation through a clean breakout is key for further upside.
XAUUSD: Buy low and sell high within the 4230-4160 rangeToday is Wednesday, and whether gold can extend its upward move will depend on a key speech as well as the upcoming ADP employment report. With the absence of the NFP release this month, the ADP report has gained additional importance and is expected to exert a stronger-than-usual market impact.
Yesterday, gold broke below the $4,200 level twice but ultimately closed back above it. During the Asian session today, prices attempted another rally, but encountered resistance near $4,230, suggesting technical pressure at that level. Bullish momentum is weakening, and previously elevated sentiment has become more cautious.
Gold’s current two-way volatility is mainly driven by two factors:
The expected Fed rate cut:
Markets believe the upcoming rate cut may be a hawkish cut, which would offer limited support for gold.
The nomination of the next Federal Reserve Chair:
Trump hinted that Kevin Hassett may be the nominee. Given Hassett’s dovish stance and support for rate cuts, his appointment would be positive for gold and U.S. equities.
However, based on today’s market reaction so far, investors appear unconvinced.
If Trump explicitly confirms Hassett as the nominee, gold could receive stronger upside support.
In my view, before the ADP release and any formal confirmation of the next Fed Chair, gold is likely to remain range-bound between $4,230 and $4,160.
Short positions can be considered near the $4,230 resistance zone
Long positions can be considered near the $4,160 support zone
Once gold breaks out of this range, we will formulate a new trading plan accordingly.

GOLD LONG TRADE ANALYSIS:here are key levels. Here are the key support, resistance, and target price levels:
## 📊 Key Price Levels
---
### **Support/Entry Zone**
The analysis suggests an optimal **Entry Zone** which acts as a near-term support level.
*Entry Zone:* Around 4,1180 to 4,175
### Resistance/Target Price Levels
The chart highlights two distinct zones of resistance that are also marked as **Take Profit (TP)** targets.
Resistance 1 / TP1: This is the lower resistance zone, currently around 4,200 to 4,250.
Resistance 2 / TP2: This is the higher, ultimate resistance target zone, currently around 4,360 to 4,400.
### **Pattern**
The price action since late October appears to be moving within an **ascending channel** (indicated by the dashed blue lines), which suggests a bullish bias as long as the price remains within or above the channel's lower boundary. The current price action shows a move up from the lower boundary towards the Resistance 1/TP1 zone.
Would you like me to analyze the volume data shown at the bottom of the chart, or find the current price of Gold (XAU/USD)?

XAUUSD_15M_BuyShort-term Gold Analysis and Scalping
The market is correcting within the corrective triangle and is preparing for the next uptrend wave
Main support 4150


2. December. The bulls corrected before continuing their upward From the 1-hour chart, the key resistance level to watch is 4250-60, while the short-term support level is 4200-05. The key support level is 4190-93. Technically, the market is consolidating and leans towards buying on dips. We patiently wait for key entry points. Specific operational strategies will be continuously updated in this post, so please stay tuned. please follow us closely.
Gold Trading Strategy:
1. Buy gold on a pullback to 4200-05, add to the position on a pullback to 4190-95, stop loss at 4183, target 4255-65, hold if it breaks through.

GOLD Showing Bullish Consolidation OutlookGold has been consolidating, showing a bullish structure despite recent pullbacks. Each drop has been met with strong buying pressure, indicating solid support and continued interest from bulls.
On Tuesday, gold prices eased slightly after touching a one-week high. The U.S. dollar remained firm, and traders are now waiting for delayed U.S. economic data that could influence expectations for future Federal Reserve rate cuts gold remains highly sensitive to key indicators such as inflation and retail sales stronger-than-expected data may delay rate-cut expectations and limit gold’s upside Weaker-than-expected data would support bullish momentum.
Technical Outlook
if Price dipped but quickly retested support and bounced back to the upside, maintaining the bullish structure If buyers continue to hold momentum and break above the 4158 resistance,
the next upside targets are 4165 to 4202
You may find more details in the chart,
Trade wisely best of Luck Buddies.
Ps; Support with like and comments for better analysis Thanks for Supporting.

The Dopamine Trap: Why Traders Overtrade Without Realizing“Most traders aren’t addicted to the market.
They’re addicted to the feeling of being in a trade.”
Every trader says they want consistency…
Yet many still enter trades with no clear setup.
Why?
Because the market activates a psychological loop:
Anticipation → Hope → Stimulus → Relief
Not profit.
Not process.
Just dopamine.
Overtrading isn’t a strategy mistake.
It’s a brain chemistry mistake.
Why Frequent Trading Feels Good
Every click of the buy or sell button releases dopamine.
It gives the illusion of progress.
It convinces you that “activity equals improvement.”
But in reality:
More trades = more randomness
More randomness = more emotional trades
More emotions = more losses
This is why many traders say:
“I do well when I take fewer trades.”
Not because less is magic…
But because clarity increases when noise decreases.
The Hidden Cost
Overtrading causes:
• Impulsive entries
• Improper stop placement
• Revenge trading
• Breaking rules to “stay in the game”
• Anxiety when flat, panic when active
The account damage is visible.
The psychological damage silently compounds.
How to Break the Loop
• Set a maximum number of trades per session.
• Celebrate waiting — not just winning.
• Track emotional triggers in your journal.
• Only execute trades that match your best setups.
• Embrace boredom — it’s a sign of discipline.
When trading becomes boring,
you are finally doing it right.
There’s no dopamine rush in discipline…
but there is freedom.
📘 Shared by @ChartIsMirror
Do you feel the urge to trade just to “stay active”?
Share your reflection — it might help someone break their loop too.

Bullish Analysis 15M-Gold Breakdown – XAU/USD
✨ Clean structure, institutional narrative, and a clear bullish roadmap.
🔹 1. Bearish Liquidity Mitigation (Sell-Side Liquidity)
The market completed its job by sweeping all sell-side liquidity below previous lows 🟠.
This provides the fuel institutions need to build long positions at discount levels. 🔥
🔹 2. Institutional Reversal from the POI
After the liquidity grab, price taps your POI at 4,190 and shows a sharp rejection 🔁.
This is a strong indication of bullish institutional intent. ✔️
🔹 3. Fake Out + Bullish BOS
The fake out was used to trap late sellers ❌ while big players loaded longs.
The following bullish BOS confirms the shift in character and trend direction. 📈
🔹 4. Projected Path Toward Buy-Side Liquidity
Price is now targeting upside liquidity and higher-timeframe inefficiencies. 🎯
🎯 Institutional Targets (TPs)
• TP1 – 4,230: internal liquidity sweep 💧
• TP2 – 4,254: FVG mitigation ⚡
• TP3 – 4,277: continuation of bullish impulse 📊
• TP4 – 4,300: major liquidity grab / expected HH 🏆

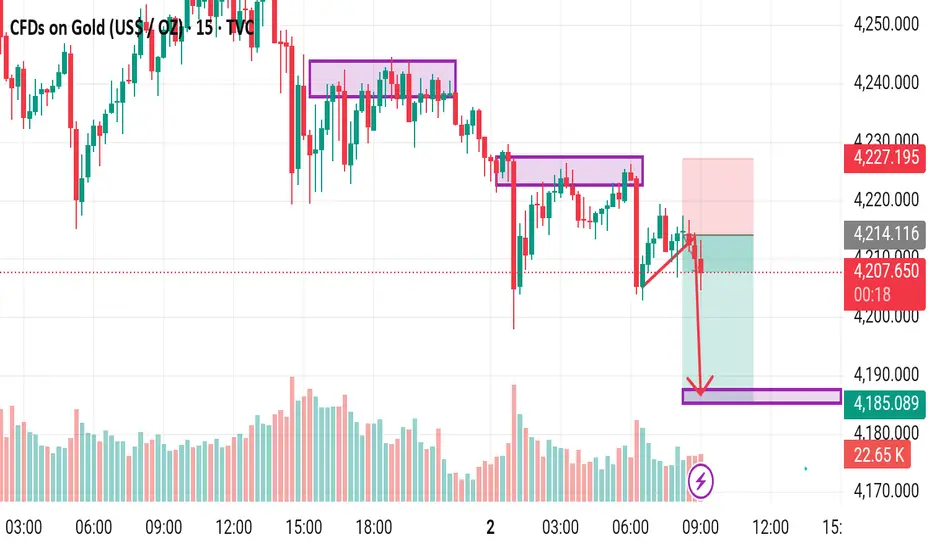
GOLD Intraday Market Structure AnalysisPrice reacted multiple times from the highlighted supply blocks, forming a sequence of lower highs. After a clean rejection within the most recent premium zone, momentum shifted to the downside, guiding price toward the previously identified demand zone near 4185.
Key observations:
• Liquidity sweep occurred before the downside move
• Repeated supply zone rejection confirmed the shift in pressure
• Minor structure broke with clear displacement
• Price is gravitating toward an untested demand area below
This chart highlights how supply–demand rotation, combined with liquidity behavior, shapes intraday directional flow and explains why certain zones act as magnets for price.
Strong bullish movement leading up to the inducement area.Analysis & Key Zones:
1. Inducement High & Bearish Zone:
• The top level is marked as the “zone for Bearish” around 4256.45.
• This is where price might reverse or face selling pressure.
2. Inducement Low & Bullish Zone:
• The bottom level is marked as the “zone for Bullish” around 4206.78.
• This is where buying interest may appear.
3. Inducement Concept:
• The chart highlights a short-term push (inducement) to trap traders.
• The note says: “As long as this inducement doesn’t take the low’s liquidity and doesn’t make a new high, we will wait. Once it takes the liquidity, then we will buy from its low.”
• This indicates a liquidity-based trading strategy, waiting for price to sweep lows before entering a bullish trade.
Trend:
• Potential for either continuation (if liquidity is taken) or a bearish reversal near the top zone.
Overall Summary:
This chart shows a liquidity sweep strategy where traders monitor inducement highs/lows to determine optimal entries. The key action points are:
• Buy from the low after liquidity sweep.
• Watch the top zone for potential bearish reversal.

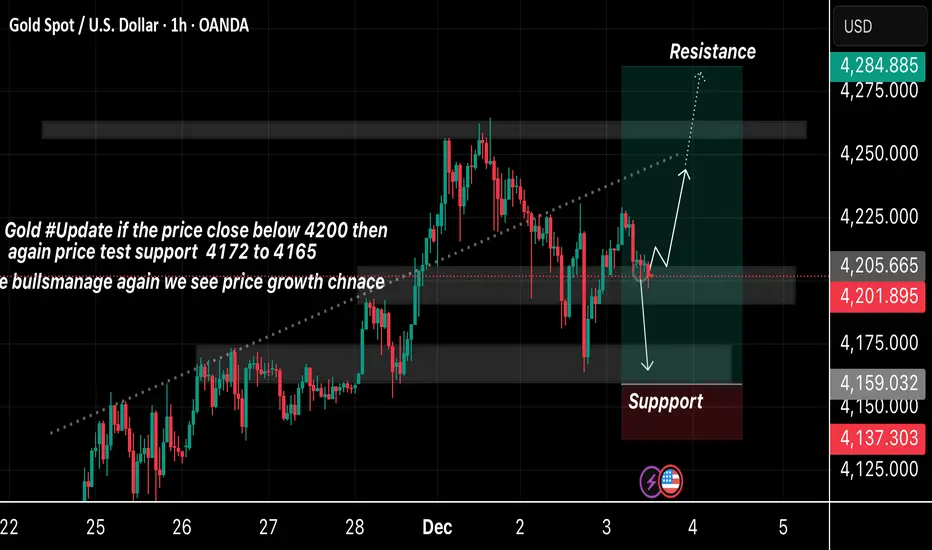
Gold Price Update – Clean & Clear ExplanationGold the market is trading around the 4200 zone, which is an important level.
✅ If the price closes below 4200, it may fall toward the support area between 4172 and 4165.
✅ This zone is highlighted as a strong support, where buyers have previously stepped in
✅ If the support holds and buyers regain control, the price may bounce upward again, giving a new chance for bullish growth
✅ On the upside, the next major resistance area is marked near 4242–4284 where the price could face selling pressure.
Overall, the chart outlines both possible scenarios a drop toward support if 4200 breaks, or a bullish move toward resistance if buyers maintain strength.
If you find it helpful please like and comments for this post and share thanks.
Elite | XAUUSD 15m – Bullish Continuation SetupOANDA:XAUUSD
After sweeping liquidity beneath major support, the market broke downward structure and initiated a bullish correction phase. The breakout above internal range highs and the descending trendline confirms a bullish shift, supported by strong demand rejections. Price is now trading above reclaimed structure and targeting the upper liquidity zone toward $4,256 – $4,260.
Key Scenarios
✅ Bullish Case 🚀
Hold above the re-test demand zone:
🎯 Target 1: $4,230
🎯 Target 2: $4,256 – $4,260 (final liquidity objective)
❌ Bearish Case 📉
Only active if price breaks and closes below $4,210
🎯 Downside Target: $4,170 (previous accumulation level)
Current Levels to Watch
Resistance 🔴: $4,230 / $4,260
Support 🟢: $4,218 / $4,170 / $4,150
⚠️ Disclaimer: This analysis is for educational purposes only. It is not financial advice.

Selena | XAUUSD – 4H | Bullish Continuation Setup 4400$ WaitingFOREXCOM:XAUUSD
Gold continues to build bullish structure after forming accumulation in the previous range zone. The market broke out, retested demand, and maintained higher-lows inside the ascending channel. Current pullback into the Entry Zone (4122–4140) aligns with channel support + demand, suggesting potential continuation toward the upper boundary and major resistance around 4380–4410.
Key Scenarios
✅ Bullish Case 🚀
Hold above demand zone + channel support:
🎯 Target 1: 4320
🎯 Target 2: 4380
🎯 Target 3: 4410 (final top channel line)
Trigger: bullish rejection or bullish engulfing from 4122–4140.
❌ Bearish Case 📉 (Invalidation)
Break and 4H close below 4052 (Invalid zone):
🎯 Downside Target: 3990 → 3920 strong support
Current Levels to Watch
Resistance 🔴: 4320 / 4380 / 4410
Support 🟢: 4140 / 4122 (Entry Zone)
Invalidation: 4052
⚠️ Disclaimer: This analysis is for educational purposes only. Not financial advice.

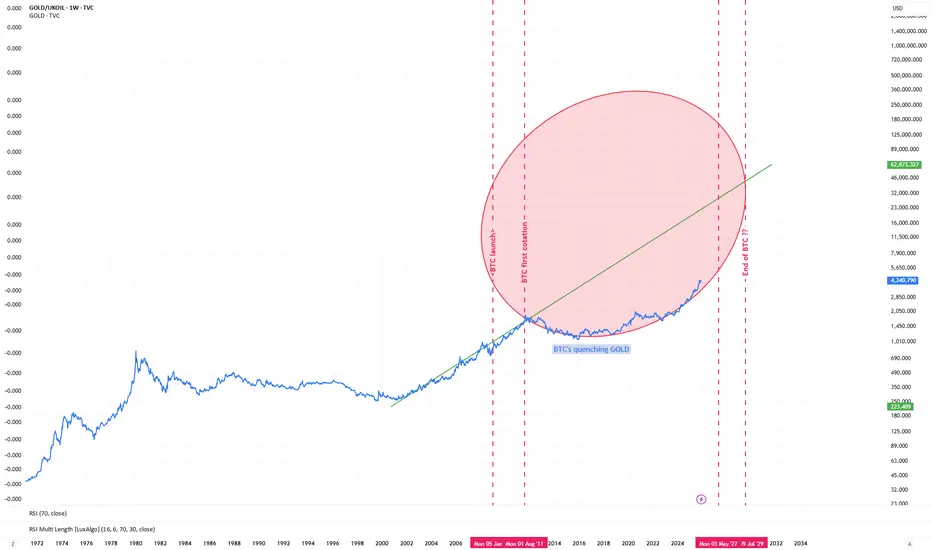
BTC has been lauched just to quench GOLD. After years of fight, GOLD finally won a few months ago.
Paper gold/silver and (real) privacy cryptos are going to pop the banking system.