There are shorting opportunities in gold prices today.There are shorting opportunities in gold prices today.
International gold prices are currently fluctuating around $4,012 per ounce, mainly influenced by both bullish and bearish factors.
On one hand, a stronger dollar and the Federal Reserve's hawkish stance are putting pressure on gold prices; on the other hand, long-term factors such as geopolitical risks and central bank gold purchases are providing support.
---------------------------------------- Key technical levels: Resistance levels: $4030-$4050, $4090-$4110.
A break above these resistance levels could unlock further upside potential.
Support levels: $3950-$3900, $3850-$3820.
A break below these support levels could trigger a larger pullback.
💡 Specific trading strategy:
Currently, gold prices are below the key resistance zone ($4030-$4050), and the short-term trend leans towards consolidation.
If gold prices fail to break through $4,050, consider establishing a small short position with a stop-loss order above $4,070 and a target price around $3,960.
Trade ideas

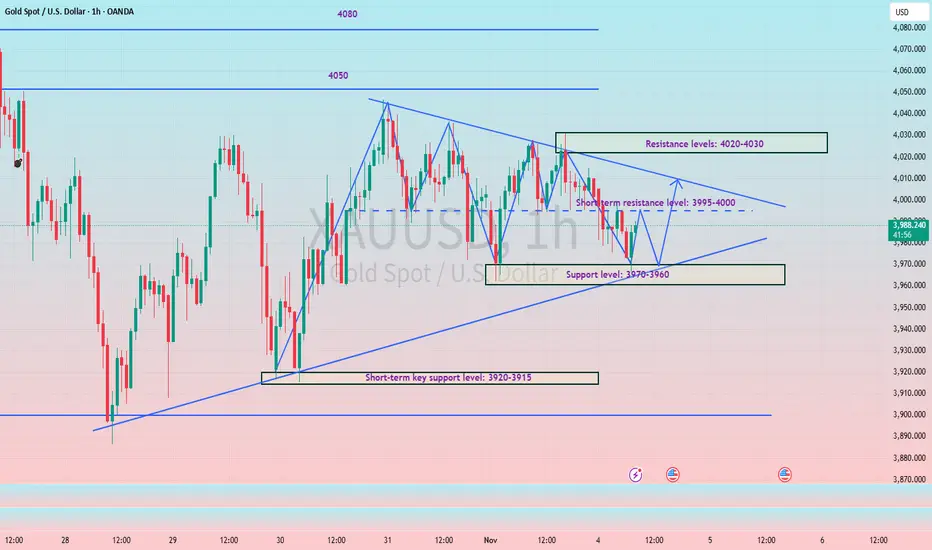
How to keep up with the rhythm of triangle pattern consolidation#XAUUSD OANDA:XAUUSD TVC:GOLD
Gold prices stalled at higher levels yesterday, mainly due to Federal Reserve officials' cautious stance on a December rate cut, which boosted the dollar and dampened enthusiasm for gold's rise. Judging from the current trend, the market is in a converging triangle pattern. The daily MA5 is around 3987, and the MA10 is around 4021. It can be seen that the range between these two points is very small, indicating that the market is also preparing to break out and choose a major direction. Once the gold price breaks out of the triangle pattern and chooses a direction, the daily chart's trendline will widen. Therefore, the key resistance level to watch is 4020-4030, while the key support level is 3970-3960. The European session is expected to trade within a range in the short term. Before a successful breakout, pay attention to the resistance level of the middle band on the hourly and 4-hour charts at 3995-4000. If the price touches the resistance level on the first attempt and fails to break through, a small short position can be considered.
"Gold (XAU/USD) Rebound from Support: Short-Term Bullish Setup"This TradingView chart shows the Gold Spot (XAU/USD) on the 1-hour timeframe. The current price is around $3,993.99, up +1.04%. The chart highlights a potential bullish setup, with a support zone marked in purple around $3,985, and a target zone near $4,015. The blue arrow indicates an expected upward move from the support area toward the resistance zone, suggesting a possible buy opportunity within this range.

Gold New idea for gold, whait for break and re- test
Yesterday idea hit TP and today is retesting the ENTRY POINT one more time, if gold goes down on NY session it will brake the high od tokyo session and probably yesterdays high

XAUUSD:Consolidating with a pending breakoutAfter gold pulled back from the recent high of 4030 yesterday, it received buying interest at the key support level today and entered a short-term consolidation phase. The gold price failed to hold above the psychological 4000 level, showing an overall high-level oscillatory correction.
Yesterday, it rebounded after finding support at 3963, and today it pulled back near 3965 again before recovering, confirming the 3960-3965 range as a strong near-term support zone. The 4015-4020 area is the immediate resistance range, with 4030 acting as a more critical resistance level—having repelled price advances three times yesterday, it can be regarded as the intraday bull-bear dividing line. On the 4-hour chart, gold is constrained by the descending 20-period moving average (around 3996) while receiving support from the ascending 200-period moving average (around 3978). This mixed moving average pattern reflects the current consolidation phase.
In the short term, gold is expected to mainly oscillate between the 3965 support and 4030 resistance today, with a directional breakout requiring a stronger catalyst.
💎Trading Strategy
SELL@4015-4020
TP 3980-3965
SL 4030
BUY@3965-3970
TP 4000-4010
SL 3955

GOLD – When the Market “Whispers” About the Weakness of Buyers1️⃣ Market Structure – When the Bullish Rhythm Slows Down
After a series of CHoCHs and BOSs, the short-term bullish structure has clearly broken. The zone around 4,027 – 4,030 now acts as a Strong High, where smart money likely absorbed most of the buy-side liquidity.
Each retracement has become weaker, forming a sequence of Lower Highs — a classic sign of a distribution phase. The market is currently trading within the premium zone of the current range, where any reaction could be the “last kiss” before a potential drop toward lower demand areas.
2️⃣ Supply & Demand Zones – Footprints of Smart Money
Zooming into price behavior, the Sell Zone 4,010 – 4,015 stands out as a key Bearish Order Block formed after the most recent BOS — a zone Karina is watching closely.
If price retests this area and shows a clear rejection (e.g., bearish engulfing or upper-wick rejection), it could mark the beginning of a smart-money-aligned short setup.
Below, the 3,938 – 3,920 zone remains the untested liquidity pocket — a Weak Low where buy-side positions are likely resting. Smart Money may target this area to complete the distribution cycle before generating a potential accumulation reaction.
3️⃣ Liquidity Context – Silence Often Speaks the Loudest
Above the 4,020 – 4,030 area lies buy-side liquidity — a cluster of stop-loss orders from retail longs. A small liquidity sweep into this region followed by a strong bearish reaction would be a classic SMC pattern: grab liquidity, then move in the true direction.
Once that liquidity is absorbed, price could accelerate toward the 3,938 – 3,920 zone to clear sell-side liquidity, finalizing the redistribution phase.
4️⃣ Trading Scenario – Following the Smart Money Flow
Given the current structure, Karina favors short opportunities if price reacts decisively at the 4,010 – 4,015 zone, confirmed by bearish price action (such as a rejection wick or engulfing pattern).
Entry: 4,012 – 4,015
Stop Loss: 4,030
Take Profit: 3,938 – 3,920
This offers an approximate 1:4 R:R ratio, aligning with a high-probability, structure-based setup. It’s not a trade signal, but rather a perspective — a way to understand how Smart Money moves and leaves its traces.
5️⃣ Conclusion – Patience Is the Quiet Strength of a Trader
The market often speaks through behavior, not noise. Gold is currently in a quiet state — a moment of balance where Smart Money prepares for its next move. For Karina, silence itself can be the strongest signal when you know how to listen.
This analysis reflects Karina’s personal view and is not financial advice.
What do you see in Gold’s current structure? Could this minor push toward 4,015 be the start of a deeper move down? Let’s discuss in the comments 💬.

XAU/USD – Bearish Continuation Outlook (Smart Money Framework)XAU/USD – Bearish Continuation Outlook (Smart Money Framework)
🧭 Market Structure Overview
The major structure is bearish — confirmed by a Market Structure Break (MSB) after the last swing high.
Every bullish move since then is viewed as a retracement into premium price for better short entries.
Smart Money likely accumulating shorts above internal liquidity levels before driving price lower.
🟩 Premium Supply Zones (Sell Areas)
1️⃣ Be-BB (Bearish Breaker Block) → 4,180 – 4,240
💣 Main shorting area
Price expected to tap this level to mitigate sell-side imbalance.
Watch for liquidity grab above 4,060 before reversal.
Confirmation: bearish engulfing or BOS on lower timeframes (LTF).
2️⃣ Be-OB (Bearish Order Block) → 4,260 – 4,320
🚫 Last line of defense for bears
If price reaches here, expect a strong rejection due to trapped buyers and institutional orders.
Perfect “last tap” zone before deep markdown.
🟥 Discount Demand Zones (Targets)
🔻 Primary Demand Zone Area → 3,820 – 3,870
Previous accumulation zone (high-volume node).
Take-profit target for swing shorts.
Potential re-entry area for Smart Money to reload buys later.
🎯 Expected final destination if bearish pressure sustains.
📉 Bearish Scenarios
⚔️ Scenario 1 – Textbook Smart Money Setup
Price retraces to 4,060–4,180 zone (Be-BB).
Liquidity grab above 4,060 (previous high).
Bearish rejection → BOS → Sell continuation.
Targets: 3,939 → 3,870 → 3,820.
💥 Most probable scenario.
⚔️ Scenario 2 – Deep Retracement Then Dump
Bulls push higher into 4,260 (Be-OB).
Liquidity sweep and institutional fill.
Massive rejection → sell-off continuation.
🔥 Deeper pullback = bigger sell move later.

Gold Trade Plan 05/11/2025Dear traders,
Gold is fluctuating within the 3900–4000 range. As long as the 4000 zone is not broken strongly, we expect further correction.
Regards,
Alireza!

Gold (XAU/USD) Sell Opportunity as Stronger U.S. Manufacturing D
The latest ISM Manufacturing PMI came in at 49.4, beating the forecast of 49.1, signaling a modest but meaningful improvement in U.S. manufacturing activity. This better-than-expected data indicates the U.S. economy remains resilient despite global headwinds, which in turn strengthens the U.S. dollar (USD).
As the dollar gains traction, gold (XAU/USD) typically comes under pressure due to their inverse relationship. With the stronger USD outlook, we could see further downside movement in gold in the near term.
Trade Setup:
Instrument: XAU/USD
Bias: Sell
Entry Zone: Near 2,380 – 2,385 (adjust based on intraday resistance)
Take-Profit Targets:
TP1: 2,360
TP2: 2,340
Stop Loss: 2,395 (above recent swing high)
Reasoning:
Stronger-than-expected ISM Manufacturing PMI supports the USD.
Improved U.S. economic sentiment reduces safe-haven demand for gold.
Technical resistance aligns with fundamental USD strength.

GOLD READY TO BUYPROJECTION (BULLISH)📈📉👀🗞️
1. Fill out the IMB @ discount zone.
2. A sweep of EQL
3. A sweep of of SSL
4. A bullish BOS above IDM
5. A sweep of EQH
6. Fill out the IMB @ Premium zone
7. Asweep of BSL

Gold Price Outlook – Trade Setup (XAU/USD)📊 Technical Structure
TVC:GOLD Gold rebounded from the $3,931–3,937 support zone, regaining traction above $3,950. The chart shows potential upside toward the $3,981–3,988 resistance zone, though price is still within a short-term range. If buyers maintain momentum, a break above $3,988 could open the way to $4,000. Conversely, failure to hold above $3,931 may trigger renewed downside pressure.
🎯 Trade Setup
Entry: $3,937 – $3,931 (support retest)
Stop Loss: $3,929
Take Profit: $3,981 – $3,987
Risk-Reward Ratio: ≈ 1 : 5.67
🌐 Macro Background
Gold attracted safe-haven bids after snapping a four-day losing streak. As FXStreet’s Haresh Menghani notes: “The US Dollar drifts lower amid shutdown concerns, lending some support to Gold.” 【FXStreet】
The USD weakened despite the Fed’s hawkish stance, pressured by economic uncertainty from the prolonged U.S. government shutdown.
The Trump–Xi meeting offered a softer equity market tone, reflecting lingering geopolitical caution.
The Fed cut rates by 25 bps as expected, but Chair Powell rejected expectations of another December cut, limiting Gold’s upside.
Traders now await FOMC member speeches for clues on the future rate-cut path.
This combination leaves Gold supported by safe-haven demand but capped by Fed’s hawkish tilt.
🔑 Key Technical Levels
Resistance: $3,981 – $3,988
Support: $3,931 – $3,937
Psychological Level: $4,000
📌 Trade Summary
Gold holds firm above $3,950 with renewed safe-haven flows, but faces resistance near $3,985. A bullish setup favours buying dips into support ($3,931–3,937) with targets at $3,987. Caution is warranted as Fed commentary could inject volatility.
⚠️ Disclaimer
This analysis is for reference only and does not constitute trading advice. Trading involves significant risk, and proper risk management is essential.


The gold price is still in the process of correcting Wave 4The gold price is still in the process of correcting Wave 4, and nothing has changed structurally.
Currently, the price continues to respect the corrective zone we have been monitoring, and the internal waves still support the complex WXY pattern. This tells us one thing:
⏳ The correction is not over.
Once Wave 4 is complete, the real opportunity will begin:
✅ First impulse up → confirms trend resumption
✅ Pullback (Wave 2) → optimal entry point
✅ Wave 3 → highest potential reward 🚀
If the price breaks above the current resistance zone from here, we will monitor the alternative count. However, as long as the structure hasn't confirmed it, we remain patient.
Remember:
Corrections are designed to test patience.
Wave 4 is historically the most complex wave; triangles, flats, and complex structures are common.
Remain disciplined. Let the structure settle. The next leg up will be worth the wait.
Based on my experience and my IDA, the market should sell. My taBased on my experience and my IDA, the market should sell. My target is you can trade according to your own calculations.

Gold /XAUUSD long🎯 Idea Summary:
· Direction: Long
· Instrument: XAUUSD (Spot Gold)
· Primary Timeframe: 4H
· Bias: Bullish (Counter-trend bounce)
📊 Technical Rationale:
· Market Structure: The longer-term trend is still bullish, but price has corrected into a major support zone. Looking for a bounce.
· Key Levels:
· Support: $2315** (Previous Resistance), **$2300 (Major Psychological & Swing Low)
· Resistance: $2340** (Recent Swing High), **$2355 (21 EMA)
· Price Action / Pattern: Price is approaching the $2315 support. Watching for a bullish reversal candle (like a hammer or bullish engulfing) for a confirmation signal.
· Confluence:
· The $2315 level coincides with the 61.8% Fibonacci retracement of the last major up-move.
· RSI is entering oversold territory (<30), suggesting selling pressure may be exhausting.
⚙️ Trade Setup:
· Entry Zone: $2315 - $2320 (On a bullish confirmation candle)
· Stop Loss: $2305 (Just below the key $2300 psychological level and the Fib level)
· Take Profit Targets:
· TP1: $2340 (First resistance, take 50% off)
· TP2: $2350 (21 EMA & next resistance)
· Risk-Reward Ratio: ~1:2.5
💡 Narrative / Fundamental Context:
This is a mean-reversion play within a bull market.The confluence of a major Fibonacci level, prior support, and oversold RSI creates a high-probability zone for a technical bounce. A break below $2300 would signal a much deeper correction is likely.
Disclaimer: This is my personal analysis and not financial advice. Trading commodities like gold carries a high level of risk. Always do your own research (DYOR) and manage your risk appropriately.

$GOLD topped until 2026?TVC:GOLD seems topped, by 105 days cycle 15(weeks) we can await a pullback after left ranslation by gold

FCR Setup - 30 Oct 2025Made this setup for today - 30th Oct. Ended up on winning trade for the day. FCR Setup for this.

XAUUSDGold: The main trend remains up, but after testing the $4,380 level, the price was unable to break above this level and the price declined. We expect this to be a correction, with key support levels at 3,885 and 3,857. If the price can hold above 3,857, there is a high chance that the price will continue to rise.
** Very Risky Trade
🔥Trading futures, forex, CFDs and stocks carries a risk of loss.
Please consider carefully whether such trading is suitable for you.
>>GooD Luck 😊
❤️ Like and subscribe to never miss a new idea!

GOLD Free Signal! Buy!
Hello,Traders!
GOLD Price has tapped into a strong horizontal demand area, showing early signs of bullish rejection. Buyers may aim toward 3,970$ as the next liquidity target.
-------------------
Stop Loss: 3,915$
Take Profit: 3,970$
Entry: 3,940$
Time Frame: 2H
-------------------
Buy!
Comment and subscribe to help us grow!
Check out other forecasts below too!
Disclosure: I am part of Trade Nation's Influencer program and receive a monthly fee for using their TradingView charts in my analysis.

GOLD SELLERS WILL DOMINATE THE MARKET|SHORT
GOLD SIGNAL
Trade Direction: short
Entry Level: 4,027.15
Target Level: 3,890.12
Stop Loss: 4,118.76
RISK PROFILE
Risk level: medium
Suggested risk: 1%
Timeframe: 2h
Disclosure: I am part of Trade Nation's Influencer program and receive a monthly fee for using their TradingView charts in my analysis.
✅LIKE AND COMMENT MY IDEAS✅

Gold 30Min Engaged ( bullish After Break Detected )Status: Active Reversal Protocol
Symbol: Gold
Session: London–New York Overlap (Smart Exit Window)
Bullish After Break 4030
Bias: Bullish & bearish Reversal
☄️ Volume Surge Confirmed — Sellers dominate exhausted highs
☄️ Session Aligned — Smart money exit window open
☄️ Cluster Shield Active — Supply imbalance verified
☄️ Delta Shift Negative — Buyers trapped above
☄️ POC Retest Completed — Liquidity absorbed at resistance
☄️ Structure Break Pending — Bearish bias confirmed

THE KOG REPORTTHE KOG REPORT:
In last week’s KOG Report we said we would be looking at two levels as potential for the long trades and target for the short trades. We ideally wanted price to push upside and complete the long target before turning and then completing the short target. During the early part of the week, we activated short and gave caution on longs only to see the aggressive decline which hit our short target and completed our bias level and red box targets for the week.
All in all, a decent week in Camelot with Excalibur guiding and the EA hitting another full house of completed targets on Gold.
So, what can we expect in the week ahead?
We're pondering on this bearish move and it’s giving us hints of a swing low so for that reason we’ve given the red box bias level at 4095 which will need to break for us to see a continuation of the move. Above there, we have immediate support at 4104 which if held can give us another bounce in the early sessions giving us a move upside into the 4140-50 regions initially.
Above that level there is a level sticking out sitting at 4173 with the extension level 4192 which if targeted is the level to keep an eye on for us. A break above there and it’s likely we will attempt to swing high from a lot higher up which we will need to navigate level to level. But a RIP there would be ideal if it happens with a clean reversal.
On the flip, we do want to see lower pricing on gold as we feel it’s not only needed, but it will give buyers better opportunities to get in for better positioning to carry trades upside into the higher target levels we have active. As we approach the end of the month, it's going to be another whipsaw and we would hope to complete the move, or, we'll most likely see some sideways accumulation leading into the next week.
KOG’s bias for the week:
Bullish above 4095 with the ideal target 4274
Bearish below 4095 with the ideal target 4025
RED BOX TARGETS:
Break above 4115 for 4123, 4125 and 4140 in extension of the move
Break below 4095 for 4080, 4065 and 4050 in extension of the move
Please do support us by hitting the like button, leaving a comment, and giving us a follow. We’ve been doing this for a long time now providing traders with in-depth free analysis on Gold, so your likes and comments are very much appreciated.
As always, trade safe.
KOG

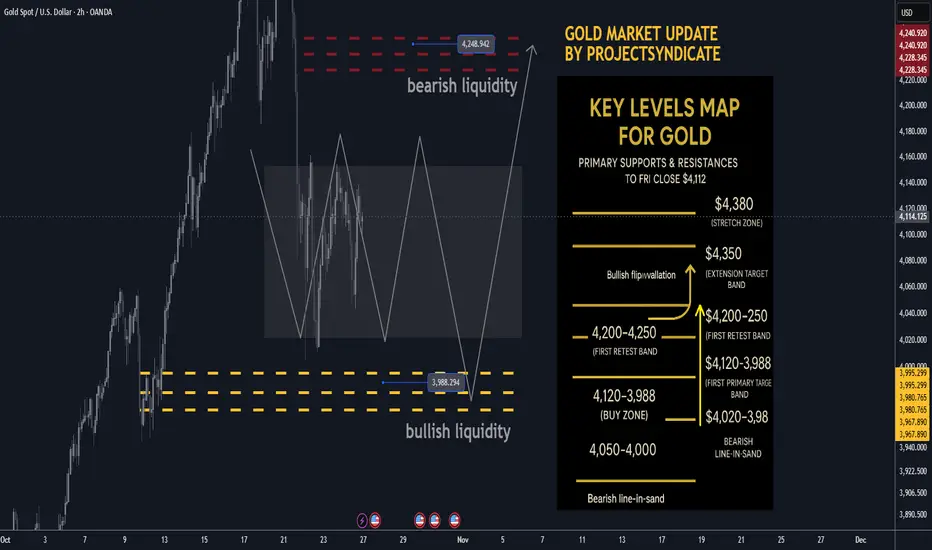
Gold next week Key S/R Levels and Outlook for Traders🔥 GOLD WEEKLY SNAPSHOT — BY PROJECTSYNDICATE
🏆 High/Close: $4,380 → ~$4,112 — lower close within range; momentum cooled but holding the $4,000 handle.
📈 Trend: Uptrend intact > $4,000; oversold into $4.1k—setup favors reflex bounce.
🛡 Supports: $4,120–$4,080 → $4,020–$3,988 (bullish liquidity) → $4,000/3,980 must hold.
🚧 Resistances: $4,200 / $4,250 (bearish liquidity) / $4,300 → stretch $4,350–$4,380.
🧭 Bias next week: Buy-the-dip $4,020–$3,988; momentum regain above $4,200 targets $4,250 → $4,300–$4,350. Invalidation < $3,980 risks a deeper flush to $3,950.
🌍 Macro tailwinds:
• Policy: Easing real yields supportive on dips.
• FX: Softer USD tone = constructive backdrop.
• Flows: Central-bank buying + tactical ETF interest underpin $4k.
• Geopolitics: Trade/tariff & regional tensions keep safety bids alive.
🎯 Street view: Select houses still float $5,000/oz by 2026 on policy easing & reserve-diversification narratives.
________________________________________
🔝 Key Resistance Zones
• $4,200–$4,230 immediate supply from the weekly close
• $4,250 bearish liquidity / primary target
• $4,300–$4,350 extension band
• $4,380 prior spike high / stretch
🛡 Support Zones
• $4,120–$4,080 first retest band below close
• $4,020–$3,988 buy zone (bullish liquidity)
• $4,000 / $3,980 must-hold shelf
________________________________________
⚖️ Base Case Scenario
Expect pullbacks into $4,120–$4,080 and $4,020–$3,988 to attract buyers, rotating price back toward $4,200 then $4,250. Acceptance above $4,250 invites a drive into $4,300–$4,350.
🚀 Breakout Trigger
A sustained push/acceptance > ~$4,250 unlocks $4,300 → $4,350, with room toward $4,380 if momentum persists.
💡 Market Drivers
• Real-yield drift lower (supportive carry backdrop)
• USD softness aiding metals
• Ongoing CB accumulation; ETF flows stabilizing on dips
• Headline risk (trade/geopolitics) sustaining safe-haven demand
🔓 Bull / Bear Trigger Lines
• Bullish above: $4,020–$4,100 (buyers defend pullbacks)
• Bearish below: $3,980 (risk expands; threatens $3,950)
🧭 Strategy
Buy low from bullish liquidity (~$3,988) with a target at $4,250; oversold conditions favor a strong bounce. Add on strength above $4,200 toward $4,300–$4,350. Keep risk tight below $3,980–$4,000 to invalidate.