XAU/USD | Bullish Continuation After 4H Correction (Smart Money)Strategy: Break of Structure (BoS)
The chart shows a clear bullish trend. The price is consistently breaking the previous highs, which confirms the uptrend momentum.
This trade idea is based on a potential pullback to a key level before continuing the upward move.
Trade Parameters:
Direction: Long (Buy)
Entry: $4,203.109
Stop Loss (SL): $4,158.066
Take Profit (TP): $4,451.396
Risk/Reward Ratio: This setup offers an excellent Risk/Reward ratio of approximately 1:5.5.
Disclaimer: This is not financial advice. This analysis is for educational purposes only. Trade at your own risk.
Trade ideas

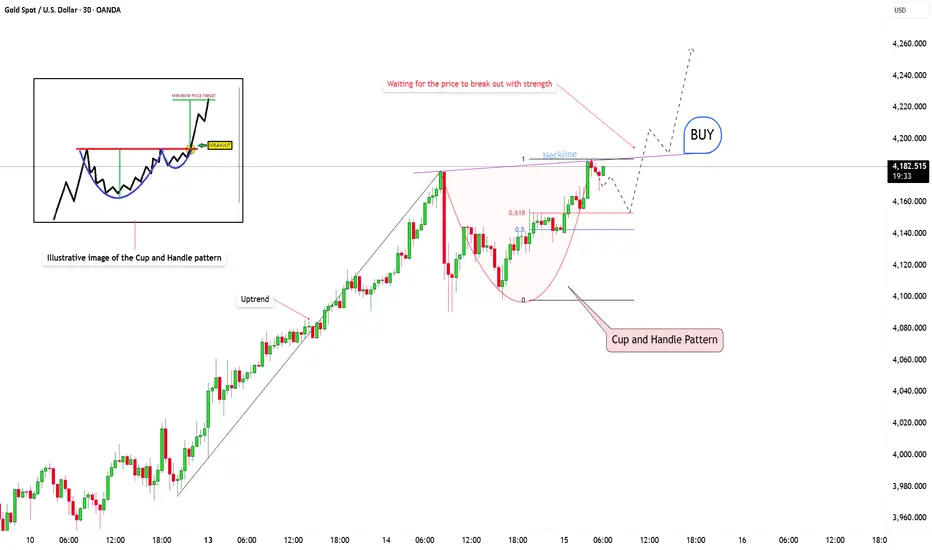
XAUUSD detects the Cup and Handle patternThe market context on XAUUSD is still clearly bullish. The latest movement has shown a stable recovery, pushing towards the expected channel top. But let's pay attention to what happens at this price level.
The price tested it once... and then bounced down.
It’s coming back...
And now, for the third time, we’re waiting for buyers to defend this level again...
This looks a lot like a Cup and Handle pattern, a strong signal that buyers are building significant bullish momentum.
Now, let’s break it down: The real confirmation comes when the price breaks through the neckline, the resistance level connecting the peaks.
That breakout tells us the change is real! Strong and clear.
And right now, the market is consolidating.
This is the Cup and Handle pattern: a continuation pattern signaling an uptrend. When the price breaks out of the handle, it’s the confirmation that buyers are back, and the new bullish trend is starting.
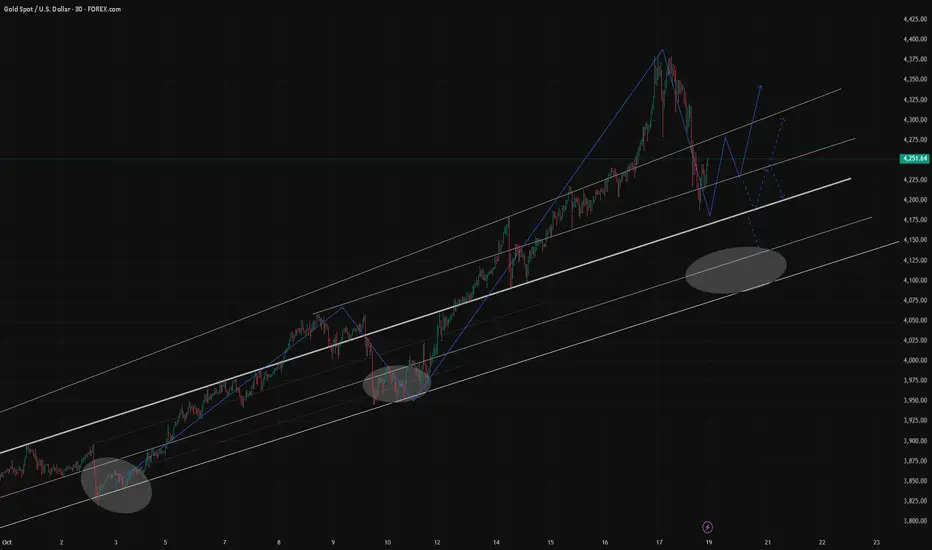
Bull channel forming in gold?It looks like an bull channel is forming in gold, and a breakdown could trigger a drop towards the $3850 support

GOLD sets new record amid global risk waveSpot OANDA:XAUUSD continued to break out in the Asian trading session on Thursday morning (October 16), hitting a record high of $4,239.07/ounce, as investors increasingly sought the precious metal as a safe haven from increasingly complex fluctuations in the global economy.
In the previous session, gold closed at $4,207.85/ounce, up $65.94 (equivalent to 1.59%), and continued to increase by more than $25 today. Since the beginning of the week, gold prices have increased by nearly 5%, continuing a strong upward trend since mid-August.
The rise in gold prices comes as the US Federal Reserve (Fed) signals it will maintain its easy monetary policy path. Speaking this week, Fed Chairman Jerome Powell said the central bank is “on track” to cut its benchmark interest rate by another 0.25% later this month, in response to signs of weakening growth and external uncertainty. Lower borrowing costs typically increase the appeal of non-yielding gold compared to bonds and currencies.
Meanwhile, US President Donald Trump’s latest comments have added to the market’s tension. Responding to a reporter’s question about trade relations with China, Mr. Trump said: “Yes, we are in a trade war right now.”
This statement, quoted by Bloomberg News, has raised concerns about long-term damage to the global economy, a factor that often drives capital flows to safe-haven assets such as gold.
In addition, the risk of a US government shutdown and the “downdraft effect” when investors simultaneously sell bonds and foreign currencies to switch to holding gold and safe-haven assets, further strengthening the precious metal’s price increase.
Strong central bank gold buying has also played a significant role in the rally. Personally, I believe that much of this year’s rally has been “driven by physical demand”, as many central banks “aggressively add to reserves to hedge against sovereign debt risks and expansionary monetary policies”.
So far, gold prices have risen more than 60% in 2025, reflecting a clear shift in global investment thinking, where gold has once again asserted its central role as a source of financial confidence in times of political and monetary uncertainty.
Technical Analysis OANDA:XAUUSD
Spot XAUUUSD continues to maintain a strong uptrend, currently trading around $4,239/ounce, up nearly 0.75% on the day and approaching the 0.618 Fibonacci resistance zone at $4,213 – $4,286, corresponding to the top of the short-term rising channel.
Trend Structure
• The medium-term uptrend remains solid, with a series of steadily rising candles and the MA50 maintaining a strong upward slope, reinforcing the bullish momentum.
• The uptrend channel remains effective, with prices currently hovering at the upper boundary of the channel, indicating that the buying momentum is too strong in the short term.
• The RSI remains above 70, indicating a technically overbought state, but there is no clear reversal signal yet; this usually signals a slight correction before the uptrend continues.
Key Technical Zones
• Resistance: 4.286 (0.786 Fib) and 4.378 (100% extension target).
• Support: 4.162 (0.5 Fib), 4.059 (old confluence – dynamic support), further 3.947 (balance).
Intraday Scenario
• The main trend remains bullish, but the risk of a short-term correction increases as prices approach the Fibonacci resistance zone.
• Day traders can wait for a buyback around $4,160 – $4,180, the confluence between the 0.5 Fib and the midline of the rising channel, where bottom-fishing buying is likely to emerge.
• The short-term target is $4,280 – $4,300/oz, corresponding to the upper boundary of the rising channel.
• Technical stop-loss should be placed below $4,050 (psychological support and short-term MA).
Overview
Speculative money still dominates, but the market is showing signs of needing a “technical breather” to consolidate the new price base. In the context of the Fed easing signals and escalating geopolitical tensions, the main uptrend of gold is not yet threatened, but short-term trading should prioritize the strategy of buying on corrections instead of chasing high prices.
SELL XAUUSD PRICE 4298 - 4296⚡️
↠↠ Stop Loss 4302
→Take Profit 1 4290
↨
→Take Profit 2 4284
BUY XAUUSD PRICE 4144 - 4146⚡️
↠↠ Stop Loss 4140
→Take Profit 1 4152
↨
→Take Profit 2 4158

xauusdShoter term set up, may retest of breaak 4190-4200 area before more down side. Target for first leg 3800 area should see strong bounce. Never know how these corrections will go in terms of pa. But working on persumption of abc rather than triangle, we see.

Gold is about to experience a major collapse!!We have seen a rapid Bullish move on Gold recently and the Bearish phase has just resumed.
From my professional view, i see Gold retracing to around $2600+ (mid term).
I stand to be corrected.

Inverted Head and Shoulders FormingGold has been in a steady downtrend but is now showing signs of a potential bullish reversal.
On the 15-minute chart, an Inverted Head and Shoulders pattern is forming, with increasing volume near the right shoulder — suggesting buyers are starting to take control.
Price is currently testing a key resistance zone around 4,250–4,270, where the neckline sits.
If price breaks and holds above 4,270, it could confirm the reversal and push toward the 4,310–4,320 area.
If it fails to break, a pullback toward 4,190–4,200 support is possible before another attempt higher.
Trading Plan:
Entry: After breakout and close above 4,270
Targets: 4,310 / 4,320
Stop-Loss: Below 4,186 (right shoulder invalidation)
Pattern: Inverted Head and Shoulders
Bias: Bullish on confirmed breakout

How Smart Money Hunts Liquidity on Gold🔶 1. Understanding Liquidity in the Market
Liquidity represents the orders resting above or below obvious price levels — mainly stop-losses and pending orders placed by retail traders.
In simple terms, where you see equal highs, equal lows, or strong swing points, that’s where liquidity pools exist.
On Gold (XAUUSD), because of its volatility, liquidity often accumulates near:
Double tops or double bottoms.
Previous day highs/lows.
Fair value gaps (imbalances).
Psychological round levels like $2300, $2350, $2400, etc.
These zones attract both buyers and sellers — and that’s exactly where Smart Money (institutional traders) aims to act.
🔶 2. What Smart Money Actually Does
Smart Money doesn’t follow retail moves — it creates them.
When price consolidates and retail traders position themselves early, institutions push price beyond these zones to:
Trigger retail stop losses.
Fill their own large institutional orders at better prices.
Remove weak hands from the market.
This process is called a Liquidity Hunt or Stop Hunt.
It’s not manipulation in a malicious sense — it’s simply how large players execute size efficiently in a decentralized market.
🔶 3. The Classic Gold Liquidity Hunt Pattern
Let’s break down a typical Smart Money setup on XAUUSD:
Step 1:
Price builds equal highs (or equal lows) — retail traders see it as a breakout zone.
Step 2:
Institutions push price slightly beyond that area, creating a false breakout.
Stop-losses of early traders are triggered — this is the liquidity grab.
Step 3:
Immediately after the sweep, structure shifts (Change of Character / CHoCH).
This confirms that Smart Money has completed its collection phase and is now ready to move price in the intended direction.
Step 4:
Price often retraces back into the order block or fair value gap left behind by displacement.
This is where the high-probability entry lies — the Smart Money entry point.
🔶 4. Why Gold (XAUUSD) Shows This So Clearly
Gold is one of the most liquid and manipulated markets on the planet — ideal for studying Smart Money behavior.
Because it trades heavily during London and New York sessions, liquidity is constantly generated and removed.
This is why you’ll frequently see:
Sudden spikes before major sessions open.
Sharp sweeps before news events (CPI, NFP, FOMC).
Rapid reversals after stop-hunts.
Institutions use gold as a liquidity engine, often hunting both sides of the market before the real move.
🔶 5. How to Identify a Real Liquidity Hunt (Checklist)
Use this professional checklist to train your eye:
✅ Look for equal highs/lows forming before the move.
✅ Wait for a stop-hunt candle — a long wick piercing liquidity zone.
✅ Confirm a market structure shift (MSS or CHoCH) in lower timeframe.
✅ Entry only after displacement and a clean retracement into an order block.
Avoid reacting emotionally to every breakout — Smart Money uses time + patience to trick impulsive traders.
🔶 6. Practical Educational Example
Suppose Gold forms equal highs at $2380 during the London session.
Many retail traders place buy stops above $2380 expecting a breakout.
Institutions see that as a liquidity pool.
Price suddenly spikes to $2385, sweeps those buy stops, and then drops to $2360 — that’s your liquidity hunt.
Once the structure shifts bearish after the sweep, Smart Money has filled sell orders at a premium — and the downtrend resumes.
🔶 7. Educational Takeaway
Smart Money doesn’t predict — it reacts to liquidity.
By understanding where traders are trapped, you align your trades with institutional flow instead of retail emotion.
📘 Key Principles:
Trade after the liquidity grab, not before.
Always wait for confirmation through structure shift.
Focus on zones of interest, not random breakouts.
Observe timing — most liquidity hunts occur during session opens or high-impact news.
💬 Final Note:
Every chart tells a story — but only those who understand liquidity can read the true language of price.
Study it, practice it, and you’ll see how Smart Money creates opportunity through manipulation and order flow.
📘 Follow me for more professional educational content on Smart Money, Liquidity, and Gold market behavior.
Gold- Possible Scenarios for the Short termWe just witnessed a fall of 4.5% in Gold.
Will it sustain the fall or was it a buying opportunity again?
Let's analyze from short term technical perspective.
What Price Action Says?
Gold took support near 4278 zone after a sharp fall of 100 points from the top.
It bounced and retested the highs, then pulled back to 4278 zone and finally broke this support with another (almost) 100 points fall.
This fall was contained near a previous breakout zone of 4180 and since then the price has been oscillating in a range.
What volumes say?
Some distribution can be seen near the previous support zone of 4278 which may now act as resistance.
Basics- Everyon who bought near support saw the price going down and coming back near their cost. They must be unloading at breakeven. Also retest sellers would come to the picture who missed the last 100 points breakdown and were waiting for a retest opportunity to short.
Bullish Scenarios
Actually, there could be two-
1. Price goes deep into resistance, traps more buyers and then a sharp fall near previous low 4185
2. A straight fall to 4185
Both these moves could be aimed at grabbing liquidity below 4219 and 4212 and then move sharply back above 4280
Bearish Scenario
A fall which sustains below 4185, leading to a larger pullback. Will discuss about it when it happens.
What is your stance at this point?
Are you still interested in buying or do you think it is the end of the rally?
Do comment and boost for more such ideas.

$GOLD Rally Pause – Will the Golden Fib Hold?TVC:GOLD has seen a strong rally after months of accumulation, but the recent sharp pullback looks like a healthy correction rather than a trend reversal.
Currently, price is approaching the Golden Fib Zone (0.5–0.618), an area that often acts as a strong support during ongoing uptrends. If the price manages to hold this zone and form a solid base, we could see the next leg higher, potentially leading to new highs.
For now, the focus remains on how price reacts at this Fib zone, a bounce here could confirm continuation, while a breakdown below may signal a deeper correction.
DYOR, NFA
THANKS FOR THE READING

Gold is trending, focusing on the 4300-4320 range.On Tuesday, the early Asian session began to confirm resistance at 4375-4372, before rebounding and finding resistance at 4355. From here, a sweeping decline began, with the final acceleration occurring at 4344. We had already entered a short position in the 4340-4337 area. The price then experienced a $100 decline, accelerating to the 4244 area.
The price fell from 4375 to 4244, marking another significant decline, and the European session saw a sharp drop of nearly $100.
Watch the following trends in the short term:
The dual-line channel corresponds to 4260, then 4295-44300, and finally 4302. The price broke below the upper limit of the 1-hour chart at 4268. After confirming support at 4220 in the European session on Monday, the price began to rise. However, it has currently broken down. If the US market continues to experience resistance, there is room for further decline in the short term.
The first resistance area is 4280-4285, and the second resistance area is around 4300-4320. If the price breaks above 4325, pause shorting and wait for resistance to enter.
The price just rebounded to around 4278, but is now under pressure below 4280 and continuing to decline. In the short term, monitor the rebound's strength and wait for the next resistance level before considering shorting.
The support level is around 4245, followed by 4225.
I will post more real-time strategies in the channel, so stay tuned.

Gold Bulls Still in ControlTVC:GOLD price recently swept the previous swing high around the $4,380 level, triggering a rejection as buy-side liquidity was taken. After this liquidity grab, the market attempted to extend its upward momentum but failed to break decisively above that level, resulting in the formation of a bearish order block between $4,367 and $4,372. This area has since acted as a short-term supply zone, driving price lower and guiding it back toward the bullish order block at $4,341 – $4,346 highlighted in green.
Upon retesting this demand zone, gold swept the sell-side liquidity resting beneath recent lows; however, the candle body managed to close above the zone, implying that bullish pressure remains intact despite the temporary downward movement. This reaction suggests that institutional participants may still be defending long positions within this zone, potentially accumulating orders before initiating the next upward leg.
Considering this overall market structure, price action continues to favour a bullish outlook. If the green order block holds as support, there is a strong likelihood of another impulsive move to the upside, targeting liquidity above the $4,380 – $4,400 region.

Gold 4H Technical & Geo-Political Outlook“Gold is trading around $4,254. Key support lies at $4,220–4,230, while resistance is at $4,260–4,270. A break above $4,270 could signal a short-term bullish move, while a drop below $4,220 may lead to further decline toward $4,170–4,180. Geopolitical tensions and USD movements remain critical drivers. Traders should watch global news for potential triggers.

Gold end points!?After a long journey i think we now need a rest Gold appears to be at a potential turning point where short positions may be closing and prices could move higher

10.15 Wednesday Gold Trading Strategy:
I. Core Fundamental Drivers
Monetary Policy Support
Fed Chair Powell signaled a 25-basis-point interest rate cut in October, with market expectations of a cumulative 50-basis-point cut within the year. This lowers the opportunity cost of holding gold and boosts gold prices.
Geopolitical Risks Escalate
Middle East Situation: The Gaza ceasefire agreement faces obstacles, Israel takes new actions, and regional tensions persist.
Russia-Ukraine Conflict: Ukraine attacks oil facilities in Crimea, with the U.S. accused of involvement in planning, escalating the risk of confrontation.
U.S. Government Shutdown: The shutdown has lasted for several days, raising concerns about economic stability and debt issues.
Safe-Haven Demand Strengthens
The U.S. may suspend edible oil trade with Asian countries, fueling concerns about global trade friction and enhancing gold's appeal as a safe-haven asset.
Capital Flow Support
Global central banks (e.g., the People's Bank of China has increased holdings for 11 consecutive months) and SPDR Gold ETF holdings continue to rise, providing long-term buying support.
II. Overall Market Outlook
Dual-Driven Trend: Safe-haven demand (geopolitical conflicts, shutdown, trade friction) and expectations of monetary policy easing jointly drive gold prices higher.
Technical Warning: The current RSI is overbought (>80), with sharp intraday fluctuations (e.g., a $90 pullback yesterday followed by a quick rebound). Caution is needed against technical corrections triggered by sudden news.
III. Key Price Levels
Resistance Zone
$4180-4190 (initial resistance)
$4200 (psychological barrier)
$4230-4250 (strong resistance)
Support Zone
$4150-4160 (initial intraday support)
$4120-4130 (strong support for pullbacks)
$4080-4100 (key trend support)
IV. Specific Trading Strategies
Primary Strategy: Buy on Pullbacks (Trend Following)
Entry Timing: Staggered positions when gold prices pull back to the $4150-4160 range.
Stop-Loss Setting: Below $4140 (to prevent false breakouts).
Targets:
First target: $4180 (partial profit-taking);
If broken, aim for $4200 and above.
Secondary Strategy: Short at Resistance (Counter-Trend Play)
Entry Condition: Gold prices first touch $4190-4200 and show clear signs of pressure (e.g., long upper wicks, weakening minute charts).
Stop-Loss Setting: Strictly above $4200.
Target: Look for a pullback to around $4150 (quick in-and-out).
V. Risk Warnings
Sensitive News Period: Focus on speeches by Fed officials, geopolitical developments, and sudden trade policy news, which may trigger instant volatility.
Technical Overbought: RSI is at high levels, guard against technical corrections of $50-80, and exercise caution in position management.
Discipline Execution: Avoid chasing rallies or selling off, set strict stop-losses to prevent sudden reversal risks.
Summary: Intraday strategy primarily focuses on buying on pullbacks, building positions near the $4150-4160 support. If prices rally to the $4190-4200 resistance zone with weakening momentum, light short positions can be considered. Closely monitor the alignment of fundamental events and technical signals, and adjust strategies flexibly.

16/10/68 : XAUUSD ( US Session )Using it from US Session until 11.00AM , I'll new analysis and update at 12.00PM
Resistance
4260-4265
4250-4255
4245
Support
4234
4223-4229
4213-4218

Mission Complete: 4245-4250:Time to Flip Short on Gold!Gold has already reached a high of around 4246, and its upward momentum has relatively weakened. To be honest, under the current market conditions, I do not advocate aggressively chasing gold above 4240, because as gold continues to rise, more and more callback risks are accumulated! We can also see that each surge in gold is followed by a clear pullback. So even if we choose to short gold, we can still get a good profit margin in the short term!
Although gold is on an overall upward trend, I still divide the rising channel into three areas; the first area: 4250-4220; the second area: 4220-4190, and the third area: 4190-4160. As gold rises, the technical traction of the lower area on the gold price becomes stronger. Therefore, according to the first area division, in the short term, gold has the need to at least retreat to the area near 4220. Even after falling below the area near 4220, it may continue the downward trend to the 4220-4190 area.
Therefore, in terms of short-term trading, I would prioritize trying to short gold in the 4245-4255 area, first targeting the short-term retracement area: 4230-4220 as the target.
If you’re following my trading strategy, don’t just watch — prepare your next move.
💬 Like & Follow for real-time updates and in-depth gold insights.
📈 Follow me for real-time gold insights &to my traders' channel for exclusive setups in bio!

Gold Setup You Can’t IgnoreHey everyone, Erik here !
Gold is quietly preparing for its next move. After a strong rally, price didn’t collapse as many expected. Instead, it’s been building a smooth accumulation structure — the classic Cup and Handle that often signals continuation in a healthy uptrend.
This setup tells a deeper story about market psychology. Sellers are running out of strength, while buyers keep absorbing every pullback with patience and confidence. Momentum is quietly shifting, and pressure beneath the surface is growing.
If a clean breakout confirms this formation, gold could enter its next bullish leg. A move toward 4500 looks not just possible, but reasonable based on the current market structure.
Until that confirmation comes, patience remains the key. Waiting for a clear breakout with strong volume helps filter out false signals and keeps you aligned with the dominant trend.

Indicator Trading vs Price Action TradingIn the world of trading, most people start with Indicator Trading , but only those who truly understand the market eventually evolve into Price Action Trading.
These two approaches aren’t enemies — they’re actually two stages in the mindset evolution of a professional trader.
1. Indicator Trading – When You Trade the “Consequences” of Price
Indicators are tools built from historical data.
They measure strength, momentum, and direction of price movements.
For example:
RSI tells you whether the market is overbought or oversold. EMA reflects the average trend. MACD shows the momentum behind the move.
However, the core weakness of indicators lies in their lag.
By the time you see a buy signal, the price has already moved.
If you rely solely on indicators, you’ll always be reacting to the market instead of leading it.
💡 Indicator trading gives you structure and discipline — but sometimes that same structure makes you miss the real rhythm of the market.
2. Price Action Trading – When You Trade the “Story” Behind Price
Price Action requires no indicators.
It teaches you to read the emotions of the market through every candle, every price zone, and every false break.
Here, the market is no longer a series of numbers — it’s a story between buyers and sellers.
When you start to understand:
Why price forms higher lows — showing buyers gaining control.
Why a long wick appears — showing weaker players trying to fight back.
Why a “liquidity grab” happens — showing how smart money traps retail traders.
That’s when you no longer need signals — because you’ve learned to speak the language of price itself.
Price Action teaches you not just to trade with your eyes, but with your mind.
3. The True Essence – It’s Not About Choosing a Side, But Choosing a Perspective
A professional trader doesn’t “hate” indicators nor “worship” price action.
They understand one simple truth:
Indicators are the map — Price Action is the terrain.
A map gives you direction.
But if you only stare at the map without observing the terrain, you’ll fall off a cliff.
And if you only look at the ground without knowing where you’re headed, you’ll get lost.

Clear rebound for Gold 1 hour chartAfter a good retracement in fib zone, clear rebound inside the support/resistance zone with good retracement on this same one later, what do you think?

Gold Weekly Review — Historic Volatility & Next Week’s Key LevelThis week, gold experienced a historic level of volatility, a truly remarkable movement that left many traders astonished.
During the session, prices tested the 4200–4180 support zone for the first time. The nearly $200 decline effectively released the heavy selling pressure that had been building up in recent days, while also creating new opportunities for bullish entries.
As expected, once prices entered the support region, they rebounded strongly, closing above 4250 with a recovery of nearly $70 (all of which I had clearly indicated in advance).
From the 30-minute chart, the candlestick structure still suggests further upside potential. However, given the weekend uncertainty, any unexpected bearish news could trigger a pullback when markets reopen on Monday.
If no major negative developments occur, bullish momentum may continue to drive gold higher. Resistance is likely to be concentrated around the 4280–4300 zone — once price enters this region, both short-term buyers and trapped long positions may start adjusting their holdings, which could increase the likelihood of a short-term correction.
On the 4-hour chart, this nearly $500 rally has just completed its first test of the MA30 support. The MA5 (near 4270) currently acts as the key resistance, followed by MA10 (around 4292).
If during consolidation, the price can hold above MA20 (around 4246), it will likely attract renewed buying interest, potentially driving prices back toward 4380 or even higher.
Conversely, if prices remain under pressure and fail to stay above the MA20, attention should shift to the MA30 support. A break below this level could open the way to a test of the MA60(near 4100).
Therefore, for next week’s trading, these levels will be our key focus points.
As I mentioned earlier this week, the medium-term long positions have been closed, and we will wait for new opportunities to emerge. If the market drops toward 4100 or even lower, I will consider re-entering long positions from those lower levels.
A friendly reminder — always align your trading strategy with your own risk tolerance and financial situation. Medium-term setups require patience and strong risk-bearing capacity. If your current condition doesn’t allow for that, please avoid blind following to prevent unnecessary losses.
Lastly, note that gold still has two unfilled gaps around 4019–4024 and 3887–3898. If the trend turns bearish, these gaps may present potential trading opportunities.
That’s all for today.
We’ll discuss specific intraday trading opportunities when the market opens.
If you have any questions or need guidance, feel free to leave me a message.
Gold Selling Plan!!Yesterday gold went wild and dropped almost 3k pips. This is crazy and it signals a few heavy selling sessions ahead. Therefore, I will look for selling opportunities from 4195. My first target is 4042. Ultimate target for today is 3905.

XAUUSD Case Study | Head & Shoulders to Inverted RecoveryDate: 18th October 2025
By: Yogiraj Trading Academy 🌕
🧭 Market Overview
In the recent price action of XAUUSD (Gold Spot), the market formed a perfect Head & Shoulders pattern on the top, leading to a breakdown and a strong correction phase. The move validated our earlier resistance zones and respected every marked level with precision — a clear reflection of technical structure working in harmony with psychology.
⚔️ Phase 1 – Distribution (Head & Shoulders Breakdown)
The Head & Shoulders pattern signaled exhaustion near the 4,321–4,380 zone, followed by a decisive neckline break confirming the bearish structure. Once the neckline was breached, the market continued to slide downward with clean momentum, fulfilling the measured move target zones.
🌅 Phase 2 – Accumulation (Inverted Head & Shoulders)
Post the sharp decline, the market found strong buying interest near 4,185–4,200, forming an Inverted Head & Shoulders pattern — a mirror image of the previous top structure. This hinted at potential trend reversal or continuation of the larger bullish trend once confirmation levels are reclaimed.
📈 Key Levels to Watch
Breakout Zone: 4,323 & 4,380
→ Sustained breakout above these levels will confirm trend continuation.
Immediate Support: 4,225 / 4,185
→ Loss of these levels could weaken reversal momentum.
Upside Target Zone: 4,444+
🧘 Trading Psychology Insight
Notice how both emotion and structure played their roles — panic selling near the neckline, followed by accumulation when fear was at its peak.
Markets reward discipline, patience, and conviction — exactly what Yogiraj Trading Academy stands for.
Always remember:
“Charts tell stories — only a calm mind can read them clearly.”
⚠️ Disclaimer
This is a case study for educational purposes.
Trade at your own risk with proper risk management and confirmation from higher timeframes.
🚩 Yogiraj Trading Academy
Where Knowledge Meets Dharma — Transforming Trading from Chaos to Consciousness
#YogirajTradingAcademy #XAUUSD #GoldAnalysis #TechnicalAnalysis #HeadAndShoulders #TradingPsychology #Discipline #PriceAction
