Gold 30-Min — Volume Buy & Sell Reversals Triggered⚡Base : Hanzo Trading Alpha Algorithm
The algorithm calculates volatility displacement vs liquidity recovery, identifying where probability meets imbalance.
It trades only where precision, volume, and manipulation intersect —only logic.
✈️ Technical Reasons
/ Direction — LONG / Reversal 4103
☄️Bul
About CFDs on Gold (US$ / OZ)
Gold price is widely followed in financial markets around the world. Gold was the basis of economic capitalism for hundreds of years until the repeal of the Gold standard, which led to the expansion of a fiat currency system in which paper money doesn't have an implied backing with any physical form of monetization. AU is the code for Gold on the Periodic table of elements, and the price above is Gold quoted in US Dollars, which is the common yardstick for measuring the value of Gold across the world.

XAUUSDHello Traders! 👋
What are your thoughts on GOLD?
Gold completed the expected bullish correction, reached the resistance zone and the broken trendline, and was strongly rejected from that area.
This rejection confirms continued bearish pressure in the market.
In the current region, we expect gold t

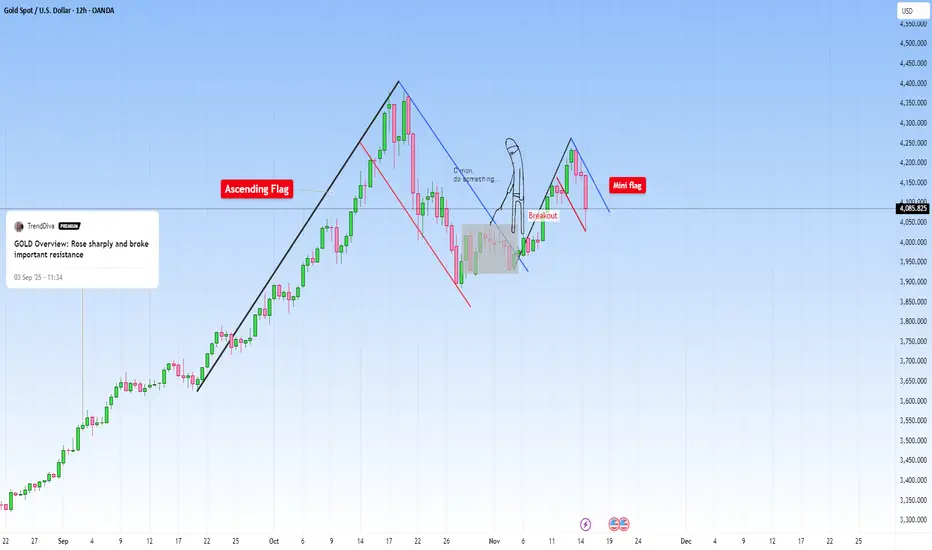
Overview: Gold isn’t Stalling, it’s Loading...Things have seemed a bit messy for gold lately: momentum getting shaky, traders unsure whether this is a top or the start of something bigger... But zoom out even slightly, and the story becomes stupidly simple.
First, after price broke an important resistance and accelerated upwards (Check my ana
GOLD → The bullish trend continues its movement FX:XAUUSD is testing the $4,150 level, hitting a three-month high amid expectations of a resumption of US government operations and weak economic data. The weekly gain exceeded 3%.
Expectations of Fed easing - 64% probability of a rate cut in December, Consumer Sentiment Index (50.3) - lowest

Seeing What Price Alone Can’t Show: The Power of Volume ProfileElements of a Volume Profile
The Volume Profile is a powerful charting tool that shows how trading volume is distributed across different price levels.
While normal volume bars appear below the chart showing activity per candle, the Volume Profile appears horizontally on the price scale, showing

Gold 30-Min — Volume Buy & Sell Reversals Triggered⚡Base : Hanzo Trading Alpha Algorithm
The algorithm calculates volatility displacement vs liquidity recovery, identifying where probability meets imbalance.
It trades only where precision, volume, and manipulation intersect —only logic.
✈️ Technical Reasons
/ Direction — LONG / Reversal 4178
☄️Bu

Gold Next zoneGold (XAU/USD) is trading near 4229, holding above support at 4211. A bullish move toward the 4300 target is expected if price breaks above resistance around 4238.

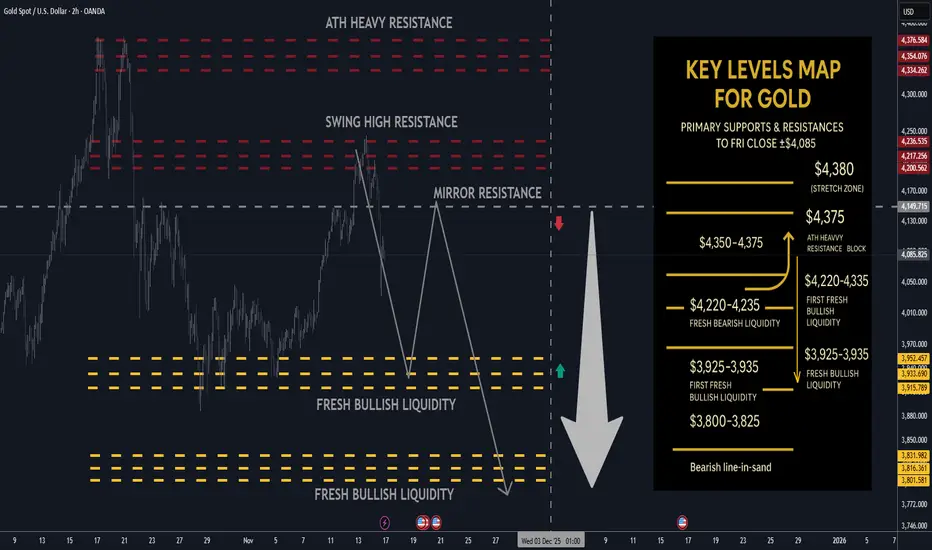
Gold next week: Key S/R Levels and Outlook for Traders🔥 GOLD WEEKLY SNAPSHOT — BY PROJECTSYNDICATE
🏆 High/Close: ~$4,244 → ~$4,085 — buyers punched through $4.20k but sellers defended the $4,220–4,250 band; weekly close is soft but still comfortably above $4k and mid-range.
📈 Trend: Bullish but in corrective / two-way mode ; treating current tape
After hitting resistance level going to target Gold is trading around 4080, showing a strong bullish momentum after bouncing from the support trend line. The price has broken above the previous resistance level, confirming an uptrend continuation. As long as it holds above the 4039 support zone, the bullish bias remains strong. The next potentia

XAUUSD Buyers Step In — Market Aiming for $4,140 RetestHello traders! Let’s take a look at XAUUSD (Gold). XAUUSD maintains a bullish structure after bouncing from the key $4,050–$4,060 support zone, where price also retested the ascending trendline. After breaking out of the descending channel, Gold formed a new accumulation zone and moved higher, appro

See all ideas
Summarizing what the indicators are suggesting.
Oscillators
Neutral
SellBuy
Strong sellStrong buy
Strong sellSellNeutralBuyStrong buy
Oscillators
Neutral
SellBuy
Strong sellStrong buy
Strong sellSellNeutralBuyStrong buy
Summary
Neutral
SellBuy
Strong sellStrong buy
Strong sellSellNeutralBuyStrong buy
Summary
Neutral
SellBuy
Strong sellStrong buy
Strong sellSellNeutralBuyStrong buy
Summary
Neutral
SellBuy
Strong sellStrong buy
Strong sellSellNeutralBuyStrong buy
Moving Averages
Neutral
SellBuy
Strong sellStrong buy
Strong sellSellNeutralBuyStrong buy
Moving Averages
Neutral
SellBuy
Strong sellStrong buy
Strong sellSellNeutralBuyStrong buy
Displays a symbol's price movements over previous years to identify recurring trends.