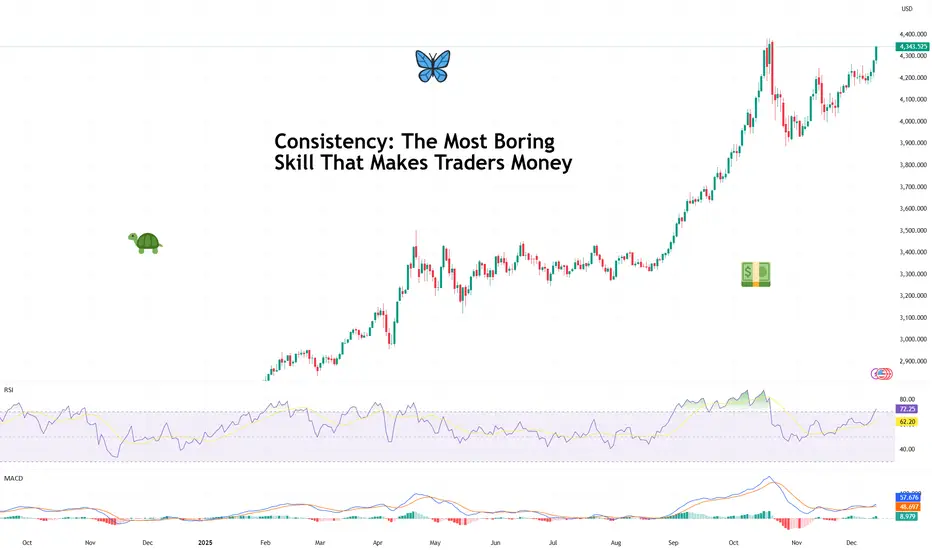
Consistency: The Most Boring Skill That Makes Traders MoneyAsk traders how they made their money and you’ll hear stories about perfect entries, heroic conviction, and that one legendary going-for-the-jugular trade they’ll mention at every dinner party.
What you almost never hear about is consistency — because it’s not glamorous, it doesn’t screenshot well,
About CFDs on Gold (US$ / OZ)
Gold price is widely followed in financial markets around the world. Gold was the basis of economic capitalism for hundreds of years until the repeal of the Gold standard, which led to the expansion of a fiat currency system in which paper money doesn't have an implied backing with any physical form of monetization. AU is the code for Gold on the Periodic table of elements, and the price above is Gold quoted in US Dollars, which is the common yardstick for measuring the value of Gold across the world.
GOLD 1H CHART ROUTE MAP UPDATE & TRADING PLAN FOR THE WEEKHey Everyone,
Please see our 1h chart levels and targets for the coming week.
We are seeing price play between two weighted levels with a gap above at 4306 and a gap below at 4270, as support. We will need to see ema5 cross and lock on either weighted level to determine the next range.
We will se

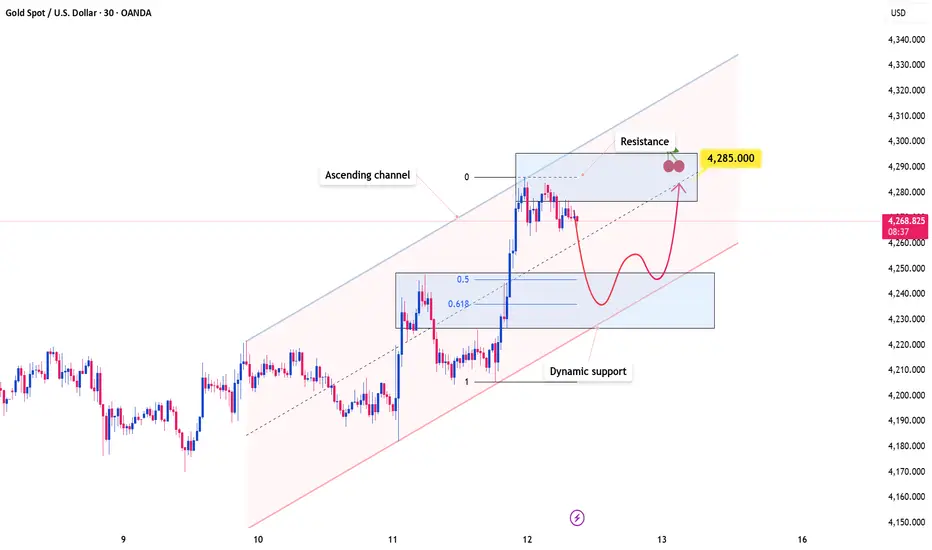
XAUUSDHello Traders! 👋
What are your thoughts on GOLD?
Gold is currently moving within an ascending channel and is approaching the channel ceiling.
This area coincides with the previous high and the All-Time High (ATH), making it highly significant.
A bearish reaction is expected in this zone.
Probable

Lingrid | GOLD Weekly Analysis: Bull Market Back in CommandOANDA:XAUUSD perfectly played out my previous weekly idea . Price capped off another powerful week, decisively breaking above the November high and confirming its bullish trajectory toward fresh all-time highs beyond $4,400. This isn’t just momentum—it’s structural. The market has transitioned fro

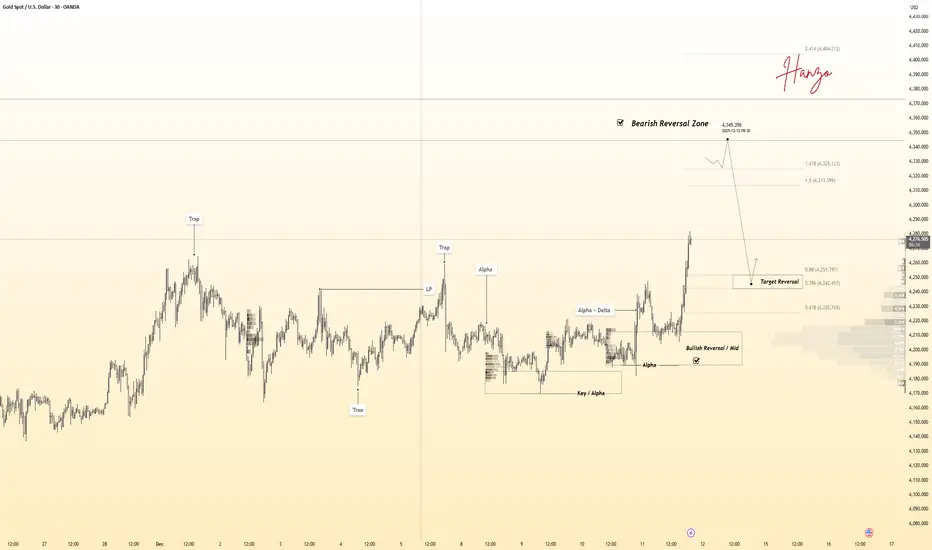
Gold 30Min Engaged ( Bearish Volume Reversal entry Detected )⚡Base : Hanzo Trading Alpha Algorithm
The algorithm calculates volatility displacement vs liquidity recovery, identifying where probability meets imbalance.
It trades only where precision, volume, and manipulation intersect —only logic.
✈️ Technical Reasons
/ Direction — SHORT / Reversal 4345 Area
Lingrid | GOLD Buying Opportunity From Swap ZoneOANDA:XAUUSD is still trading within a well-defined rising channel, with the latest push printing a higher high before stalling inside the upper resistance band. The subsequent retracement appears controlled, with price rotating back into the former swap zone rather than breaking structure. This pu

Gold - The -50% correction is starting!🎯Gold ( OANDA:XAUUSD ) is starting a -50% correction:
🔎Analysis summary:
For the past 10 years, we have been witnessing an underlying bullrun on Gold. Just like we saw back in 2011, the 10 year bullrun was followed by a correction of -50%. Together with the retest of the ultimate resistance t

Gold Holds a High Ground While the Market Reprices RiskOANDA:XAUUSD continues to trade within a well-defined ascending channel, with price action consistently respecting both the upper and lower boundaries. This structure highlights strong bullish control, suggesting that buyers remain firmly in charge and that upside continuation is still favored.
P
GOLD → Consolidation before reaching ATH FX:XAUUSD has been rising for the fifth consecutive day amid a weakening dollar and expectations of a dovish Fed policy. The market is testing intermediate resistance before reaching ATH.
The Fed cut rates by 25 basis points, but the market expects two cuts in 2026, not one, as stated in the

GOLD: In a bigger accumulation before moving higherGOLD: In a bigger accumulation before moving higher
Today, the US reported NFP data for October and November 2025.
USD Non-Farm Payrolls for October were -105k vs. 119k previously.
USD Non-Farm Payrolls for November were 64k vs. 50k expected.
Initially, the USD started off a bit weak, but as we ca

See all ideas
Summarizing what the indicators are suggesting.
Oscillators
Neutral
SellBuy
Strong sellStrong buy
Strong sellSellNeutralBuyStrong buy
Oscillators
Neutral
SellBuy
Strong sellStrong buy
Strong sellSellNeutralBuyStrong buy
Summary
Neutral
SellBuy
Strong sellStrong buy
Strong sellSellNeutralBuyStrong buy
Summary
Neutral
SellBuy
Strong sellStrong buy
Strong sellSellNeutralBuyStrong buy
Summary
Neutral
SellBuy
Strong sellStrong buy
Strong sellSellNeutralBuyStrong buy
Moving Averages
Neutral
SellBuy
Strong sellStrong buy
Strong sellSellNeutralBuyStrong buy
Moving Averages
Neutral
SellBuy
Strong sellStrong buy
Strong sellSellNeutralBuyStrong buy
Displays a symbol's price movements over previous years to identify recurring trends.