Lingrid | GOLD Weekly Market Outlook: Sell the SpikesOANDA:XAUUSD parabolic October rally has stalled, giving way to a sharp corrective phase. This signals waning momentum and the potential start of a deeper pullback. With price now testing key support near $4,000, the market is at a critical juncture: failure to hold this zone opens the door to targ
About CFDs on Gold (US$ / OZ)
Gold price is widely followed in financial markets around the world. Gold was the basis of economic capitalism for hundreds of years until the repeal of the Gold standard, which led to the expansion of a fiat currency system in which paper money doesn't have an implied backing with any physical form of monetization. AU is the code for Gold on the Periodic table of elements, and the price above is Gold quoted in US Dollars, which is the common yardstick for measuring the value of Gold across the world.

Gold 30-Min — Volume Buy & Sell Reversals Triggered⚡Base : Hanzo Trading Alpha Algorithm
The algorithm calculates volatility displacement vs liquidity recovery, identifying where probability meets imbalance.
It trades only where precision, volume, and manipulation intersect —only logic.
✈️ Technical Reasons
/ Direction — LONG / Reversal 4103
☄️Bul

XAUUSDHello Traders! 👋
What are your thoughts on Gold?
The $3,900 level continues to act as a key support zone for gold, preventing further downside pressure for now.
Currently, the price is consolidating between the highlighted support and resistance levels, showing range-bound behavior in the short te

Gold 30Min Engaged ( Bullish Reversal Detected )Status: Active Reversal Protocol
Symbol: Gold
Session: London–New York Overlap (Smart Exit Window)
⚡Base : Hanzo Trading Alpha Algorithm
The algorithm calculates volatility displacement vs liquidity recovery, identifying where probability meets imbalance.
It trades only where precision, volume, an

Lingrid | GOLD Market Consolidation Continues After DropOANDA:XAUUSD bounced from the channel base but remains capped under the downward trendline and the 4,080–4,100 supply band. Price action is carving a lower-high sequence within a falling channel after a failed retest, with a choppy mid-range consolidation. Below 4,080, sellers can press for 3,900 w

After hitting resistance level going to target Gold is trading around 4080, showing a strong bullish momentum after bouncing from the support trend line. The price has broken above the previous resistance level, confirming an uptrend continuation. As long as it holds above the 4039 support zone, the bullish bias remains strong. The next potentia

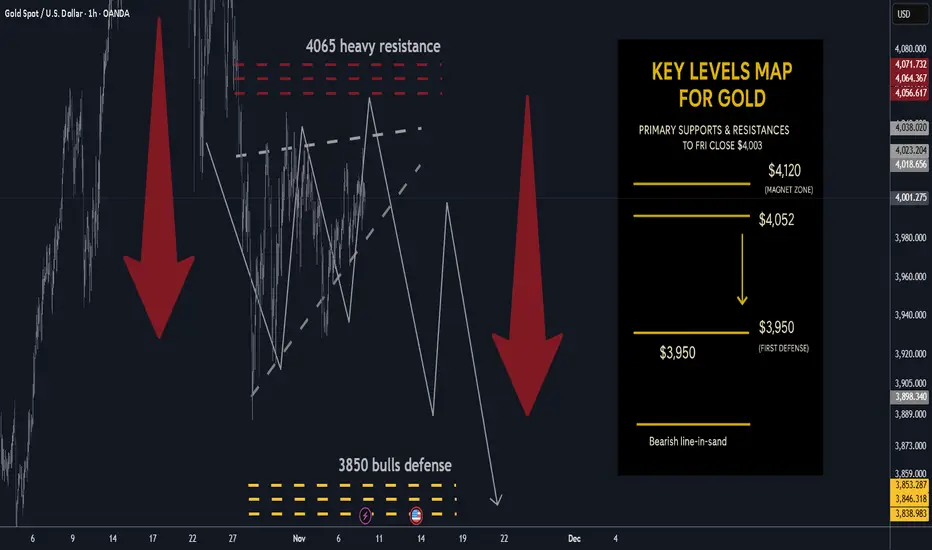
Gold next week: Key S/R Levels and Outlook for Traders🔥 GOLD WEEKLY SNAPSHOT — BY PROJECTSYNDICATE
🏆 High/Close: $4,024.9 → ~$4,003 — sellers faded upticks; weekly close soft but back above the round $4k.
📈 Trend: Neutral / mild correction inside range; not expecting immediate new highs while <$4,080–4,120.
🛡 Supports: $3,950 → $3,900 → $3,850 — piv
GOLD → The bullish trend continues its movement FX:XAUUSD is testing the $4,150 level, hitting a three-month high amid expectations of a resumption of US government operations and weak economic data. The weekly gain exceeded 3%.
Expectations of Fed easing - 64% probability of a rate cut in December, Consumer Sentiment Index (50.3) - lowest

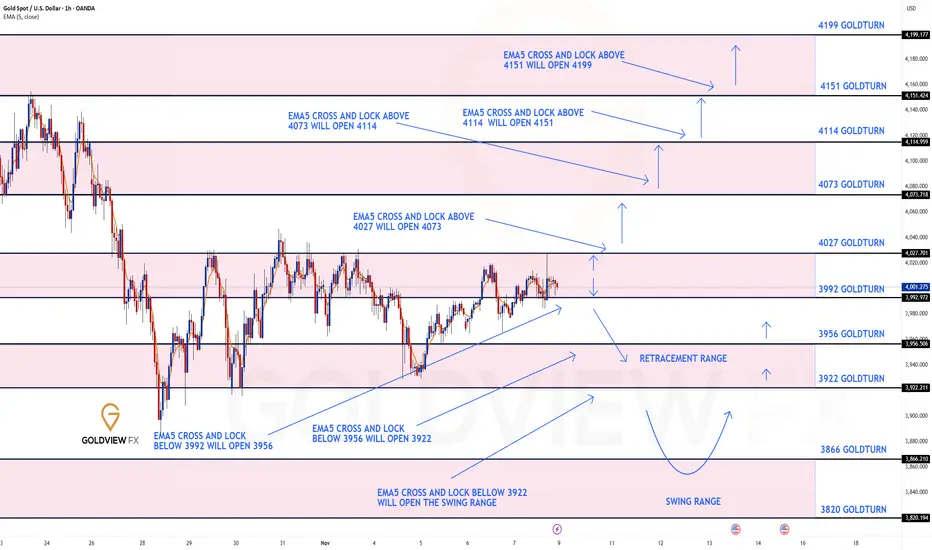
GOLD 1H CHART ROUTE MAP UPDATE & TRADING PLAN FOR THE WEEKHey Everyone,
Please see our updated 1h chart levels and targets for the coming week.
We are seeing price play between two weighted levels with a gap above at 4027 and a gap below at 3992. We will need to see ema5 cross and lock on either weighted level to determine the next range.
We will see le
Gold Targets 4153 After Support ReboundGold is trading near $3,982, showing bullish momentum after rebounding from the support trend line around $3,922. The price is forming higher lows, suggesting potential upward continuation. If gold sustains above the support zone, it could target the resistance level at $4,039, with a further potent

See all ideas
Summarizing what the indicators are suggesting.
Oscillators
Neutral
SellBuy
Strong sellStrong buy
Strong sellSellNeutralBuyStrong buy
Oscillators
Neutral
SellBuy
Strong sellStrong buy
Strong sellSellNeutralBuyStrong buy
Summary
Neutral
SellBuy
Strong sellStrong buy
Strong sellSellNeutralBuyStrong buy
Summary
Neutral
SellBuy
Strong sellStrong buy
Strong sellSellNeutralBuyStrong buy
Summary
Neutral
SellBuy
Strong sellStrong buy
Strong sellSellNeutralBuyStrong buy
Moving Averages
Neutral
SellBuy
Strong sellStrong buy
Strong sellSellNeutralBuyStrong buy
Moving Averages
Neutral
SellBuy
Strong sellStrong buy
Strong sellSellNeutralBuyStrong buy
Displays a symbol's price movements over previous years to identify recurring trends.