GOLD LONG TERM Target Hello everyone, I hope you are well
In this idea, I will share with you some of the expectations I see on the price of gold in the long term
I expect that the price has approached the target and will be in the rectangle shown in the idea
Which is between $4200 and $5000
After that, the price will enter a downward trend that may last for years
Remember this is not investment advice. You are responsible for the buying and selling decision
Beware of using leverage. The reason is that this is not an accurate recommendation
Good Luck
Trade ideas

#XAUUSD: Two Entries, Three Targets, Swing Sell! Gold dropped to 3883 region, the lowest point in the last two months. Since then, it has started rebounding. Currently, the price is approaching a very important key level, which could lead to a smooth reversal. However, market conditions will be extremely volatile, making it difficult to predict any move. This is because we have the NFP coming up. Due to this volatility, both of these entry points are equally possible.
Once either entry is confirmed, you should place a target based on your risk management and trade planning. Remember, this is not a confirmation, and the price could go in the opposite direction. Please do your own analysis before making any financial decisions.
We are here to help. If you have any questions related to this analysis or any trading matter, please drop a comment. We will do our best to help you out. If you want to support us, please like and comment on the idea.
Team Setupsfx_

XAU/USD Completing Wave Y: Final Dip Before RallyGold has completed its major 5-wave rise and is now finishing a corrective W-X-Y pattern. The recent drop looks like the final leg of this correction, meaning sellers are getting weaker. Price may show a small bounce up and then one last dip to complete the correction. After that final drop, a strong new uptrend is expected to start again. In short: correction ending soon, last dip big bullish move ahead.
Stay tuned!
@Money_Dictators
Thank you :)

Gold key Levels (3800-4100)These are the Gold key levels which I’ll be using for trading.
Here’s how I trade these levels:
- Close above a level → Buy setup
When a candle closes clearly above a level, it confirms bullish momentum and I look to enter long immediately after the close.
- Close below a level → Sell setup
A confirmed candle close below support signals bearish strength, and I enter short right after the close.
- Rejection from a level → Opposite trade
If price shows a strong rejection from a level, I trade in the opposite direction - rejection from resistance = sell setup, rejection from support = buy setup.
These levels works well for both day trading (using 1H candles) and scalping (using 15M or lower timeframes). It keeps trading simple, just reactions to market behaviour.

Gold is Targeting #5,100.80 benchmark / Medium-termGold's Short-term: Gold reached my personal maximum (regarding Short-term of course) of almost invalidating #4,400.80 benchmark / both Short and Medium-term Buyers / investors started taking Profits and as Naturally, asset cannot only Trade in one direction, Gold dipped creating aggressive Descending Channel and is now testing the Lower Low’s pressure point. However, #4,000.80 is very strong Support zone for the fractal which won't be invalidated without serious cause and even with Short-term development (due current decline) Investors drawing capital from Gold to more riskier assets - I doubt Gold has more potential to go Lower below my Support zones on the chart regarding Short-term. The current Selling accumulation pattern on Hourly 4 chart is now on total Neutrality but attempting to break towards last week’s Lower Low's. Current Fed loan climate is Gold friendly as Gold often demonstrates resilience during early phases of Fed tightening cycles before investment flows adjust to Higher Rates. If Rates go down more aggressively, Gold will soar more (another reason why I am Bullish on Gold).
#MA50 and #MA200 observation: Keep both lines on your Weekly (#1W) chart, as they are pointers for Long-term. As Long as Gold is Trading above them, Bullish Long-term stance remains and Gold will Target upper levels.
Fundamental commentary: Gold was Trading on #1,800.80 on mid-October #2023 Year, and currently tested #4,400.80 benchmark which records one of the most aggressive rises of Gold in history. It was up almost (# +65.00%) lately / when confidence in financial system is on a decline (which is the case in current and last few Years), Gold is soaring as hedge. U.S. Dollar just had one of its weakest first halves in #50 Years, down more than (# -10.00%) against other major currencies. Massive debt (# 315 trillion globally), rising government spending and tariff regulation and impact on the markets have shaken confidence in the system world-wide. When U.S. Dollar weakens, Investors are in search of asset that feels more stable to store their money / it is always one and almost only option - Gold. In addition, Central banks have been Buying Gold in bulk / over #1,000 tons annually for the past #3-Year fractal, most since #1,967 Year which is not surprise or weird / something is going on. Part of that started with Middle East conflict escalation #2,023 Year, U.S. freezing #300 million Russian reserves in #2,022 Year, showcasing other countries that their Dollars can be shut off as political leverage.
Recapitulation: Segment which makes the almost (# +65.00%) increase on Gold unusual is that both Gold and Stock markets are both hitting record Highs at the same time. Institutions are still sitting on trillions in cash. Many are still not deciding to go "all in" on Stocks at these levels. Also on the contrary, they also don't want to lose to Inflation sitting on the sidelines / so they're parking most of the money in Gold as a temporary middle ground and that demand is helping push Gold Higher from big institutions, and also independent Investors world-wide. Even with all the questions and uncertainty right now, keep this in mind: Gold is used to protect wealth, not grow it. Gold usually spikes when confidence in the financial system drops, but it can dip just as fast once confidence returns. In #1,980 Year, Gold hit a record of #850.80 per ounce then dropped (# -50.00%) by #1,982 Year. After peaking at #1,920.80 in #2,011 Year, it took nearly a decade to recover and if full confidence returns, Gold may fall fast as mention above, however confidence for financial system is far from delivered or happening.
My personal thoughts: All Traders are well aware that I am well known Seller of the market however what made me triple my account, is switching to being a Bull in recent times as Trading against the trend is disastrous for a Trader. I do believe that even if Gold dips, near Lower Low's is maximum as illustrated on my chart and #5,100.80 benchmark is my next point of interest and my next Medium to Long-term Target. #6,100.80 - #6,200.80 represents Ultimate Top's for now and stabilization zone where another aggressive dip is possible, fuel only for Gold to soar further. I do believe Financial system is about to collapse even more and with ever-growing Inflation world-wide, Gold will skyrocket and I am here to Buy it / Trade it even more than ever, expecting my Targets to be met. Remember, trend is your friend and hope all of Sellers which got liquidated accounts, sending me many messages will turn their Technicals and finally start Buying Gold. Yours, goldenBear88

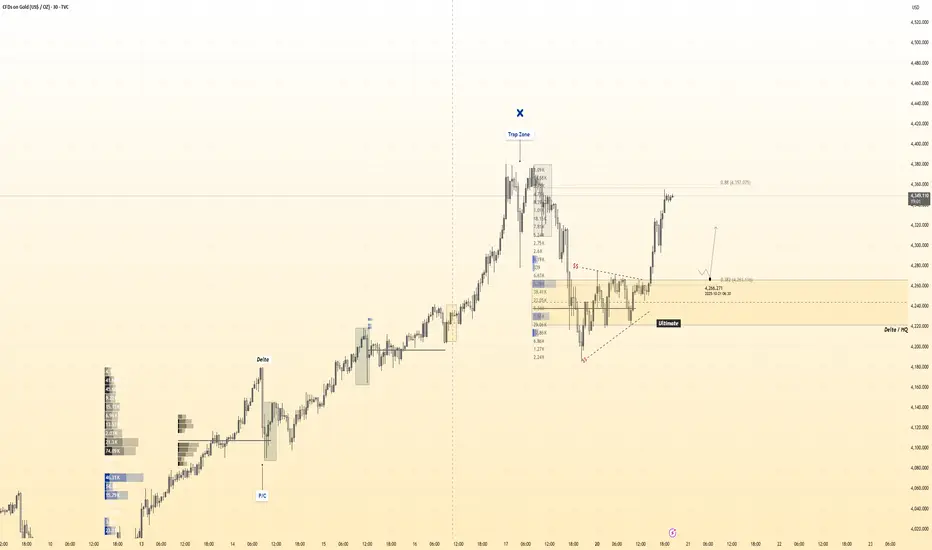
( HANZO Gold Protocol ) Bullish Reversal DetectedStatus: Active Reversal Protocol
Symbol: Gold
Session: London–New York Overlap (Smart Exit Window)
➕Bias: Bullish Reversal
Goal: Controlled with minimal drawdown
Tactical Edge: Reversal Protocol through liquidity engineering
Confidence Level: ★★★★★ (Smart Money Aligned)
☄️4270 Bullish Reversal Zone — Full Breakdown
1️⃣ Fixed Range HVN Alignment
The 4270 level aligns perfectly with the High Volume Node from the previous accumulation phase — a sign of institutional absorption where orders were heavily exchanged before breakout.
2️⃣ Volume Gap Above, Density Below
Below 4270 we have heavy volume clusters, while above it the profile becomes thin — confirming that 4270 is the last defended zone before liquidity imbalance.
3️⃣ Liquidity Trap Confirmation
The sharp push below 4300 earlier collected stop-loss liquidity, making 4270 the smart money re-entry zone after clearing out retail buyers.
4️⃣ Fibonacci Alignment (0.382–0.5 Zone)
4270 sits inside the 38.2% retracement of the impulsive move, which is a premium re-entry level used by institutional models.
5️⃣ Structural Confluence (Old Resistance → Support)
Previous breakout base and trend compression aligned with 4270 mark it as a flip zone — the structural confirmation of a reversal block.
6️⃣ Delta HQ Reversal Indicator
At the base of the move (near 4270) the Delta HQ showed negative absorption turning neutral, meaning sell volume failed to push price lower — a key reversal trigger.
7️⃣ Session Logic
The level coincides with the post-10:30 session retest window (smart money re-entry timing), fitting your 10:30–10:30 volume cycle.
8️⃣ Trap Zone Above (Liquidity Vacuum)
The upper “Trap Zone” confirms that price already engineered liquidity above, freeing up path for bullish continuation from 4270 upward.
9️⃣ Internal Trendline Compression Break
The descending pattern leading into 4270 forms a bullish breakout wedge — clear compression followed by volume breakout.
🔟 Institutional Behavior Evidence
Sharp imbalance candle after 4270 test shows controlled accumulation — classic smart money re-entry behavior before next expansion.
🎯 Summary (Hanzo Logic)
4270 = Delta Reversal + HVN Defense + Liquidity Reset + Fib Precision
A high-confidence engineered re-entry zone built by smart money to refill positions before bullish continuation.
GOLD | Awaits CPI Data for Next Direction GOLD | Awaits CPI Data for Next Direction
Gold prices are set for a strong move ahead of the U.S. CPI release.
Key Levels
Pivot: 4,053
Resistance: 4,101 · 4,124 · 4,163
Support: 4,011 · 3,985 · 3,945
Trading Plan
🔼 Buy Setup: Longs valid above 4,053, targeting 4,101 / 4,124 / 4,163 — supported if CPI prints below 3.1%.
🔽 Sell Setup: Shorts valid below 4,053, targeting 4,011 / 3,985 / 3,945 — favored if CPI comes above expectations.
📌 Premium Takeaway
Gold is poised for a strong reaction to inflation data.
A softer CPI favors bullish continuation toward 4,124–4,163,
while a hotter CPI could trigger a bearish correction toward 4,011–3,945.

gold can back to 3700 areagold can back to 3700 area then start new + wave
now i put sellstop in last low( trend line break mean can go downer) with tp= fibo 60% and sl=last high on H4
waite time= 1 week
Alert= break high is new buy signal can push gold near 5000
wish you win

GOLD Long Trade TVC:GOLD / OANDA:XAUUSD Long Trade
Entry: 4259 - 4267
TP: 4350
This is good trade.
Don't overload your risk like Greedy gambler!!!
Be Disciplined Trader, risk what you can afford.
Use proper risk management.
Disclaimer: Trading is risky, only idea, not advice.

Gold Consolidates Before Next MoveGold Consolidates Before Next Move
Gold is currently showing a short-term correction after reaching the $4,380 area. The price has pulled back as expected near $4180, and remains above this strong key support area.
From the current data we have, the price could rise from the market price where it is now or it could move a little lower before a recovery could occur towards the next targets at $4,250, $4,300, and $4,350.
A break above $4,380 would confirm a continuation of the bullish trend.
⚠️ However, if the price of gold falls below $4,180, then this could be caused by a strong sell-off that may not be related to normal movements. The decline could be caused by profit-taking by investors who are holding the price up.
⚠️ So, never trade without a stop loss. The market is positioned only for long trades and this carries a high risk. It is not a normal way for the price to develop.
If a downward wave occurs, it will occur without any pattern or confirmation, so be prepared for it at any time.
You may find more details in the chart!
Thank you and Good Luck!
❤️PS: Please support with a like or comment if you find this analysis useful for your trading day❤️

GOLD (XAUUSD): Short Trade Before the FED
I see an intraday pullback trade on Gold ahead of
FOMC & FED Interest Rate Decision today.
The price will likely retrace from the underlined resistance,
following a confirmed bearish imbalance and a formation
of a double top pattern.
Expect a bearish movement at least to 3988 level.
❤️Please, support my work with like, thank you!❤️
I am part of Trade Nation's Influencer program and receive a monthly fee for using their TradingView charts in my analysis.

THE KOG REPORTTHE KOG REPORT:
In last week’s KOG Report we gave the bias level as bullish above 4003 and the red box we would be looking for to break to then confirm the move into the region we wanted. The move played well from the opening going on to complete all the red box targets together with our algo targets on gold.
Although it being risky we wanted to short from the given region, but due to price breaking through without even halting, we updated traders with the higher region we were looking to target, which also worked well.
On Friday, we managed to identify the pattern we wanted and activated a target of 4197 together with the break below the bias level. This for us again worked well to end the week with a wonderful short and then a TAP AND BOUNCE from the indicator level giving those who missed the short and opportunity to capture a 200pip long to end the week.
A phenomenal week in Camelot, not just on Gold but the many other pairs we trade and analyse.
So, what can we expect in the week ahead?
So, this week I have a bit of a concern with this bearish move. I have a sneaky suspicion that they may not have completed upside as yet, and instead, want to get traders in to thinking the retracement has started. Just a inkling for now so let’s see how the week opens and what region we attack first.
Above, I have a reversal on the hourly and the 4H chart but the daily, weekly and monthly are still suggesting higher pricing. Ideally, we need another bearish day for price to leave the 4200’s and come close to the 4150 level to hold before we decide we’re going to either consolidate and accumulate here or get a deeper pull back. Below, we have 4220 which is the level that will need to break for us to go lower with the initial target below being 4165 and below that 4129.
Our key level here initially is the 4295 level and above that 4310. 4310 is the line in the sand for bulls to attempt to break to go higher and complete the move back above to create another all time high. Failure, and we should get more confirmation of a deeper pull back that should attempt to target the lower 4000 mark.
As usual, we’ll let the algo confirm the move, the indicators will tell us which way to stay in, and the liquidity indicator will tell us when to play caution. For now, the path is on the chart, let’s see how we open and begin the week.
KOG’s bias of the week:
Bullish above 4230
Bearish below 4220
RED BOXES:
Break above 4255 for 4265, 4270, 4284 and 4304 in extension of the move
Break below 4237 for 4230, 4220, 4210, 4206, 4185 and 4177 in extension of the move
Please do support us by hitting the like button, leaving a comment, and giving us a follow. We’ve been doing this for a long time now providing traders with in-depth free analysis on Gold, so your likes and comments are very much appreciated.
As always, trade safe.
KOG

Exclusive analysis of gold's future market.
What recent news is influencing gold's performance? How should we assess the outlook for gold's bullish and bearish outlook?
Gold prices weakened again in U.S. trading on Monday (October 27), extending last week's decline. With the thaw in U.S.-China trade relations, investor demand for gold as a safe-haven asset has declined. Market focus has now shifted to the Federal Reserve's interest rate decision, with the agency expected to announce a rate cut later this week. This decline comes just as gold's nine-week winning streak ended, after the price briefly surpassed $4,300 per ounce, reaching a record high, driven by geopolitical risks and expectations of monetary easing. The latest decline stems from progress in trade negotiations. U.S. and Chinese officials reached a preliminary agreement during the ASEAN Meetings in Malaysia, with the framework expected to be finalized later this week when the two presidents meet in South Korea. The agreement is expected to extend the trade truce and pave the way for a broader trade agreement. This suggests the risk of renewed trade friction has significantly decreased. Improving sentiment has driven investors' renewed appetite for riskier assets, weakening safe-haven demand for gold.
This week marks a "super week" for gold, and the gold market will continue its surge. First, the 2025 Asia-Pacific Economic Cooperation (APEC) Leaders' Informal Meeting will take place. US President Trump will also travel to Southeast Asia, where he will meet with leaders from various countries. Furthermore, amid the US government shutdown, a series of central bank interest rate decisions will be announced this week, including those from the Federal Reserve, the Bank of Japan, the European Central Bank, and the Bank of Canada. The US will also release a series of economic data, including the September core PCE price index, a key indicator for the Fed's interest rate adjustments, and third-quarter real GDP data. Expectations of a Fed rate cut at its October 29th meeting have limited further declines in gold prices. Last week's weaker-than-expected US Consumer Price Index (CPI) data reinforced market bets on a 25 basis point (0.25 percentage point) rate cut by the Fed. Traders are also watching for further easing signals this year. Generally speaking, rate cuts reduce the opportunity cost of holding gold and weaken the US dollar, making dollar-denominated gold more attractive to overseas buyers.
Gold Market Analysis on October 28th:
Gold Technical Analysis: Gold broke through the 4,000 mark as expected. We've been emphasizing short selling numerous times today, but did you miss out? Gold successfully broke through the 4,000 mark in the US market, and the US Treasury and spot gold markets showed clear signs of rotation. The US Treasury yield index re-entered the 4% mark, reflecting a subtle adjustment in market expectations for a Fed rate cut this week and a temporary outflow of safe-haven funds. The US dollar index fell slightly by 0.14% on the day, while spot gold remained under downward pressure. Based on the current 4-hour chart, gold still has room to fall. Focus is on the upward pressure at 4,010. A break above this level will open up further upward potential. I personally believe the upward trend will not break in the short term. Having already broken through the 4,000 mark, gold is poised to test the 3,945 level. If it fails to break through this level, it is likely to trade in a range-bound manner in the short term. Trading strategies suggest that rebounds from the upper resistance level could be opportunities for short selling.
After breaking through the neckline of the 1-hour double top, gold has been fluctuating weakly below it. The 1-hour moving average continues to diverge downward, indicating bearish momentum. A break below 4004 in the US trading session provided support, but this support has now become resistance. Therefore, any resistance below 4004 in the US trading session presents an opportunity to buy on rallies. Overall, today's short-term trading strategy for gold suggests shorting on rebounds, supplemented by buying on pullbacks. Focus on resistance at 4160-4185 in the upper short term, and support at 4010-4005 in the lower short term. It's crucial to keep pace with the market. Maintain control of your positions and stop-loss orders, set strict stop-loss orders, and avoid holding onto positions. Specific trading points are based on real-time intraday data. Welcome to experience and share real-time market trends.
Gold Trading Strategy Reference for October 28th
Short Strategy:
When gold rebounds to around 4004-4010, short (buy short) a 20% position in batches, targeting around 3960-3950. A breakout targets the 3945 level.
Long Strategy:
When gold pulls back to around 3945-3950, long (buy long) a 20% position in batches, targeting around 3980-4000. A breakout targets the 4010 level.

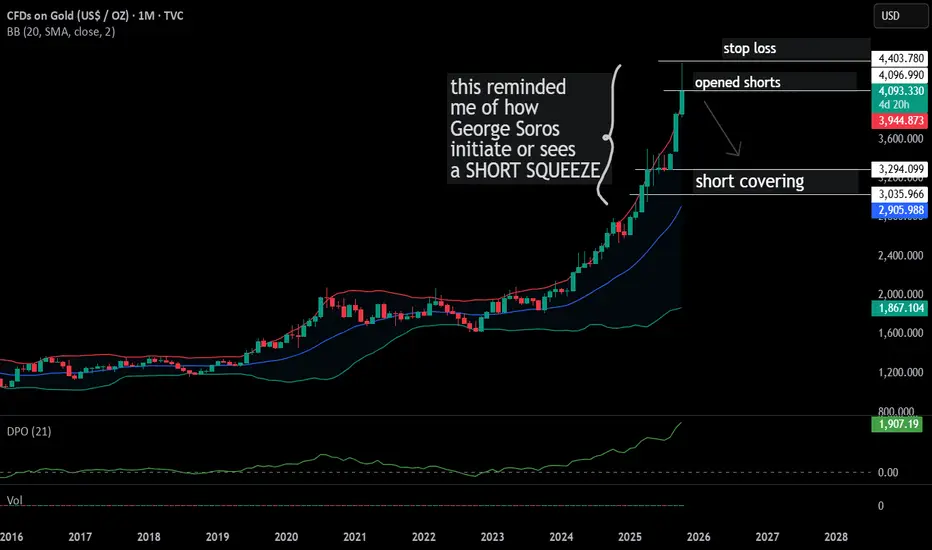
GOLD $4091 | a Short Position basic rule is when one sees a parabolic move
it's time to sell on the way up instead of aping in
difficult to contain fomo however
just have to pull t he trigger after a week of confirmation or red candle
the bounce should be opportunity to size up
and STOPS ha s to be higher
as you can get wicked ouot
XAUUSD 4H🔷 Current Market Structure:
Price is in a developing consolidation area between roughly 4010 – 4140.
After a strong drop from the previous high (ATH area around 4377), the market has paused, showing sideways movement — classic consolidation before the next major leg.
Candles are showing lower highs and higher lows, forming compression.
🧭 Key Levels Noted on Chart:
Resistance Zones (Supply Areas):
4140–4236 zone → Strong resistance / potential breakout zone.
A break above 4236 could trigger momentum toward ATH 4377.
Label: “BUY ABOVE 4236” ✅
Support Zones (Demand Areas):
4010 Weekly Support → Critical line holding price multiple times.
3996 → Clear sell trigger below this level, confirming bearish continuation.
Label: “SELL BELOW 3996” ⚠️
3859 Monthly Support → Deeper downside target if breakdown occurs.
⚖️ Market Bias: Neutral to Reactive
Currently neutral, waiting for breakout confirmation:
🔼 Bullish scenario: Break and close above 4236 → targets 4300 → 4377 (ATH)
🔽 Bearish scenario: Break and close below 3996 → targets 3900 → 3860
🧠 Smart Trader Insight:
This is a no-trade zone until price breaks the range.
Avoid chasing within the consolidation; instead, prepare for breakout trades.
Volume and candle structure near 4236 or 3996 will confirm direction.

XAUUSD: Final Dip Before RallyGold has completed its major 5-wave rise and is now finishing a corrective W-X-Y pattern. The recent drop looks like the final leg of this correction, meaning sellers are getting weaker. Price may show a small bounce up and then one last dip to complete the correction. After that final drop, a strong new uptrend is expected to start again. In short: correction ending soon, last dip big bullish move ahead.

GOLD | Bearish Bias Holds Below $3,944 Amid Trade OptimismGOLD – MARKET OVERVIEW | Trades Below $4,000 as Risk Appetite Rises
Gold continues to slide, as optimism over a potential U.S.–China trade deal and improving global outlook weakens demand for safe-haven assets.
The metal is now down nearly 10% from its all-time high of $4,377 (Oct 20), with the recent rally losing steam as traders take profits amid signs of progress in trade negotiations between the world’s two largest economies.
Technical Overview
Gold dropped nearly $150, exactly as projected in our previous outlook.
The price remains under bearish pressure while below 3,944, targeting 3,893, and a break below that could extend the decline toward 3,855 → 3,818.
However, a 1H close above 3,944 would indicate a potential reversal, opening the way for a retest of 3,970 → 4,011.
Key Technical Levels
Pivot Zone: 3,932 – 3,944
Support: 3,893 · 3,855 · 3,819
Resistance: 3,970 · 4,011 · 4,053
Outlook:
Gold stays bearish below 3,944, with downside potential toward 3,855 if trade optimism persists.
Only a confirmed 1H close above 3,944 would shift bias back to short-term bullish toward 4,011.

XAUUSD - Bears are taking over Gold remains under bearish pressure as it trades below key moving averages and fails to reclaim the 61.8% retracement zone. A confirmed 4H close below $3,920 would strengthen the case for a continuation toward the Fibonacci extension targets listed below.
🎯 Fibonacci Extension Targets (Bearish)
Using the latest swing high to swing low:
Target 1 (38.2%) → $3,832
Target 2 (61.8%) → $3,808
Target 3 (100%) → $3,776
Bias: Bearish continuation
Confluences:
Trend Structure: Price is forming lower highs and lower lows after rejecting from the previous swing high, confirming a bearish market structure.
EMA Ribbon / Dynamic Resistance: The price is trading below the EMA ribbon, which is now acting as a strong dynamic resistance zone.
Fibonacci Retracement: Price rejected from the 61.8% retracement level of the previous downswing — a key bearish retracement zone.
Momentum Indicators: Bearish momentum increasing as candles close below the midline of the ribbon with low buying pressure.
Volume/Confirmation: Decreasing bullish volume on retracement, followed by renewed selling pressure.

The Historical Crashes of Gold — What Really Caused Them ?Hello Traders 🐺
Throughout history, every major bear market in gold has been deeply connected to macro factors, monetary policy, and investor psychology.
Here I’ve summarized the key factors behind gold’s biggest crashes since the 1970s 👇
🧩 Key Factors Behind Historical Gold Crashes
1️⃣ Rising Real Interest Rates (↑)
The biggest historical enemy of gold.
Since gold has no yield, when real interest rates (nominal rates – inflation) turn positive, investors prefer bonds or the U.S. dollar.
Example:
In the 1980s, Fed Chair Paul Volcker raised rates above 15% to fight inflation.
Result: gold dropped from $850 (1980) to around $300 by the mid-80s — a 65% crash, marking the longest bear market in gold’s history (1980–1999).
2️⃣ A Stronger Dollar (DXY ↑)
Gold usually moves inversely to the dollar index.
When the dollar strengthens (especially vs EUR and JPY), gold comes under pressure.
Example:
Between 2011–2015, DXY rose from 73 → 100, while gold fell from $1920 → $1050 (≈45% decline).
3️⃣ End of Crises or Return of Market Confidence
When fear fades and confidence returns (e.g., after financial crises or geopolitical tensions ease), investors move away from safe-haven assets like gold.
Example:
After the 2008 crisis, once markets stabilized, gold entered a prolonged bear market (2012–2015).
4️⃣ Central Banks Stopping Gold Purchases
When central banks reduce or halt their gold accumulation, supply pressure builds.
Example:
In the late 1990s, European central banks sold large portions of their reserves (known as the Central Bank Gold Agreement 1999), which accelerated gold’s decline.
5️⃣ Strong Stock Market Returns
When equities deliver strong real returns, capital often rotates out of gold.
Example:
From 1995–2000, the S&P 500 rallied massively, while gold suffered one of its weakest decades.
6️⃣ Low Inflation & Economic Stability
Gold thrives on uncertainty and high inflation.
When inflation is low and stable, investors see little reason to hold gold.
Example:
Between 1985–2000, inflation in the U.S. stayed low — and gold traded sideways between $250–$400 for nearly 20 years.
7️⃣ Technical & Sentiment Breakdown
When key supports break and sentiment turns bearish, fear-driven selling usually accelerates the downtrend.
Example:
In 2013, gold broke below the $1550 support, triggering a rapid 20% selloff within months.
My final thought:
Every time gold enters a euphoric phase, history reminds us that the higher it climbs, the harder it falls.
So what do you think right know ? is GOLD about to fall ? let me know in the comment section down below this idea 😉🤔
So stay disciplined, watch the macro shifts carefully — and as always remember:
🐺 Discipline is rarely enjoyable, but almost always profitable. 🐺
🐺 KIU_COIN 🐺

Gold: Quest for new equilibriumGold has experienced a strong rally since the beginning of September, as investors sought safety amid elevated market uncertainties, including risks of a U.S. government shutdown and fresh trade-tariff tensions. The short term reversal was expected at some point, with higher uncertainty of when this moment might actually happen. Some exhaustion in the price level occurred during the previous week. Tuesday was the day when the gold pulled back from $4.374 down to $4.085. The weakening continued for the rest of the week, however, the price of gold is still in the quest for a new equilibrium level, from the technical point of view.
For the first time in almost two months, the RSI went out from a highly overbought market side, down to the level of 58. The indicator is still showing that the market is not ready to take a clear path toward the oversold market side. There are no changes with both MA50 and MA200, given the circumstances, both lines could only move within an uptrend.
From the point of the technical analysis, movements during the last three trading days show that investors are still within a wait-and-see mood. The level of $4.150 currently represents the level of short resistance. On the opposite side, the lowest weekly level of $4K represents a sort of supporting level. Levels should be considered within a broader view. Namely, a lot of funds were transferred into gold from both equity and crypto markets in a previous period due to investors' fears. As these fears slow down, the funds will be reverted back toward riskier assets. That means further weakening of the gold. For the moment, the $4K level should hold, but with increasing probability for downside.

Gold Key Levels (4000-4400$)These are the Gold key levels which I’ll be using for trading.
Here’s how I trade these levels:
- Close above a level → Buy setup
When a candle closes clearly above a level, it confirms bullish momentum and I look to enter long immediately after the close.
- Close below a level → Sell setup
A confirmed candle close below support signals bearish strength, and I enter short right after the close.
- Rejection from a level → Opposite trade
If price shows a strong rejection from a level, I trade in the opposite direction - rejection from resistance = sell setup, rejection from support = buy setup.
These levels works well for both day trading (using 1H candles) and scalping (using 15M or lower timeframes). It keeps trading simple, just reactions to market behaviour.

GOLD | Rebounds Above $4,000 Ahead of Fed DecisionGOLD – MARKET OVERVIEW | Rebounds Above $4,000 Ahead of Fed Decision 🪙
Gold futures climbed back above $4,000, rebounding in early trade ahead of the Federal Reserve’s rate decision later today.
The metal gained around 1%, supported by expectations that the Fed will cut rates by 25 basis points, a move that typically boosts demand for non-yielding assets like gold.
Markets have already priced in the rate cut, leaving investors focused on Chair Powell’s comments for clues on whether another cut could follow in December.
Technical Outlook
Gold remains in a bullish momentum as long as the price trades above 4,011, targeting 4,053 initially.
A 1H or 15Min close above 4,053 would confirm further upside toward 4,104.
However, if the price reverses and stabilizes below 3,982, it would shift the bias to bearish, opening the way toward 3,930 → 3,893.
Key Technical Levels
Pivot Zone: 4,011 – 4,016
Resistance: 4,053 · 4,104 · 4,148
Support: 3,982 · 3,930 · 3,893
Outlook:
Gold stays bullish while above 4,011, with potential to extend gains toward 4,104 if the Fed delivers a dovish tone.
But if Powell’s remarks turn unexpectedly hawkish and price stabilizes below 3,982, a deeper pullback toward 3,930–3,893 could follow.

Gold Analysis: Break Above $4,293 Could Trigger a New HighHi guys!
Gold has been moving inside a clear ascending channel, respecting both its upper and lower boundaries. Recently, we saw a double top formation near the upper trendline , which triggered a corrective move down to the $4,190–$4,200 support zone, an area that has already shown strong buying interest.
After the rebound from this support, the price is now aiming toward the $4,293 resistance.
👉 If the price breaks and holds above $4,293 , it’s likely to continue the bullish momentum and head toward a new higher high inside the channel.
Overall, the structure remains bullish as long as the price stays above $4,190 , with the next key resistance at $4,293 being the level to watch for a potential continuation of the uptrend.
Gold’s bullish bias remains supported by the ongoing geopolitical tensions, uncertainty over global interest rate paths, and softening U.S. dollar. Investors are also increasingly turning to gold as a safe-haven asset, especially amid concerns about economic slowdown and central bank gold purchases remaining strong.
Disclaimer: As part of ThinkMarkets’ Influencer Program, I am sponsored to share and publish their charts in my analysis.
