GOLD BIG SELLthe news are not good around gold , and big institutions like china will be trapped in trump's manipulation of the market , follow the market maker and invest intelligently , the next movement for gold is bearish
Trade ideas

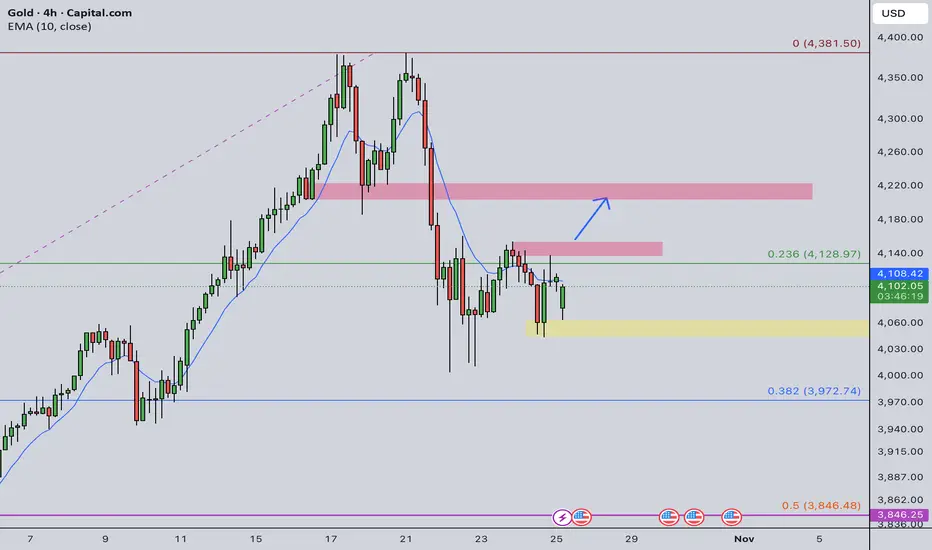
XAU/USD | Gold Under Pressure, Support & Resistance to WatchGold continues to trade under pressure, holding below both the MA50 and MA200, keeping short-term momentum firmly tilted to the downside. Price is currently hovering just below the 4,095 support level, with the market remaining range-bound within a broader corrective structure.
Buyers will need a confirmed break above 4,137 to trigger a potential recovery toward 4,178 and 4,234.
On the downside, the 4,042–3,987 Support Zone serves as an intermediate area to monitor for short-term reactions. A failure to hold this zone could extend the decline toward the Deeper Support Zone, which remains a major reaction area where dip-buyers are expected to re-enter the market.
📌 Key levels to watch:
Resistance:
4095
4136
4178
4234
4285
Support:
4042
3987
3944
🔎 Fundamental focus:
Gold remains under pressure as traders weigh ongoing U.S. government shutdown risks and delayed economic data, which have limited visibility into the real state of the economy.
While short-term price action remains corrective, safe-haven demand and macro uncertainty are still expected to support gold on deeper dips toward key demand zones.


The upward wave has ended.Since the past and the $2000 gold price, we have provided and updated our gold analysis, stating that wave-(E) of gold has started.
In our latest analysis, we mentioned that gold could rise to a maximum of $4330–$4401, and prices above this range would not be sustainable.
Currently, in my opinion, the post-pattern move has been confirmed, and we can say that wave-(F) has begun. This corrective wave could take approximately 2 years, after which gold's upward trend may resume. Gold prices could fluctuate between $3100–$4300, and the most likely pattern for wave-(F) could be a triangle or a diametric.
Good luck
NEoWave Chart

GOLD The Target Is DOWN! SELL!
My dear friends,
My technical analysis for GOLD is below:
The market is trading on 4022.7 pivot level.
Bias - Bearish
Technical Indicators: Both Super Trend & Pivot HL indicate a highly probable Bearish continuation.
Target - 4010.3
Recommended Stop Loss - 4030.0
About Used Indicators:
A pivot point is a technical analysis indicator, or calculations, used to determine the overall trend of the market over different time frames.
Disclosure: I am part of Trade Nation's Influencer program and receive a monthly fee for using their TradingView charts in my analysis.
———————————
WISH YOU ALL LUCK

Trade idea on xauusdSell at current market price near 3975.00
Use the parameters on the chart for the SL and Tp
Apply proper risk management

1500 Pips – No One Does It Like UsWhile others talk — we execute.
Every pip tells a story of patience and precision. ⚡
Stay hungry, stay humble, and let your results speak louder than words. 💎
✨ Precision. Patience. Profit.

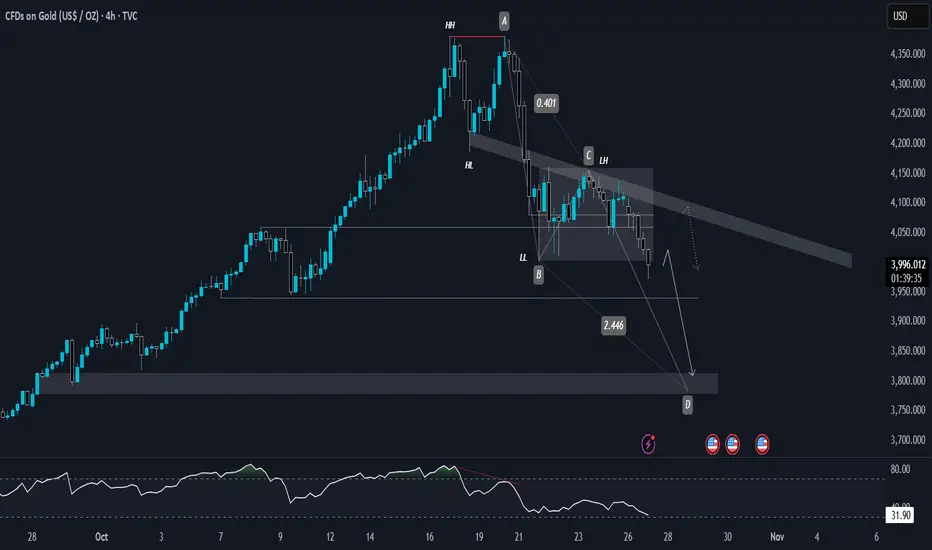
GOLD 4H | Harmonic AB=CD Bearish Reversal in PlayGold recently formed a clear double top at the all-time high (ATH), accompanied by a bearish divergence on higher timeframes — signaling exhaustion of bullish momentum. That divergence has played out perfectly, aligning with the current bearish market structure.
The price has now broken below the key accumulation range between 4000 and 4149, confirming a shift in sentiment. With the trend consistently printing lower lows (LL) and lower highs (LH), the overall market bias remains bearish.
🔹 Technical Breakdown
We currently have a bearish AB=CD pattern completing near the 3800 zone, which aligns with the Fibonacci golden ratio (0.618) on the D leg.
Although AB=CD is traditionally a bullish harmonic pattern, here it’s being used within a downtrend context to identify a potential reversal or continuation zone — depending on market reaction at D.
Key Zone to Watch:
🟡 3800 – 3840 → Major potential reaction zone (Fib confluence + AB=CD completion).
If sellers hold this level, we could see further downside momentum.
🔹 Daily Chart View
On the daily timeframe, bullish momentum looks weak — every recovery candle is smaller, and volume favors sellers. With the AB=CD pattern confirmation and price failing to reclaim the 40050 zone, the bias stays bearish.
🔹 Weekly Chart Insight
Historically, gold tends to retrace after 9 consecutive straight bullish weekly candles.
From 1990 to 2025, each 9-week rally phase has been followed by a notable correction ranging from 6% to 14%, showing that extended rallies often precede profit-taking phases.
This current rally phase mirrors that same behavior patterns — making a corrective move toward 3800–3700 highly probability.
🧭 Final BIAS
The technical confluence between the bearish structure, double top + divergence, and AB=CD D-leg near golden ratio and 9 week rally gives a high-probability bearish setup.
If 3940 fails to hold, next potential downside target lies near 3900-3775, aligned with long-term structure support.
4H weekly outlookKeeping it simple, expect a minor rise, hit FVG continue down, then a reversal from major support which should cover the news throughout the week. Personally I think we will see a 200 retest from the ATH if it makes it.

Gold vs USD – Bearish Breakout Playbook for Smart Day Traders🏆 GOLD SCALPERS UNITE! XAU/USD Bearish Heist Plan 💰⚡
📊 ASSET OVERVIEW
XAU/USD | Gold vs. U.S. Dollar | Metals Market
Trade Type: Day Trade Setup 🎯
Bias: Bearish 🐻📉
🎭 THE HEIST PLAN
Alright, gold diggers and chart bandits! 👀💎 Time to put on our bearish masks because this precious metal is looking HEAVY! We're eyeing a potential drop from the clouds back down to reality. Let's break down this professional robbery... I mean, trading strategy 😏
🔥 TRADE SETUP BREAKDOWN
🎯 ENTRY ZONE
Entry Price: Market execution available after Moving Average breakout @ $2,740.00
(Wait for confirmation before entering the vault!)
🛑 STOP LOSS
SL Level: $2,860.00
Place your stop loss ONLY after the breakout confirmation at the mentioned price level
⚠️ Risk Disclaimer: This is an aggressive stop placement. Manage your position size accordingly! Not financial advice—trade at your own risk, legends!
🎁 TAKE PROFIT TARGET
TP Level: $2,660.00
LSMA acting as strong resistance zone 💪
Overbought conditions detected on multiple timeframes ⚡
Bull trap potential in play—don't get caught! 🪤
📌 NOTE: These are reference levels based on technical analysis. You're the captain of your own ship! 🚢 Adjust targets and stops according to YOUR risk tolerance and trading plan.
🔍 TECHNICAL ANALYSIS HIGHLIGHTS
✅ Moving Average breakout confirmation required
✅ LSMA resistance convergence zone ahead
✅ Overbought momentum signals flashing
✅ Classic bull trap formation developing
✅ Risk-to-reward ratio favors bears on this setup
💱 CORRELATED PAIRS TO WATCH
Keep your eyes on these bad boys for confluence:
TVC:DXY (U.S. Dollar Index): Inverse correlation—if DXY pumps, gold typically dumps 📉
OANDA:XAGUSD (Silver): Precious metals cousin—usually moves in sync with gold
FX:EURUSD : Risk-on/risk-off sentiment indicator—watch for dollar strength 💵
COMEX:GC1! Futures: Direct gold futures contract for institutional flow confirmation 📊
Key Correlation Point: Strong dollar = Weak gold. Watch DXY breakouts and EUR/USD weakness for additional bearish confirmation on XAU/USD! 🎯
⚡ RISK MANAGEMENT REMINDER
Listen up, trading thieves! 🎩 This setup has a wider stop loss, which means:
Position sizing is CRITICAL 🔐
Never risk more than 1-2% of your account per trade
The market doesn't care about your feelings—protect that capital! 💪
Partial profit-taking is your friend on the way down 📊
📢 FINAL WORDS
Gold bugs, this bearish setup is cooking! 🔥 But remember—the market is the ultimate boss, and it doesn't follow our scripts. Stay nimble, stay disciplined, and most importantly, stay profitable! 💎🙌
Watch those key levels, manage your risk like a pro, and let's see if this precious metal comes back down to earth! 🌍📉
✨ If you find value in my analysis, a 👍 and 🚀 boost is much appreciated — it helps me share more setups with the community!
#XAUUSD #Gold #GoldTrading #ForexSignals #TechnicalAnalysis #DayTrading #BearishSetup #MetalsTrading #TradingView #ForexStrategy #GoldAnalysis #PriceAction #SwingTrading #RiskManagement #ForexCommunity #ChartAnalysis #TradingIdeas #MarketAnalysis #GoldForecast #USDOLLAR
⚡ Trade safe, trade smart, and may the pips be ever in your favor! ⚡

GOLD | Awaits CPI Data for Next Direction GOLD | Awaits CPI Data for Next Direction
Gold prices are set for a strong move ahead of the U.S. CPI release.
Key Levels
Pivot: 4,053
Resistance: 4,101 · 4,124 · 4,163
Support: 4,011 · 3,985 · 3,945
Trading Plan
🔼 Buy Setup: Longs valid above 4,053, targeting 4,101 / 4,124 / 4,163 — supported if CPI prints below 3.1%.
🔽 Sell Setup: Shorts valid below 4,053, targeting 4,011 / 3,985 / 3,945 — favored if CPI comes above expectations.
📌 Premium Takeaway
Gold is poised for a strong reaction to inflation data.
A softer CPI favors bullish continuation toward 4,124–4,163,
while a hotter CPI could trigger a bearish correction toward 4,011–3,945.

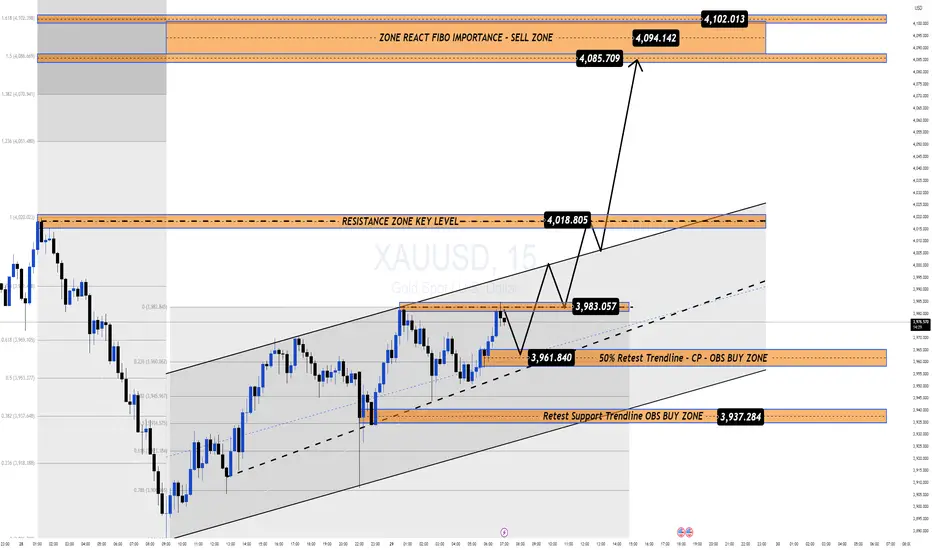
Gold Recovers 1000 Pips Ahead of FOMC: Key Levels in Focus📊 Market Overview
After a sharp selloff that shook long positions, Gold has rebounded nearly 1000 pips, recovering from the 388x area toward 398x ahead of the upcoming FOMC meeting.
Despite the short-term recovery, Gold remains down around 3.5% this week, reflecting cautious sentiment as traders reposition before the Fed decision and amid fading U.S.–China trade tensions.
Currently, price is trading near $3,980–3,990 during the Asian session, consolidating under the psychological $4,000 zone.
💎 Technical Outlook (H1–M15)
Gold continues to trade within a short-term ascending channel, forming a corrective recovery inside a broader downtrend.
Immediate Support Zones:
• 3,961 – 3,937 → Trendline retest & OBS Buy Zone
• 3,918 → Structural invalidation area
Resistance & Key Reaction Levels:
• 4,018 – 4,085 → Mid-term key resistance
• 4,094 – 4,102 → Major Sell Zone (Fibo 1.5–1.618 confluence)
📍If Gold breaks and holds above 4,018, momentum could extend toward 4,085 – 4,102, where strong selling pressure may reappear.
📍If the price rejects at 4,094 – 4,102, expect a corrective move back toward 3,961 – 3,937, aligning with the channel base and trendline retest.
🌍 Macro Context – FOMC Ahead
Markets expect the Fed to cut rates by another 25bps, following September’s “risk management” cut.
However, if Powell’s tone turns hawkish, Gold could face renewed downside pressure as rate-cut expectations fade, particularly for December.
Conversely, a cautious or dovish tone emphasizing inflation risks and slower growth could boost Gold above $4,100 in the short term.
Meanwhile, easing trade tensions between the U.S. and China and the ongoing equity rally may continue to limit safe-haven demand.
🧭 Summary
Gold is holding a short-term recovery bias, yet the medium-term trend remains fragile ahead of the FOMC.
Expect volatility around the 4,000–4,100 zone, with the Fed statement likely to set the next major direction.
🛡️ Stay patient — liquidity builds before clarity, and key reactions around $4,094–4,102 will reveal the next macro impulse.
XAUUSD UPDATEhi everyone
For this upward movement, the first resistance is at the 3494 level. A breakout at this level would also coincide with a breakout of the trendline. If both the trendline and resistance are broken, the price is likely to move toward the next resistance at 4984. The target price could reach the 61.8% Fibonacci retracement level.
I’m also interested in entering a long position around the 3862 area. However, if the support at 3884 breaks, I will reconsider the setup
good luck all
**My trading strategy is not intended to be a signal. It's a process of learning about market structure and sharpening my trading my skills also for my trade journal**
Thanks a lot for your support

Balances and Imbalances in Gold🔴 Why Point of Control (POC) Acts as Strong Support or Resistance to Create a Balance
In a Volume Profile, the Point of Control (POC) represents the price level where the highest traded volume occurred during a specific period. This level attracts attention because it reflects the fairest price accepted by both buyers and sellers.
➥ In an Uptrend:
When the market is trending higher, previous POCs often act as strong support zones. Traders who missed earlier entries tend to buy when price revisits these high-volume levels, believing them to be fair-value areas within the broader uptrend. Moreover, institutional participants often reload positions near the POC since liquidity is abundant there.
In short, when price revisits a past POC during an uptrend, demand tends to emerge again, creating a bounce from that level.
➥ In a Downtrend:
Conversely, in a downtrend, previous POCs act as strong resistance zones. What was once a fair price for buyers now becomes a fair price for sellers. Market participants who were trapped at higher levels use these zones to exit or add fresh short positions. Thus, when price rallies toward a prior POC, supply often re-enters, leading to rejection or a pullback. In this backdrop, let's discuss Gold chart.
🔴 Gold Chart Analysis in This Context
In the above 1H chart of Gold, the relationship between price and POC is clearly visible.
➥During the earlier part of the chart, Gold is in an uptrend. Each time the price retraced, it found support around the previous session’s POC. These levels acted as liquidity zones, where strong buying interest reappeared, helping the price continue its upward leg. This repetitive structure created a classic “staircase” pattern - each rally was followed by a controlled pullback to the prior POC, confirming the zone as a demand base.
➥However, as momentum shifted, Gold entered a downtrend. In this phase, the same POC logic flipped - price began reacting bearishly around previous POCs. Each time the market attempted to rally, it stalled or reversed near those old value areas, signaling that sellers were defending the former fair-value levels. This behavior turned prior supports into resistance shelves, reinforcing the bearish control.
➥Currently, price seems to be retesting one such POC zone near the $4000 zone. If sellers maintain control, the next leg lower could unfold toward the next lower-volume pocket or untested POC zone. But before that we need some sign of weakness near 4000- shortening of the thrust/lack of buying interest/impulsive selling etc. before pulling the trigger or else 4125 to 4150 might be on the cards.
What do think at this point? Will it pass through the resistance zone or react sharply back to 3900.
Do comment and 🚀

Gold Holds Firm Ahead of FOMC DecisionGold has shown a clear break of structure (BOS) on the 1H timeframe, confirming a shift from a previous downtrend into a bullish continuation phase. After rebounding from the support area, the price is holding above both moving averages, signaling strong buying interest. A short-term consolidation phase could lead to another upside move toward the next resistance zone as long as support holds.
Key Levels:
Buy Entry: 4000
Take Profit: 4070
Stop Loss: 3960
Reasoning:
Technically, price action confirms a trend reversal with multiple bullish structure breaks (BOS 1H & 2H) and consistent higher lows. Buyers continue to defend the support area, keeping momentum aligned with the broader bullish bias.
Fundamentally, softening U.S. dollar sentiment and stable Treasury yields support gold’s recovery, as traders look for safety ahead of key U.S. economic data and the upcoming FOMC communication.
Disclaimer:
This analysis is for educational purposes only and does not constitute financial advice.

XAUUSD: A Potential Reversal on the HorizonOANDA:XAUUSD The price has been on a steady decline, but there's a shift happening. Sellers have tried to push the price even lower twice, but both attempts were met with strong rejection at nearly the same price level. This is forming a Double Bottom, a classic signal that the downward momentum is losing power.
Now, all focus is on the neckline. A decisive breakout and a close above this level will not only confirm the pattern but could also spark a significant rally toward the 4,135 target.
If this happens, we could be looking at the beginning of a powerful trend reversal. The market is gearing up for a move, and this is where it gets exciting.

Gold's downward trend shows no signs of stopping sell on ralliesGold prices priced in the Fed's rate cut expectations yesterday, and quickly retreated after the data release. The bullish momentum was short-lived. After gold prices broke through $4000, almost everyone in the market believed a rebound was imminent. However, I maintain my view: yesterday's rebound was merely a corrective bounce after a sharp decline, just a sign of market recovery. The market is only rebounding, not reversing. Our short positions bought at 4020 have yielded substantial profits; you can refer to my post yesterday to verify its accuracy. The overall trend for gold remains bearish and volatile. Today, during the Asian session, we recommend selling on any rebounds.
The 1-hour moving averages for gold continue their downward crossover and bearish alignment, and the price has now fallen back below the moving averages, indicating that the bears are still slightly stronger. After the Fed data release, the price quickly retreated after reaching 4007, and the resistance at the 4000 level suggests that selling on rallies is the best strategy. The bulls failed to hold above 4000, and the bears have the upper hand.
Market conditions are constantly changing. Now that the bullish expectations have been priced in, gold has returned to a weak trend, and there is still room for further decline. The gold correction will continue.
Today's trading strategy: Short gold at 3985-3995, with a target of 3930-3920.

Gold Intraday Trading Plan 10/27/2025As pointed out in my weekly post, I am expecting gold to rise and looking to buy for this week. Currently gold just opened the week with a gap down and this could be a sign of ultimate bottom for this week. However, there is a possibility of stop hunting which may trigger a rapid drop and recover in Europe session.
Therefore, I will not engage any buying order between 4000 and 4150. I will look to buy if 4150 is broken, targeting 4200. However, if 4000 is broken, the setup is invalidated.
New Impulse Wave Started, wave 3 run up? It looks like we are entering sub wave 1 of Wave 3 of the current impulsive wave.
Watch all of the usual fib extension
0.786 ~ $4025
1.00 ~ $4045
1.272 ~ $4071
1.618 ~ $4103
Good luck to all !

Channel Resistance Holding - Short OpportunityHello Followers, I am going to share you my opinion on gold next move..
Gold is working in a parallel channel couple of days, gold has formed a proper channel, it is respecting lower lows and lowers highs. gold Current Price is 3975.. It is possible that now gold fly high till the resistance area 4020/4045. And then it will form an other an otherwise around the target area 3850. If gold break the resistance then we have an stoploss around4090..
KEYPOINTS:
Current Price 3975
Target Area 3850
Resistance area 4020/4045
Stop Loss Point 4090


XAUUSD 4H Analysis (29th October 2025) ASIAN/LONDON
BUY/SELL SCENARIOS:
BUYS:
Body Candle Close above the 4019.80 level.
2) Retest the failed 4h Bearish OB at the 4019.80 level.
3) Create a 5/15m Bullish Engulfing Candle to capitalise on BUYS towards the 4161.40 level.
SELLS:
1) Retest the 4h Bearish OB at the 3973.28 level.
2) Create a 5/15m Bearish CHOCH with a body candle close (with a FVG)
3) Retest the 3/5m Bearish CHOCH Level to capitalize on SELLS towards the 3838.00 level.
Trade smart, Trade safe, Trade according to your trading plan always. Cheers

GOLD 3HR LINE CHART THE BREAKOUT OF 4059-4055 TRENDLINE BY LONDON /NEWYORK SELLERS WILL BE LOOKING FOR DISCOUNT IN THE PRICE OF GOLD .
CHINA-US TENSION COOLS OFF,BUT FOMC NEXT MONETARY POLICY DECISION IS CAUSING CAUTION IN LONG POSITION FOR THE YELLOW METAL.
RATE HOLD ,RATE HIKE OR CUT ,NO ONE CAN TELL TILL THE MEETING IS OVER.
DEMAND FLOOR 3991-3984. breakout of this zone the next possible support will be 3945-3940 (zone by zone strategy).
DEMAND FLOOR 3945-3940.
GOLD LONDON /NEWYORK BUY ZONE COULD BE 3945-3940 ZONE .i see a strong double confluence where a descending trendline meets a horizontal support structure,
risk management is key,if price rally at this zone,learn to take profit and protect your capital
