Gold Price in Free Fall👋Hello everyone, let’s take a look at OANDA:XAUUSD and see what’s happening!
At the time of writing, the precious metal continues to move within a downward wave. At one point, gold dropped close to the $4,000 mark, down more than $350 compared to the same time in the previous session — a decline of nearly 5%.
This marks the sharpest drop after nine consecutive weeks of gains. The main reasons behind this move are the strengthening U.S. dollar, profit-taking pressure, and diminishing caution as U.S.–China trade tensions show signs of easing.
In addition, optimism over the potential reopening of the U.S. government, reduced political uncertainty, and improving trade sentiment have lessened investors’ urgent demand for safe-haven assets like gold.
From a technical perspective: Gold had previously fallen after forming a double-top pattern, breaking through several key support levels. It is now reacting around $4,100, gaining temporary momentum from the $4,000 support zone.
In the short term, I expect a minor rebound before the downtrend may resume, but from a medium to long-term view, I remain optimistic, supported by expectations that the Fed will soon ease monetary policy, Trump’s tariff measures, and continued gold buying by central banks.
What about you — how do you see gold’s next move today? 💬Share your thoughts in the comments below.
Good luck and happy trading!
Trade ideas

4 Best Forex Gold Trading Strategies For Beginners
If you just started trading and looking for a winning strategy to trade, I prepared for you 4 simple and profitable forex trading strategies for beginners.
1. Harmonic Strategy
With that strategy, you will trade harmonic patterns.
Here is the list of the most powerful ones:
Bullish/Bearish Gartley pattern,
Bullish/Bearish Bat pattern,
Bullish/Bearish Cypher pattern.
To properly apply the Harmonic Strategy you should learn just 3 things: Fibonacci numbers, impulse legs and the rules of harmonic patterns.
That strategy is very simple: it works on any time frame and your only task is to recognize the harmonic pattern and trade it strictly following the rules .
2. Trend Following Strategy
That strategy is price action based.
To properly apply that, you should learn trend analysis rules and how to identify price action legs.
Once you spotted that the market is trading in a bullish/bearish trend, your task will be to wait for a completion of a correctional movement to buy/sell t he market expecting a trend continuation.
That strategy works on any time frame, however, my recommendation is to trade 4H time frame or higher.
3. Structure Breakout Strategy
That strategy is based on structure analysis.
To properly apply Breakout Strategy , you should learn to identify key vertical and horizontal structures: supports and resistances.
Your task will be to look for a confirmed structure violation with a candle close beyond that.
Bullish breakout of a key resistance will be a signal for you to buy, expecting a bullish movement to the next resistance, while a bearish breakout of support will push the prices lower to the next structure support.
That strategy works on any time frame, however, my recommendation is to trade 4H time frame or higher.
4. Trend Reversal Strategy
That strategy is price action based.
To use it properly, you should learn trend analysis and trend reversal rules.
Your task will be to look for a confirmed trend reversal . It will lead to an initiate of a new trade and give you a perfect opportunity to catch an extended movement.
What I like about these strategies, is that while you trade with them, you master structure and price action analysis. 2 essential components of any sophisticated professional strategy.
Master one of these strategies and then modify that with experience, adding some extra layers of analysis.
Let me know which strategy do you like the most?
❤️Please, support my work with like, thank you!❤️
I am part of Trade Nation's Influencer program and receive a monthly fee for using their TradingView charts in my analysis.

GOLD 4H CHART ROUTE MAP UPDATE & TRADING PLAN FOR THE WEEKHey Everyone,
Please see our updated 4h chart levels and targets for the coming week.
We are seeing price play between two weighted levels with a gap above at 4173 and a gap below at 4079. We will need to see ema5 cross and lock on either weighted level to determine the next range.
We will see levels tested side by side until one of the weighted levels break and lock to confirm direction for the next range.
We will keep the above in mind when taking buys from dips. Our updated levels and weighted levels will allow us to track the movement down and then catch bounces up.
We will continue to buy dips using our support levels taking 20 to 40 pips. As stated before each of our level structures give 20 to 40 pip bounces, which is enough for a nice entry and exit. If you back test the levels we shared every week for the past 24 months, you can see how effectively they were used to trade with or against short/mid term swings and trends.
The swing range give bigger bounces then our weighted levels that's the difference between weighted levels and swing ranges.
BULLISH TARGET
4173
EMA5 CROSS AND LOCK ABOVE 4173 WILL OPEN THE FOLLOWING BULLISH TARGETS
4264
EMA5 CROSS AND LOCK ABOVE 4264 WILL OPEN THE FOLLOWING BULLISH TARGET
4333
EMA5 CROSS AND LOCK ABOVE 4333 WILL OPEN THE FOLLOWING BULLISH TARGET
4333
EMA5 CROSS AND LOCK ABOVE 4333 WILL OPEN THE FOLLOWING BULLISH TARGET
4422
EMA5 CROSS AND LOCK ABOVE 4422 WILL OPEN THE FOLLOWING BULLISH TARGET
4494
BEARISH TARGETS
4079
EMA5 CROSS AND LOCK BELOW 4079 WILL OPEN THE SWING RANGE
3985
3873
EMA5 CROSS AND LOCK BELOW 3873 WILL OPEN THE SECONDARY SWING RANGE
3741
3632
As always, we will keep you all updated with regular updates throughout the week and how we manage the active ideas and setups. Thank you all for your likes, comments and follows, we really appreciate it!
Mr Gold
GoldViewFX

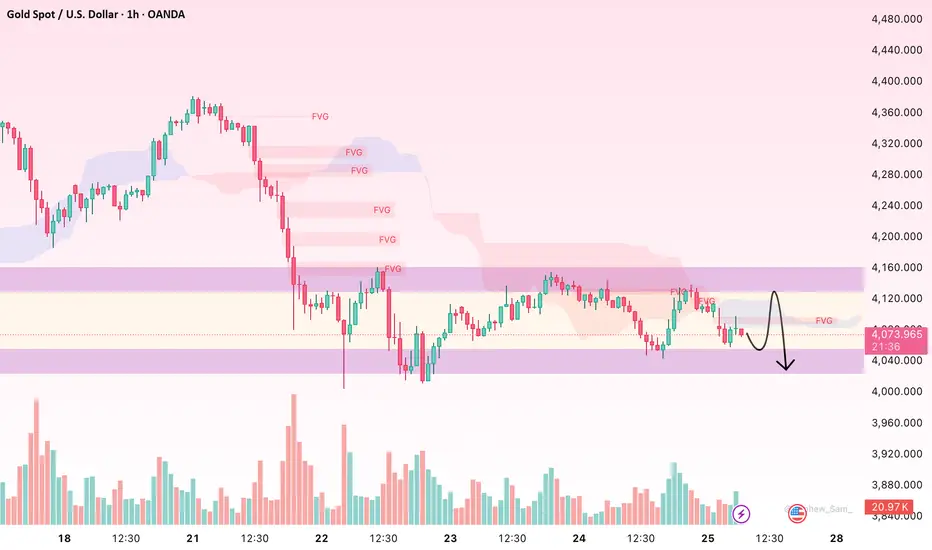
Gold consolidates after sharp decline – key levels aheadHello everyone, gold (XAU/USD) is trading around $4,080 after a drop of nearly 7.6% from the $4,380 peak. The decline has paused and the market has moved into a narrow consolidation zone between $4,050 – $4,120, reflecting cautious sentiment before choosing the next direction.
On the 1H chart, we can clearly see a series of Fair Value Gaps (FVG) still lying above price, especially around $4,110 – $4,160 and $4,240 – $4,280 – areas of liquidity that have not yet been reclaimed. However, price remains below the Ichimoku cloud, which means the dominant trend is still bearish. Selling pressure has cooled down, but buyers are not strong enough yet to trigger a confirmed reversal. Trading volume is gradually decreasing, showing that the market is waiting for a catalyst from macro news – consistent with the current environment as investors monitor US–China trade developments and upcoming US economic data.
Structurally, the current bounce appears more like a technical correction rather than a meaningful trend reversal. Gold could continue to recover toward $4,120 – $4,140 to fill nearby FVGs, but this is also a close resistance area where sellers are likely to reappear. If price gets rejected here, $4,040 – $4,000 becomes the next liquidity sweep target. And if $4,000 breaks, the bearish extension could reach $3,960 – $3,920 – a key H4 equilibrium zone where strong demand previously stepped in.
In the short term, I don’t see a sustainable bullish trend unless the Fed signals earlier-than-expected rate cuts or a major geopolitical shock re-ignites safe-haven demand. Without a strong catalyst, the most reasonable scenario is continued consolidation within the $4,000 – $4,200 range before the next major move develops.
What do you see here – technical recovery or a bull trap before the next leg down?
GOLD → Correction after aggressive growthFX:XAUUSD is in a correction phase after a month and a half of aggressive growth. The price is forming a trading range and continues to storm support...
The record growth was overheated, and traders are closing long positions. A gradual change in the fundamental background and market sentiment is also provoking an outflow of funds. However, US-China negotiations, the ongoing US shutdown, and the tense geopolitical situation, including the cancellation of Trump's meeting with Putin, create additional risks in the economy, which may support the metal.
The correction in gold looks like a healthy pause. The $4,000 level remains key support. A recovery above $4100 indicates continued buyer interest, but further dynamics depend on news about trade negotiations.
Resistance levels: 4082, 4107, 4163
Support levels: 4059, 4000
A breakdown of the trading range support could trigger further sell-offs. Focus on 4000K, aggressive reaction possible. At the moment, the market is falling as aggressively as it rose. We need to wait for the price to slow down in order to make reasonable technical decisions.
Best regards, R. Linda!

Gold 1H – Bearish Reaction After Consecutive Gains🟡 XAUUSD – Intraday Trading Plan | by Ryan_TitanTrader
📈 Market Context
After several sessions of steady gains, gold is showing signs of exhaustion as U.S. Treasury yields stabilize and traders reassess the Federal Reserve’s next move.
The market’s focus today is on U.S. housing data and Fed officials’ remarks, which could shape expectations for the December policy outlook.
• A hawkish tone from policymakers may strengthen the dollar and pressure gold lower.
• Conversely, softer remarks could briefly trigger buying around key discount zones, but the overall tone remains corrective after the recent rally.
Market liquidity is concentrated near the $4,230 area — where price may tap into unmitigated supply before continuing its bearish leg.
🔎 Technical Analysis (1H / SMC Style)
• Structure: The overall bias has shifted bearish following consecutive ChoCH and BOS formations.
• Premium Zone: The 4,230–4,228 area aligns with an H1 order block and previous liquidity pool — a prime zone for short re-entry.
• Liquidity Sweep: The recent upside push toward 4,230 may sweep late buyers before the next bearish leg unfolds.
• Discount Zone: Short-term liquidity may rest around 4,080–4,100, which aligns with previous sell-side imbalance (SSI) and acts as an intraday reaction zone.
🔴 Sell Setup
• Entry: 4,230 – 4,228
• Stop-Loss: 4,240
• Take-Profit Targets: 4,100 → 4,080 → 4,050+
🟢 Buy Scalp Setup (Short-Term Countermove)
• Entry: 4,081 – 4,083
• Stop-Loss: 4,074
• Take-Profit Targets: 4,100 → 4,115
(Only valid if liquidity sweep confirms reaction within discount zone)
⚠️ Risk Management Notes
• Confirm M15 BOS/ChoCH before entry — avoid blind orders during news.
• Reduce position size for scalp entries; primary directional bias remains bearish.
• Lock partial profits near first liquidity targets and trail stops as structure confirms continuation.
✅ Summary
Gold faces near-term correction pressure after multiple bullish sessions.
The 4,230–4,228 zone offers a clean premium OB entry for continuation shorts, while reactive buyers may scalp intraday from 4,081 if liquidity sweeps occur.
Stay adaptive — today’s sentiment is short-term bearish within a larger range-bound structure.
FOLLOW RYAN_TITANTRADER for daily SMC setups ⚡

Lingrid | GOLD Consolidation Period Following Retracement ?OANDA:XAUUSD is pulling back after a failed retest of the 4,380 resistance zone, showing weakness at the upper boundary of the market structure. The market forms a descending correction within a potential consolidation phase following pullback, staying below the downward trendline. Price may attempt a rebound toward upper zone of consolidation at 4,135 before another wave up if momentum remains neutral. Overall, gold reflects a temporary correction inside a broader upward trend.
⚠️ Risks:
A sustained break below 4,000 would shift short-term sentiment back to bearish.
Unexpected shifts in US inflation or bond yields could spark sell off gold.
Thin liquidity may trigger false breakouts within the consolidation range.
If this idea resonates with you or you have your own opinion, traders, hit the comments. I’m excited to read your thoughts!

Gold Bull Market Outlook And Targets: 5000 USD/7500 USDGold Bull Markets Long Term Overview and 2025 Market Update
________________________________________
🌊 Five-Wave Roadmap — Targets & Timing
• Wave 1 (2016–2020): From ~$1,050–1,200 to the COVID-era spike; established secular up-trend.
• Wave 2 (2020–2022): Consolidation/corrective pullback (~–20%).
• Wave 3 (2023–2025/26): Power leg to ATHs (current). Room to extend toward $4,200–$4,500 on flow surges before pausing.
• Wave 4 (2026, base case): Re-accumulation/consolidation ~12 months; likely range-bound –10% to –15% from the Wave-3 peak as institutional buying digests gains.
• Wave 5 (2027–2030/32): Final thrust to the cycle’s terminal zone:
– First objective: $5,000–$5,500 (consistent with 2026 Street “bull wave” scenarios).
– Terminal extension: $7,500–$8,000 by 2030–2032 (our desk’s stretch path if real yields stay muted, official-sector demand persists, and private capital rotation broadens).
Why Wave-4 can last ~12 months: prior secular bulls often paused for a full year near major breakouts while flows “change hands.” Expect lower realized vol, fading retail FOMO, and steady official accumulation to define the tape.
📈 Top 10 Stats of the Current Bull 2025
1. Price & ATHs: Spot ~$3.75–$3.79k; fresh ATH $3,790.82 on Sep 23, 2025.
2. 2025 YTD: Roughly +40–43% YTD
3. Central Banks: 1,045 t added in 2024 (later revised to ~1,086 t as lagged data came in). H1/Q1’25 tracking remained elevated.
4. ETF Flows: Back-to-back strong quarters; Q2’25 total demand 1,249 t, value US$132bn (+45% y/y) with ETFs instrumental.
5. Gold vs Equities: Gold ≈+40% vs S&P 500 ≈+13% total return YTD.
6. Jewelry Demand: Tonnage softened as prices surged; value at records (2024 down y/y; weakness persisted into H1’25).
7. Gold–Silver Ratio: ~85–88 (silver torque improving as it pushes into the mid-$40s).
8. Macro Link: Safe-haven bid + expected policy easing keep real-yield headwinds contained.
9. Technical: Confirmed 13-yr cup-and-handle breakout (Mar ’24) underpinning trend.
10. Street Forecasts: GS baseline $4,000 by mid-’26; bulled-up houses (HSBC/BofA) flag $4.9–$5.0k potential into 2026 if private/ETF rotation persists.
• This cycle is different: record central-bank buying + renewed ETF inflows + lower real rates = powerful tailwind.
• Price: Gold notched fresh ATHs this month (up to $3,790.82). 2025 is shaping up as the strongest year since the late 1970s.
• Relative: Gold is crushing equities YTD (≈+40% vs S&P 500 ≈+13% total return).
• Setup: A 13-year “cup-and-handle” breakout in 2024 kick-started the move.
• Outlook: Street base cases cluster near $4,000 by mid-’26; several houses now publish $4,900–$5,000 stretch targets into 2026 as flows accelerate.
________________________________________
🏆 Historic Gold Bull Markets — Timeline & Stats
1. 1968–1980 “Super Bull”
• Start/End: ~$35 → $850 (Jan 1980)
• Gain: ~2,330%
• Drivers: End of Bretton Woods, oil shocks, double-digit inflation, geopolitical stress.
• Drawdown: ~–45% (1974–1976) before the final blow-off run.
2. 1999–2011/12
• Start/Peak: ~$252 (1999) → ~$1,920 (2011–12)
• Gain: ~650%
• Drivers: Commodities supercycle, EM demand, USD weakness, GFC safe-haven bid.
3. 2016/2018–Present (The “CB-Led” Cycle)
• Start Zone: $1,050–$1,200 → New ATH $3,790 (Sep 2025)
• Gain: ~215–260% (depending on 2016 vs 2018 anchor)
• Drivers: Record central-bank accumulation, sticky inflation/low real rates, geopolitics; 2024 13-yr base breakout.
________________________________________
📊 At-A-Glance Comparison (Updated 2025)
Metric | 1968–80 Super Bull | 1999–2012 | 2016/18–2025 Current
🚀 Total Gain | ~2,330% | ~650% | ~215–260% (so far)
⏲️ Duration | 12 yrs | 13 yrs | 7–9 yrs (ongoing)
💔 Max Drawdown | ~–45% (’74–’76) | ~–30% (’08) | ~–20% (2022)
🏦 Main Buyer | Retail/Europe | Funds/EM | Central Banks
🏛️ Pattern | Secular parabolic | Cyclical ramps | 13-yr base → breakout (’24)
Notes: current-cycle characteristics validated by WGC demand trends & the 2024 technical breakout.
________________________________________
________________________________________
________________________________________
🔄 What Makes This Bull Different 2025 Edition
• 🏦 Central-Bank Dominance — Third consecutive 1k+ tonne year in 2024; 2025 is still tracking strong on a run-rate basis. This “sticky” demand is from price-insensitive reserve managers.
• ⚡ Faster Recoveries — Drawdowns are shallower/shorter vs the 1970s analog, consistent with a structural rather than speculative buyer base.
• 📈 Coexisting With Risk Assets — ATHs with equities positive YTD = macro hedge + diversification bid, not just “panic buying.”
• 📐 Structural Breakout — 13-yr base cleared in 2024; market now in multi-year price discovery.
________________________________________
🎯 Strategy Ideas 2025 & Beyond
• Buy/Hold on Dips: Stagger entries (DCA) into physical (allocated), ETFs (e.g., GLD/IAU), and quality miners/royalties.
• Prefer Physical/Allocated where counterparty risk matters; use ETFs for liquidity and tactical tilts.
Satellite/Leverage
• Silver & GSR Mean-Reversion: With GSR ~85–88, silver historically offers torque in up-legs. Pair with high-quality silver miners.
• Factor Tilt in Miners: Prioritize low AISC, strong balance sheets, reserve growth, rule-of-law jurisdictions; emphasize free-cash-flow yield and disciplined capex.
Risk-Management
• Define max drawdown per sleeve; pre-plan trims near parabolic extensions or if macro invalidates (e.g., real-yield spike).
• Use options overlays (collars on miners; long-dated calls on physical proxies) to shape payoff in Wave-3 late innings and Wave-4 digestion.
________________________________________
🧪 Reality Check: What Could Invalidate the Bull?
• Real yields + USD rip higher (sustained) → compress gold’s opportunity cost.
• Official-sector buying stalls (policy or FX-reserve shifts) → removes the anchor bid.
• Growth re-acceleration + faster-than-expected disinflation → weaker safe-haven + fewer rate cuts.
• Technical break: a persistent move below ~$3,600–3,700 would question Wave-3 extension and pull forward Wave-4.
________________________________________
🧭 Quick Reference Tables
🧾 Summary: Historic vs Current
Feature | 1968–80 | 1999–2012 | 2016/18–2025
Total Gain | ~2,330% | ~650% | ~215–260%
Duration | 12 yrs | 13 yrs | 7–9 yrs (ongoing)
Correction | ~–45% | ~–30% | ~–20% (’22)
Main Buyer | Retail/Europe | Funds/EM | Central Banks
Pattern | Parabolic | Cyclical | Cup & Handle → Secular
🧩 “If-This-Then-That” Playbook
• If real yields fall & CB buying persists → Ride trend / add on consolidations.
• If USD + real yields jump → Trim beta, keep core hedge.
• If GSR stays >80 with silver momentum → Overweight silver sleeve for torque.
________________________________________
🔚 Key Takeaways Updated
• Twin pillars: relentless official-sector demand + 2024 structural breakout.
• Base case: Street ~$3.7–4.0k by mid-’26 with upside to $4.5–5.0k on accelerated private/ETF rotation.
• Roadmap: Extend Wave-3 → Wave-4 re-accumulation (~12 months) → Wave-5 to $5,000–$5,500, then $7,500–$8,000 by 2030–2032 under favorable macro/flow dynamics.
• Operating stance: keep core, add on dips/sideways phases, manage beta and drawdowns proactively.

Gold ready for another spike 4380Gold (XAU/USD) is holding above the support trend line, showing potential for a bullish rebound. As long as price stays above the 4,220 support area, it may target the next resistance near 4,380.

XAUUSD: Bullish Momentum Still Intact After a Healthy PullbackHello everyone, here is my breakdown of the current Gold setup.
Market Analysis
The broader trend for Gold remains strongly bullish, as we can clearly see from the consistent upward channel that has been forming since mid-September. Each corrective phase has been followed by a decisive breakout, confirming buyers’ control and sustaining the uptrend.
Recently, the market broke out from the upper boundary of the range near 4020, establishing a new structural high close to the 4250 resistance zone. However, after reaching this zone, the price entered a correction phase, pulling back to retest the major support zone around 4050–4020 — a level that also aligns with the lower boundary of the ascending channel.
My Scenario & Strategy
At the moment, the price is stabilizing around the support zone, showing early signs of a potential bullish rebound. This zone has acted as a strong demand area throughout the uptrend, and I expect buyers to defend it once again. If the price confirms a bounce from this level, the next logical move would be a continuation towards the 4215 resistance zone, which also aligns with the mid-level of the previous range.
I remain bullish on Gold while the price holds above the 4020 support zone. A successful retest here would provide a good opportunity for long positions targeting 4215 initially. If the price fails to hold above this level, we could see a deeper pullback — but as long as the channel structure remains intact, the broader bias stays positive.
That's the setup I'm tracking. Thank you for your attention, and always manage your risk.

Gold Defends the 4000 Zone Again — Eyes on 4160 Break for 4350 RGold Defends the 4000 Zone Again — Eyes on 4160 Break for 4350 Retest”
Yesterday, gold tested the 4000 price level for the second time and bounced back up, showing that the market is not ready to fall below that old psychological level.
Bullish optimism is rising again and the chances of gold rising further are also increasing.
The fact remains that the Gold continues to be manipulated, but this is the current market, take it or leave it. Since yesterday afternoon, gold has risen by almost 3.15% from 4010 to 4136.
If the price manages to break through 4160, then there is a good chance that it could retest the high near 4350 - 4380.
Overall, nothing has changed since yesterday. It's just that the market is hesitating to push the price up aggressively as before.
You may find more details in the chart!
Thank you and Good Luck!
❤️PS: Please support with a like or comment if you find this analysis useful for your trading day❤️

Gold Pullback or Reversal? Key Zone Ahead!As I expected , Gold ( OANDA:XAUUSD ) started to drop thanks to the Double Top Pattern and reached its target at the Support zone($4,011 – $3,981) .
Now, do you think Gold will start dropping again, or will it resume its recent weeks’ uptrend?
Today, I’m going to do a short-term 15-minute analysis of Gold , so stay tuned.
At the moment, Gold is approaching a Resistance zone($4,192 – $4,137) —also a Potential Reversal Zone (PRZ) —and moving within an ascending channel . Overall, the recent moves in Gold over the past couple of days look like a pullback to the previous Support zone($4,192 – $4,137) .
From an Elliott Wave perspective , it seems that Gold , given the momentum of its recent drop, is completing corrective waves, and we should expect another decline .
I expect Gold to start dropping again from the Resistance zone($4,192 – $4,137) and PRZ , and AFTER breaking the lower line of the ascending channel , it could fall at least down to around $4,039(First Target) .
Second Target: Support zone($4,011 – $3,981)
Stop Loss(SL): $4,222
Please respect each other's ideas and express them politely if you agree or disagree.
Gold Analyze (XAUUSD), 15-minute time frame.
Be sure to follow the updated ideas.
Do not forget to put a Stop loss for your positions (For every position you want to open).
Please follow your strategy; this is just my idea, and I will gladly see your ideas in this post.
Please do not forget the ✅ ' like ' ✅ button 🙏😊 & Share it with your friends; thanks, and Trade safe.

( Gold Protocol ) Bearish Reversal DetectedStatus: Active Reversal Protocol
🆚Symbol: Gold
Session: London–New York Overlap (Smart Exit Window)
Bearish Reversal : 4085
☄️ Volume Surge Confirmed — Sellers dominate exhausted highs
☄️ Session Aligned — Smart money exit window open
☄️ Cluster Shield Active — Supply imbalance verified
☄️ Delta Shift Negative — Buyers trapped above
☄️ POC Retest Completed — Liquidity absorbed at resistance
☄️ Structure Break Pending — Bearish bias confirmed
🚀 Logic: This is engineered reversal, not prediction.
🚀 Objective: Controlled execution with minimal drawdown.
Goal: Controlled Both Sides with minimal drawdown
★★★★★ (Smart Money Aligned)
⤵️ Every like & comment on our Trading View posts helps us grow. More engagement means more exposure ★★★★★ , which benefits everyone in the community!

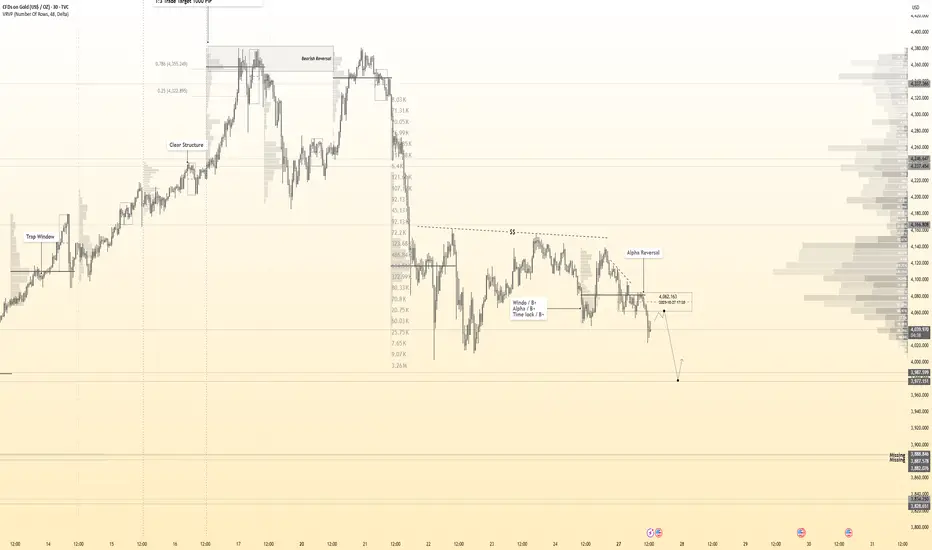
XAU/USD (Gold vs USD) chart on the 4-hour timeframe..XAU/USD (Gold vs USD) chart on the 4-hour timeframe, here’s the analysis based on what’s visible:
My drawn a rising trendline that has been broken to the downside — suggesting a bearish breakout.
The price is currently trading around $4,035, below the Ichimoku cloud (which adds to bearish confirmation).
I have two target points already marked on the chart, showing potential downside levels.
Based on my chart markings:
🎯 Target 1: Around $3,960
🎯 Target 2: Around $3,780 – $3,800
These targets match the measured move from the range of the consolidation (roughly $150–$200) projected downward from the breakout level.
✅ Summary:
Current price: ~$4,035
First target: ~$3,960
Second target: ~$3,780
Bearish bias remains valid while price stays below ~$4,150–$4,200 (the resistance and cloud zone).

THE KOG REPORTTHE KOG REPORT:
In last week’s KOG Report we said we would be looking at two levels as potential for the long trades and target for the short trades. We ideally wanted price to push upside and complete the long target before turning and then completing the short target. During the early part of the week, we activated short and gave caution on longs only to see the aggressive decline which hit our short target and completed our bias level and red box targets for the week.
All in all, a decent week in Camelot with Excalibur guiding and the EA hitting another full house of completed targets on Gold.
So, what can we expect in the week ahead?
We're pondering on this bearish move and it’s giving us hints of a swing low so for that reason we’ve given the red box bias level at 4095 which will need to break for us to see a continuation of the move. Above there, we have immediate support at 4104 which if held can give us another bounce in the early sessions giving us a move upside into the 4140-50 regions initially.
Above that level there is a level sticking out sitting at 4173 with the extension level 4192 which if targeted is the level to keep an eye on for us. A break above there and it’s likely we will attempt to swing high from a lot higher up which we will need to navigate level to level. But a RIP there would be ideal if it happens with a clean reversal.
On the flip, we do want to see lower pricing on gold as we feel it’s not only needed, but it will give buyers better opportunities to get in for better positioning to carry trades upside into the higher target levels we have active. As we approach the end of the month, it's going to be another whipsaw and we would hope to complete the move, or, we'll most likely see some sideways accumulation leading into the next week.
KOG’s bias for the week:
Bullish above 4095 with the ideal target 4274
Bearish below 4095 with the ideal target 4025
RED BOX TARGETS:
Break above 4115 for 4123, 4125 and 4140 in extension of the move
Break below 4095 for 4080, 4065 and 4050 in extension of the move
Please do support us by hitting the like button, leaving a comment, and giving us a follow. We’ve been doing this for a long time now providing traders with in-depth free analysis on Gold, so your likes and comments are very much appreciated.
As always, trade safe.
KOG

Lingrid | GOLD Weekly Support Zone: Short Term Upside MoveOANDA:XAUUSD is approaching the weekly support area near 3,880, suggesting a short-term bullish impulse might be formed within the downward channel. Price action now moved below the 4,050, which aligns with prior breakdown structure and acts as a potential resistance level. As long as price sustains above 3,880, buyers may push toward 4,050 before meeting stronger resistance. Potential rejection near the lower channel boundary may hint at a corrective recovery phase gaining traction.
⚠️ Risks:
Federal Funds Rate decision on could reignite bearish momentum.
Rising Treasury yields may suppress gold’s short-term recovery potential.
Failure to hold above 3,880 would invalidate the short-term bullish scenario.
If this idea resonates with you or you have your own opinion, traders, hit the comments. I’m excited to read your thoughts!

Gold at a Critical Crossroad: Bounce or Breakdown Ahead?Hi!
The gold price is currently trading around $4,042, sitting just above a critical support area near $3,953.80. This gray zone is a key decision point for the next major move.
Trend Structure:
The broader trend remains bullish, moving within a well-defined ascending channel.
Double Top Formation:
A short-term double top has formed near recent highs, triggering a corrective move down into the channel’s midline and the gray support area.
Critical Support Zone ($3,953.80):
This level aligns with previous structure support and the channel’s bottom, making it a high-probability reaction zone.
________________
Scenario 1: Bullish Reaction (Primary Scenario)
If gold holds above the gray critical area and bounces within the ascending channel, we could see a renewed bullish wave.
Confirmation: A strong bullish reaction or higher low around $3,953–$3,980.
Target: The green target zone around $4,619.57, corresponding to the upper channel boundary and a potential measured move from the recent correction.
Scenario 2: Bearish Breakdown
If the gray area fails to hold, it could signal deeper downside momentum.
Trigger: A clean break and 4H close below $3,953.80.
Target: The pink support zone near $3,656.01, which aligns with prior accumulation and the lower channel boundary.
________________
Disclaimer: As part of ThinkMarkets’ Influencer Program, I am sponsored to share and publish their charts in my analysis.

XAUUSD-seeking $4,000 region?As my H4 chart shows, gold did make a double top a few days ago and then crashed. You can give credit for this massive 3,800 points move to profit taking or economic uncertainty or any technical reason, maybe a combination but it really does not matter.
What does matter is that we now have a double or triple top indicating that we have more room to the down side. I am seeing a medium term bearish move followed by a consolidation and now it may be that we will get a breakout (to the down side) to give us a bearish continuation.
How far will we go? I have no idea but the round number 4,000 followed by 3,950 do make sense. If all this works out as I anticipate, it may be a good idea to close a partial position, move the stop to a level of small profit and then trail the price action.

( Gold Protocol ) Bearish Reversal Detected
Status: Active Reversal Protocol
🆚Symbol: Gold
Session: London–New York Overlap (Smart Exit Window)
Bearish Reversal 4062
☄️ Volume Surge Confirmed — Sellers dominate exhausted highs
☄️ Session Aligned — Smart money exit window open
☄️ Cluster Shield Active — Supply imbalance verified
☄️ Delta Shift Negative — Buyers trapped above
☄️ POC Retest Completed — Liquidity absorbed at resistance
☄️ Structure Break Pending — Bearish bias confirmed
🚀 Logic: This is engineered reversal, not prediction.
🚀 Objective: Controlled execution with minimal drawdown.
Goal: Controlled Both Sides with minimal drawdown
★★★★★ (Smart Money Aligned)
XAU/USD (Gold 4H timeframe)... XAU/USD (Gold 4H timeframe) — here’s what’s visible and how it breaks down technically:
Price: Around 4065 USD currently.
Trendline: A major uptrend line has been broken clearly.
Ichimoku Cloud: Price has fallen below the Kumo, confirming bearish momentum.
Support Zone: Between 4120–4160 USD, already broken and retested.
Measured Move (Target Projection): my chart’s extension line points toward a target around 3840–3860 USD.
📉 Target Breakdown:
Immediate support: 4000 USD (psychological round number).
Main target: 3840 USD (as marked on My chart — aligns with previous structure support).
Extended bearish target: If momentum continues, 3740–3760 USD zone may come next.
⚠ Notes:
If gold reclaims above 4160–4180, bearish bias weakens.
Below 4060 = bears in full control.
Below 4000 = confirmation toward your target zone (≈3840 USD).
✅ Final Target: $3,840 – $3,860 USD
Would you like me to give you stop-loss and re-entry zones too (for sell setup)?

GOLD - Stop Trading Gold For NowGOLD - Stop Trading Gold For Now
For now, stay away from gold. I just see that something strange is happening and the reason is just some manipulation and nothing more.
Below is what I am reading, but it doesn't make sense:
💬A thaw in US-China trade relations has kind of pulled the rug out from under the gold price due to a drop in safe-haven buying flows,"
I would suggest to stay away from gold for a while and see what happens first.
⚠️It could be a bull trap and it could fall lower or it could be a bear trap and it could rise aggressively again. It's all happening for no apparent reason.
For the time being gold is positioned like it can drop more but I don't believe it too much
At the moment we have no confirmation on how it could take shape but it is back around a strong area and the psychological price is 3900 - 4000.
You may find more details in the chart!
Thank you and Good Luck!
❤️PS: Please support with a like or comment if you find this analysis useful for your trading day❤️

XAUUSD Long: Bulls Preparing for the Next Impulse Toward 4180Hello, traders! Gold (XAUUSD) continues to move within a strong bullish structure, defined by a clear Ascending Channel. The market has shown steady buyer strength, forming consistent higher highs and higher lows. Along this uptrend, price has broken resistance level — most notably around 3950, turning him into new support zone. After reaching the upper part of the channel near the Supply Zone (around 4250), the price entered a corrective phase, retesting the midline of the ascending channel.
This correction appears healthy within the broader bullish context, as it aligns with previous pivot points and areas where demand has repeatedly returned.
Currently, the market is trading between the Support Zone (around 3950) and the Supply Zone (around 4100–4250). Buyers have recently defended the lower boundary of the channel, suggesting potential continuation to the upside if momentum sustains.
My main scenario anticipates a bullish continuation from the current pivot zone.
If the price successfully holds above the Demand Line and breaks through 4100, I expect a further move toward the 4180–4250 resistance area — which aligns with the top of the channel and prior supply zone.In my opinion, this structure still favors the bulls, and any correction toward 3950 would likely offer a buying opportunity within the prevailing uptrend.Therefore, my target (TP) is set at 4180, aiming for a retest of the channel’s upper resistance line. Manage your risk!

Gold Pullback Could Be the Next Buying OpportunityHello, traders, I want share with you my opinion about Gold. The market for Gold has been trading within a clear bullish structure, forming an ascending channel since breaking out from the earlier range near the 4,050–4,100 zone. The breakout from that consolidation led to strong upward momentum, with price making consistent higher highs and higher lows. Recently, the market faced strong selling pressure from the Seller Zone near 4,366, which aligns with the Resistance Level. After a retest of this supply area, price rejected and started a correction within the channel. The price is approaching the Buyer Zone around 4,205, which also coincides with the lower boundary of the ascending channel and the previous support level. This confluence makes the area significant for potential bullish reactions. I expect Gold to retest the Buyer Zone (4,205) and, if buyers show strength, a bounce toward 4,320–4,366 could follow. This would represent the continuation of the uptrend within the ascending channel. However, if price breaks below 4,205, it would signal a possible shift in structure and open the door for a deeper correction toward the 4,100 area. Please share this idea with your friends and click Boost 🚀
