Gold 1H – Bullish Rebound After Strong Correction🟡 XAUUSD – Intraday Trading Plan | by Ryan_TitanTrader
📈 Market Context
Gold is attempting to rebound near $4,320 after a sharp correction earlier this week, as traders weigh the recent pullback in U.S. Treasury yields and renewed expectations of a dovish Federal Reserve tone.
Markets are now positioning ahead of key U.S. housing and manufacturing data, which could shape short-term sentiment for both the dollar and real yields.
• Softer economic numbers may reinforce the case for policy easing in early 2026, supporting gold’s safe-haven appeal.
• Conversely, stronger data could momentarily pressure XAUUSD, yet the broader uptrend remains intact amid central-bank accumulation and geopolitical tension.
Expect a liquidity-driven environment, with price potentially sweeping lower before reclaiming bullish momentum.
🔎 Technical Analysis (1H / SMC Style)
• Structure: Overall bias remains bullish following consecutive Breaks of Structure (BOS) and a confirmed Change of Character (ChoCH) indicating corrective retracement.
• Discount Zone: The $4,270–$4,272 demand area sits within the discount zone of the recent range (swing low to 4454 high), ideal for re-accumulation.
• Liquidity Sweep: Recent wicks near $4,300 suggest liquidity has been collected, potentially setting up for another bullish push.
• Premium Zone: Upside liquidity clusters near $4,454–$4,452, aligning with a premium supply area where short-term selling may appear.
🔴 Sell Setup
• Entry: 4454 – 4452
• Stop-Loss: 4463
• Take-Profit Targets: 4400 → 4330
🟢 Buy Setup
• Entry: 4270 – 4272
• Stop-Loss: 4260
• Take-Profit Targets: 4340 → 4380 → 4450 +
⚠️ Risk Management Notes
• Wait for M15 BOS/ChoCH confirmation before triggering entries.
• Avoid entries during high-volatility windows around U.S. data releases.
• Secure partial profits near intermediate liquidity zones, trail stops after BOS confirmation.
✅ Summary
Gold maintains a bullish re-accumulation structure following a healthy correction.
A retest into the discount zone around $4,270 offers potential long entries targeting the premium zone near $4,450+.
Only a decisive break below $4,260 would invalidate the intraday bullish scenario.
FOLLOW RYAN_TITANTRADER for more SMC trading insights ⚡
Trade ideas

GOLD → A psychologically important level of $4,000 lies aheadFX:XAUUSD continues to correct, unable to consolidate above $4,100, with the 4K mark ahead. Pressure is intensifying due to hopes for a trade deal between the US and China, as well as profit-taking ahead of the Fed's decision on interest rates...
Key factors:
Progress in trade negotiations: the US has withdrawn the threat of 100% tariffs, and China may support the situation. Thursday's meeting between Trump and Xi Jinping increases the chances of a deal.
Bets on two rate cuts in 2024 are almost fully priced in. US inflation (3% y/y) was lower than forecast (3.1%), but did not change expectations.
The correction may continue if the positive backdrop for the trade deal remains. The Fed's decision on Wednesday will be a key catalyst.
Technically, the 4K zone is ahead, and it is too early to talk about a break of this support, as we do not know how the market will react. However, at the moment, the price is in the range of 4000-4163, and from a technical analysis point of view, it is logical to consider a false breakdown and a pullback.
Support levels: 4000, 3975, 3944
Resistance levels: 4060, 4090, 4163
As part of the decline, the market may test one of the specified zones: 4000, 3975, 3944. However, since a liquidity pool has formed below 4K, the reaction to the psychological support level may be aggressive. It is important to monitor the situation, as closing below 4K and consolidating below a strong level could trigger a further decline. Otherwise, if the bulls manage to hold their ground above 4K and bring the price back above 4050, the market may have a chance to grow.
Best regards, R. Linda!

GOLD → Retest 4060 within the range. What are the expectations?FX:XAUUSD is forming a correction from the Asian session, with the price testing the important 4060 zone ahead of two key events: US inflation data (CPI) and the results of US-China trade negotiations.
Key factors: US inflation (CPI): Low data will support gold (expectations of two cuts in 2024), but high figures will strengthen the USD and weaken gold (rates for a rate cut in December will decline).
Progress in negotiations between China and the US could weaken gold, while failure would bring back demand for safe havens. US sanctions against Russian oil are supporting oil prices and inflation expectations.
Gold is in wait-and-see mode. Growth is likely with weak CPI or a failure of negotiations. Strong CPI and progress in trade will reinforce the correction. The mood remains cautious ahead of events.
Resistance levels: 4090, 4150, 4163
Support levels: 4060, 4002
The important zone of 4060 - gold is forming a false breakdown. If the bulls hold their defense above this zone, it could trigger growth towards the resistance of the range. Otherwise, we can expect a retest of 4000K, and the reaction should be aggressive...
Best regards, R. Linda!

Gold – 24 Hours of Chaos: From 4400 to 4000The last 24 hours in Gold trading were absolutely insane. After retesting the 4400 zone all-time high last night, XAUUSD literally collapsed, dropping straight to the 4000 zone in just one day — a 10% move that’s unheard of for gold (at least I haven't seen).
1️⃣ Technical Picture
Once the price broke back below 4200, it confirmed a double top formation, and the selloff accelerated dramatically toward its measured target around 4000 — a level also supported by the ascending trendline that started in late August.
2️⃣ Current Context
At the time of writing, gold already rebounded nearly 1300 pips from the low, which means there’s no attractive level to enter long right now, even though the recovery might continue in the short term.
3️⃣ Key Levels to Watch
• Resistance: 4200 zone – now turned into a major resistance. If the price revisits this level, I’ll be looking for short setups, ideally on intraday spikes.
• Support: 4000 zone – if the price dips again before testing resistance, it could offer long opportunities from this confluence area.
4️⃣ Trading Plan
In short, we’re in a wide range between 4000 and 4200, both levels offering potential trades but in opposite directions. For now, I’ll stay patient and wait for price to get closer to one of these extremes before taking action.
⚠️ Final Note
Volatility is off the charts, so if you decide to trade XAUUSD these days, adjust your stop losses and targets accordingly. This is not the time for tight stops, is time for patience, and flexibility. 🚀

GOLD - Stop Trading Gold For NowGOLD - Stop Trading Gold For Now
For now, stay away from gold. I just see that something strange is happening and the reason is just some manipulation and nothing more.
Below is what I am reading, but it doesn't make sense:
💬A thaw in US-China trade relations has kind of pulled the rug out from under the gold price due to a drop in safe-haven buying flows,"
I would suggest to stay away from gold for a while and see what happens first.
⚠️It could be a bull trap and it could fall lower or it could be a bear trap and it could rise aggressively again. It's all happening for no apparent reason.
For the time being gold is positioned like it can drop more but I don't believe it too much
At the moment we have no confirmation on how it could take shape but it is back around a strong area and the psychological price is 3900 - 4000.
You may find more details in the chart!
Thank you and Good Luck!
❤️PS: Please support with a like or comment if you find this analysis useful for your trading day❤️

GOLD (XAU/USD): Bullish Move After Liquidity GrabIt appears that a significant bearish trap may have formed following a test of a strong horizontal support on an intraday chart.
Furthermore, a strong bullish confirmation, a bullish change of character, is evident on the hourly chart.
I anticipate that the price may potentially increase to the 4200 level.

XAUUSD: 800 Pips Secured, but Is the Correction Really Over?Yesterday, after revisiting the 4,000 support zone as expected and explained in my previous analysis, Gold bounced strongly and tested the area above 4,100.
That rally delivered around 800 pips profit on my long trade, and now the market is showing a mild pullback, consolidating around 4,085.
The key question now:
👉 Is the overall correction over, or is there still more to unfold?
From a technical perspective, as long as 4,000 remains intact, Gold retains its bullish potential toward the 4,200 resistance zone.
However, I prefer to stay patient at the moment — being flat at the time of writing — and will wait for a potential dip toward 4,050 or slightly below.
If the price shows a positive reaction in that area, I’ll consider re-entering long positions.
🎯 Upside targets:
• First: 4,150
• Second: 4,200
Keeping a positive risk-reward balance remains the main priority.
🚀 Let’s see if the market confirms the plan.

Wall Street Weekly Outlook - Week 44 2025 [27.10.- 31.10.2025]Wall Street Weekly Outlook – Week 44, 2025 📊💥
Let’s dive into another exciting trading week! 🚀
Rate decisions, month-end flows, and fresh quarterly earnings are setting the stage for strong market moves.
Sit back, enjoy the overview, and dive into the world of banks, hedge funds, and institutional flows — with exclusive insights into how the pros are positioning right now. 🧠💼📈
Extra Lessons: Strategies, setups, and market psychology — everything you need to know for the week ahead. ⚡️
**S&P500 Performance after FED rate cuts**
**Overview: The most important events of the week**
Have a great start to the trading week!
Meikel

GOLD Bull Market Price Target is 7 500 USD accumulate on dips🏆 Gold Market Long-Term Update 12/24 months
📊 Technical Outlook Update
🏆 Bull Market Overview
▪️2weeks/candle price chart
▪️Gold Bull market in progress
▪️1976/1979 650% gains - Bull Market 1
▪️1999/2012 650% gains - Bull Market 2
▪️2016/2027 650% gains- Bull Market 3
▪️Price Target BULLS 7500 USD
▪️650% gains off the lows
▪️will hit in 2026/2027
⭐️Recommended strategy
▪️BUY/HOLD accumulate dips
▪️BUY/HOLD physical gold
▪️BUY/HOLD GLD/GDX

Gold Forecast — Market Turning BullishGold (XAU/USD) maintains a strong long-term bullish trend, supported by rising investor demand and global macroeconomic stability. After completing a healthy correction phase, the market is showing renewed strength, indicating a potential continuation of the broader uptrend.
Current price action reflects accumulation behavior among institutional traders, signaling confidence in gold’s long-term value growth. The consistent pattern of higher lows and steady momentum suggests that buyers are firmly in control, preparing for another upward expansion cycle.
From a fundamental perspective, global inflation concerns, a weaker U.S. dollar, and geopolitical tensions continue to support gold prices. Investors are increasingly seeking protection in safe-haven assets, which further strengthens gold’s long-term position in the market.
Technical structure and sentiment both align with a buy-side outlook, highlighting the potential for gold to extend gains as liquidity continues to build in the current price zones.
In summary, gold remains in a strong buying phase, with market data, investor sentiment, and macroeconomic indicators all favoring sustained upward momentum.
Keywords: Gold forecast, XAU/USD analysis, gold long-term trend, gold price outlook, bullish gold market, gold accumulation phase, forex gold trading, gold price prediction 2025.

Gold Market Update: Correction Mode 3750/3500 USD possible🟡 Where We Are Right now
After ripping to fresh records, gold snapped hard — WSJ logged the steepest one-day loss in years last week and a follow-through weekly drop as longs unwound.
Analysts across Kitco and others frame this as a technical/positioning correction after a parabolic run, with a fight around the $4k handle and scope to probe $3,750 → $3,500 if selling persists.
Sentiment/flows flipped: GLD and other gold ETFs saw notable outflows into the selloff after heavy YTD inflows. That flow reversal is consistent with a near-term correction phase.
🔻 Why the Market Is Correcting Now
1️⃣ Positioning & Froth Unwinds
The rally attracted outsized speculative length; once momentum cracked, forced de-risking kicked in. WSJ called out “long unwind” dynamics; Kitco says the correction could persist for months as near-term drivers fade.
2️⃣ $4k Failed on First Retest; Technical Break Triggered Stops
Kitco flagged a “fight for $4k” with downside risk if that shelf gives. Once sub-4k prints hit, systematic sellers likely accelerated.
3️⃣ Flow Flip in ETFs
After massive 2025 inflows, GLD posted a sharp daily outflow during the drop — classic late-cycle reversal behavior for a momentum move.
4️⃣ Macro Balance Less Supportive at the Margin
Even with long-term tailwinds (deficits/geopolitics), the recent leg higher ran ahead of fundamentals. Kitco and others note easing physical tightness and cooling central-bank buying pace compared with earlier in the year, removing a key prop for spot.
⚙️ Near-Term Levels That Matter (Tactical)
$4,000 → Battle zone. Regaining and holding above turns near-term tone neutral.
$3,750 → First meaningful downside target; aligns with multiple analysts’ “healthy pullback” zone.
$3,500 → Deeper correction magnet if flows/positioning continue to bleed; widely discussed as a plausible washout level.
🔮 4–8 Week Catalyst Map (What Can Push Price)
🏛️ Macro / Policy
Treasury Quarterly Refunding (Nov 5): Mix/size guidance can sway the long-end, USD, and real yields — key for gold. A heavier bill tilt (and steady coupons) is less threatening than a surprise coupon ramp.
Fed Communication Cadence: With the Oct 28–29 FOMC just occurred, watch minutes (Nov 19) + any guidance shifts. A less-dovish tone or firmer real yields = near-term headwind; growth scares or easing bias = support.
US Data Prints: CPI/PCE, NFP, ISM — anything that re-prices the path of real rates. (Direction of real yields remains the single most important macro input.)
💰 Flows & Positioning
ETF Flows (GLD/IAU): Continued outflows would confirm distribution; a turn back to net inflows often leads price inflections.
COT Positioning: If spec length compresses materially, downside fuel diminishes — setting up a cleaner base. (Track weekly CFTC updates.)
🪙 Physical / Seasonal
India Demand (festive/wedding season) and China retail demand can stabilize spot if discounts narrow and premiums re-emerge, but Kitco notes near-term tightness has eased versus the squeeze earlier in the rally.
📈 Base Case Outlook (Next 4–8 Weeks)
Trend: We’re in a bull-market correction — momentum currently with sellers — inside a bigger, intact secular uptrend. WSJ + Kitco both frame it as a technical consolidation after a near-vertical ascent.
Range Expectation: $3,500–$4,100 with whipsaws around $4k. The market likely tests $3,750 and could overshoot to $3,500 on negative macro surprises or persistent outflows before attempting a higher-low base.
Bull Re-acceleration Triggers:
(a) USD/real-yield rollover post-Refunding/Fed minutes
(b) A visible reversal in ETF flows
(c) Stabilization in Asia physical premiums
(d) Fresh geopolitical shocks
Bear Extension Risks:
(a) Firmer real yields / stronger USD
(b) Deeper ETF outflows and CTA/systematic supply
(c) Evidence of slower central-bank demand than H1
(d) Soft physical uptake into dips
⚔️ Trade / Hedge Tactics
If Underweight/Flat:
Stagger bids $3,760 → $3,520, scale size smaller into weakness; insist on confirmation (stops above prior day’s high) before adding.
If Long From Higher:
Respect $3,750 — below it, tighten or partially hedge (short miners, long USD vs. FX beta, or buy short-dated puts) targeting $3,500 as a potential flush.
If Momentum Trader:
Let $4,000 decide regime. Sustained reclaims with rising on-balance volume/ETF creations = green light for a bounce to $4,080–$4,150; failure = fade rallies into $3,950–$3,980.
🧭 What I’m Watching Day-to-Day
1️⃣ Treasury refunding headlines (Nov 5) and term-premium reaction.
2️⃣ Fed minutes (Nov 19) and any shift in balance-of-risks language.
3️⃣ GLD/IAU flow tape (creations/redemptions).
4️⃣ Kitco/WSJ desk color on physical tightness and dealer inventories.

GOLD DAILY CHART ROUTE MAP UPDATEHey everyone,
Check out our updated Daily Chart Route Map, now featuring updated levels for tracking Golds movement.
We’ve refined our proprietary Goldturn Channel, our unique method for constructing ascending channels. Price action recently broke out above the channel, with a body close above 4325, leaving a long-term gap open near 4444.
Currently, we’re observing rejection at 4325, and our channel top is now acting as support. The market is range-bound between 4325 (resistance) and 4183 (channel top as support). A decisive break above or below either of these levels will help define the next directional move, keeping in mind the open gap overhead at 4444.
On the downside, 3961 remains the pivotal swing zone, aligning with the channel midline, should we see a confirmed break below 4183.
As always, we will keep you all updated with regular updates throughout the week and how we manage the active ideas and setups. Thank you all for your likes, comments and follows, we really appreciate it!
Mr Gold
GoldViewFX

GOLD → Technical analysis of the current situation FX:XAUUSD is consolidating, and the daily market behavior pattern is not particularly positive, but it does have bullish implications. Market sentiment largely depends on the fundamental background
This week, the Fed is expected to hold a meeting on interest rates, where it will most likely decide to lower them, which could generally support the dollar (but this news is most likely already priced in). Accordingly, the rest depends on decisions regarding the shutdown, trade war, and inflation. The resolution of the first two issues may weaken the price.
As for the technical side, since the price is currently within the trading range, it is worth considering trading within these limits first. However, a breakout and closing above/below one of the key levels: 4060 - 4150 could trigger further movement in the direction of the breakout, which in turn could push the price into another (bearish or bullish) trading range. Below, there is the 4000 zone, and there is a possibility of a retest of this area, with a potentially aggressive reaction.
Resistance levels: 4150, 4218, 4275
Support levels: 4060, 4015, 3944
While uncertainty remains, the market may continue to hold the price between 4060 and 4150. Another retest of the range boundary and the reaction to this retest will show the market's intentions for further movement.
Best regards, R. Linda!

How to Identify Higher Highs and Lower Lows AccuratelyIn price action trading, identifying Higher Highs (HH) and Lower Lows (LL) may seem simple, but it’s actually one of the most essential foundations for reading market structure.
If you get it wrong, you’ll often end up trading against the trend without realizing it.
1. Understanding Higher Highs & Lower Lows
Higher High (HH): a new peak that’s higher than the previous one → indicates the uptrend is still intact.
Lower Low (LL): a new trough lower than the previous one → confirms the downtrend continues.
It sounds simple, but the tricky part lies in choosing the correct main swing to read from.
2. Common Mistakes That Mislead Traders
Many traders identify HH–LL patterns on very small timeframes, which causes confusion because of minor pullback waves inside the bigger trend.
Example:
The M5 chart might show HH–HL (uptrend), while the H1 chart is clearly forming LL–LH (downtrend).
If you buy based on the small timeframe, you’re essentially buying into a pullback.
💡 Pro tip: Always identify the main market structure on higher timeframes (H1–H4) before looking for entries on smaller ones.
3. How to Identify Them Accurately
Find the main swing:
Look for the points where price truly reverses with strong candles or noticeable volume.
Mark clear highs and lows using the swing high/swing low tool.
Check structural continuity:
If HH and HL remain intact → the trend is bullish.
If LL and LH keep forming → the trend is bearish.
If the structure breaks (for example, a HH forms in a downtrend) → the market may be shifting direction.
4. Practical Tips
Use the H4 timeframe to determine the overall trend.
Then, drop to M15 or M30 to locate precise HH/LL points for entry.
Avoid identifying HH/LL inside sideways (ranging) markets — it’ll only confuse your analysis.
Gold Eyes 4,010 Support Ahead of CPI – Big Move Loading?Hey Traders,
In tomorrow’s trading session, we’re monitoring XAUUSD for a potential buying opportunity around the 4,010 zone. Gold remains in a broader uptrend and is currently in a correction phase, approaching a key support and resistance confluence around 4,010 that aligns with the ascending trendline.
Market Focus:
All eyes are on tomorrow’s U.S. CPI release, with expectations for headline inflation at 3.0% and core at 3.1%. A softer-than-expected print could weigh on the U.S. Dollar, potentially igniting fresh momentum for GOLD to resume its bullish trend.
Next Move:
Watching price action around 4,010 closely — if CPI data confirms disinflation, we could see a strong rebound toward recent highs as safe-haven demand strengthens.
💬 What’s your take on the CPI? Are you positioning long or waiting for confirmation? Drop your thoughts below!
Trade safe,
Joe

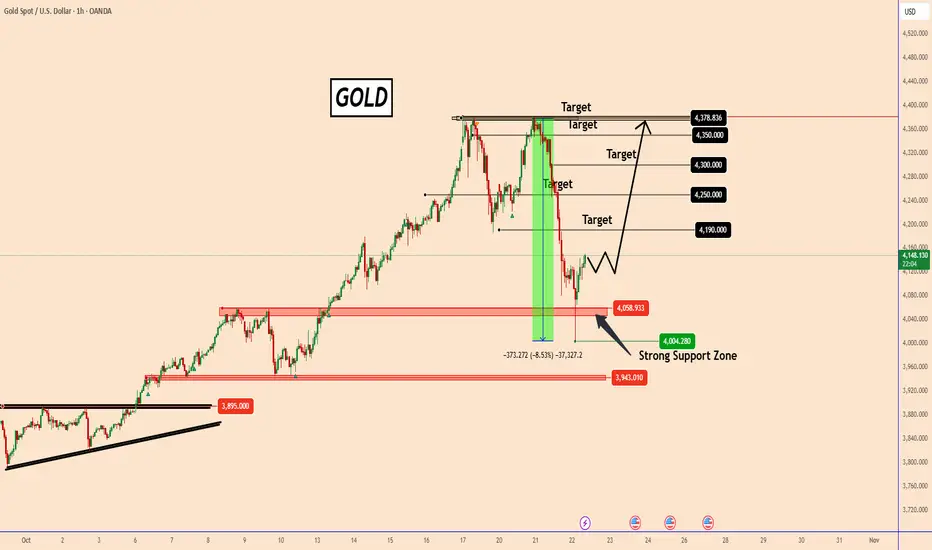
Gold Pulls Back on Profit-Taking, Bulls Defend the $4000 LevelGold Pulls Back on Profit-Taking, Bulls Defend the $4000 Level
Yesterday, gold faced a quick sell-off, likely triggered by the profit-taking of large institutions (manipulators), and corrected by almost 8.6%.
Considering that this move was created without news, it is a clear sign of manipulation. We cannot consider overbought conditions, as they have been in this state for 2 years.
The lower low was created near 4000, where the price found the bulls well-positioned near that psychological price zone.
Gold remains bullish and could rise again as shown in the chart.
It will break the 4000 level only if a larger manipulation unfolds again today or during the next week.
The price should rise again with targets at 4190; 4250; 4300 and 4350.
You may find more details in the chart!
Thank you and Good Luck!
❤️PS: Please support with a like or comment if you find this analysis useful for your trading day❤️
Gold Bullish Butterfly Forming – Reversal Ahead?As I expected in the previous idea , Gold started declining from the Resistance zone($4,192 – $4,137) and has now reached the Support zone($4,004 – $3,895) — full target achieved .
At the moment, Gold is moving within that Support zone($4,004 – $3,895) and Potential Reversal Zone(PRZ) .
Looking at the 1-hour time frame , we can spot a Bullish Butterfly Harmonic Pattern forming, which is likely to complete right in that PRZ .
I expect that in the coming hours, once Gold enters the PRZ , it could rise at least up to around $4,057(First Target) .
Second Target: $4,132
Stop Loss(SL): $3,889(Worst)
Please respect each other's ideas and express them politely if you agree or disagree.
Gold Analyze (XAUUSD), 1-hour time frame.
Be sure to follow the updated ideas.
Do not forget to put a Stop loss for your positions (For every position you want to open).
Please follow your strategy; this is just my idea, and I will gladly see your ideas in this post.
Please do not forget the ✅ ' like ' ✅ button 🙏😊 & Share it with your friends; thanks, and Trade safe.

( Gold Protocol ) Bearish Reversal Detected( Gold Protocol ) Bearish Reversal Detected
Bearish Reversal : 3978
Status: Active Reversal Protocol
Symbol: Gold
Session: London–New York Overlap (Smart Exit Window)
➕Bias: Bullish & bearish Reversal
☄️ Volume Surge Confirmed — Sellers dominate exhausted highs
☄️ Session Aligned — Smart money exit window open
☄️ Cluster Shield Active — Supply imbalance verified
☄️ Delta Shift Negative — Buyers trapped above
☄️ POC Retest Completed — Liquidity absorbed at resistance
☄️ Structure Break Pending — Bearish bias confirmed
Goal: Controlled with minimal drawdown
Tactical Edge: Reversal Protocol through liquidity engineering
Confidence Level: ★★★★★ (Smart Money Aligned)
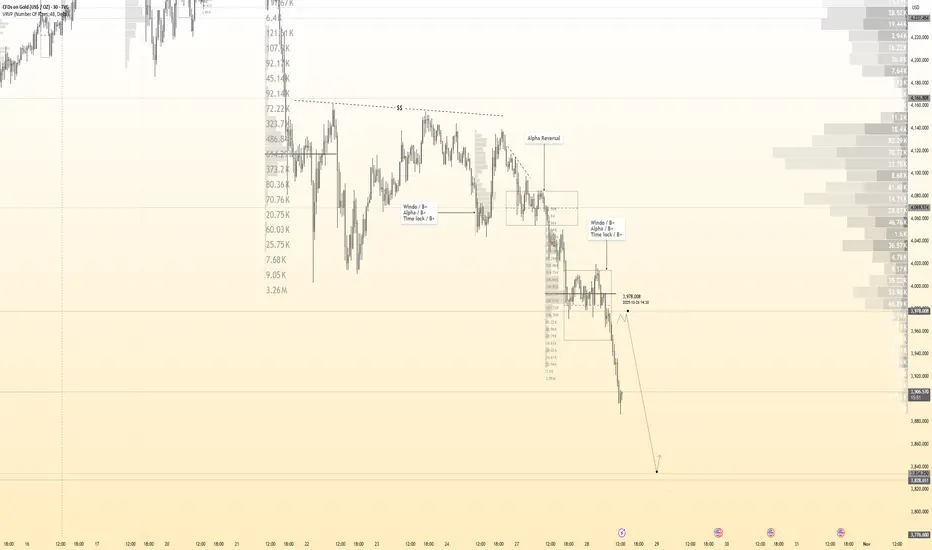
XAUUSDHello Traders! 👋
What are your thoughts on Gold?
Gold has reached a key support zone after a sharp two-day drop.
From this area, we expect a corrective rebound toward the broken structure.
This retest could complete a pullback phase before the next wave of decline resumes.
A short-term rally toward the resistance zone is likely.
If price shows rejection there, the next downside targets are expected to follow.
As long as price remains below the red resistance zone, the bearish bias remains intact.
Look for bearish confirmation signals on lower timeframes before entering short positions.
Don’t forget to like and share your thoughts in the comments! ❤️

Gold consolidating a new high zone pullback from support Gold is currently consolidating after a sharp reaction, with price action moving quickly and testing the new high zone. Technically, the price broke the 4,000 level but experienced a pullback from above this support area. The next directional move will likely depend on a breakout from the current consolidation range.
A clear break above resistance could trigger a move toward the next resistance zone at 4,165–4,200 a break below the range would suggest that gold remains neutral to bearish in the short term may test the support again rebound to upside.
You may find more details in the chart.
Trade wisely best of Luck buddies.
Ps; Support with like and comments for better analysis Thanks for Supporting.

GOLD → Sell-off due to uncertainty FX:XAUUSD is falling, the trend is downward, and we have confirmation of this. Profit-taking is leading to a decline, which is causing buyers to exit the market...
Caution ahead of the Fed: Markets are pricing in a 25 bp rate cut, but the main thing is the tone of the statement and Powell's comments on further steps. The USD is not ready to continue its growth and is starting to look downwards. The US government shutdown continues, adding uncertainty, which supports gold.
However, an important issue is the trade deal between the US and China; a positive outcome could put pressure on gold.
Gold is balancing between hopes for a trade truce and risks from Fed policy.
Support levels: 3895, 3820
Resistance levels: 3943, 3975, 4015
Since the opening of the session, the price has fallen by 2.3%, which is an intraday range. The 3900-3895 area may see a reaction in the form of a false breakdown and a correction to the imbalance zone before a possible further decline.
Best regards, R. Linda!

gold next week still downtrend target $3950🧭 Current Market Context (XAUUSD around 4111):
Price is below EMA 9 and failed to break above 4200–4250.
The structure shows lower highs → bearish continuation still dominant.
Momentum is weak, and buying pressure hasn’t confirmed reversal yet.
📉 Primary Plan (Bearish Bias – More Likely)
Entry: Wait for a 4H close below 4070–4050. Enter short/sell once confirmed.
Targets:
TP1 = 3950
TP2 = 3600
TP3 = 3500
TP4 (long-term) = 3100
Stop Loss:
Above 4250 (or above last swing high).
✅ Reason:
Trend still bearish.
EMA and structure show resistance above price.
Strong downside targets available.
✅ Reason: That breakout would invalidate bearish structure and shift momentum up.
⚠️ Key Tips
Don’t trade inside 4050–4250 (range zone, no clear direction).
Follow 4H or Daily candle confirmations — avoid early entries.
Risk only 1–2% of account per trade.
If shorting, take partial profit near 3600 and trail stops.

Gold (XAU/USD) – Testing key support zone near 4,020 USDGold (XAU/USD) – Testing key support zone near 4,020 USD, potential short-term rebound
On the 15-minute chart, Gold (XAU/USD) continues to show weakness after failing to hold above the 4,080 USD resistance. Price action has formed a clear lower-high structure, indicating sellers remain in control.
Currently, gold is testing the horizontal support area around 4,010 – 4,020 USD, which previously acted as a strong demand zone. The market is consolidating in this region, suggesting that a short-term reaction or pullback could occur before the next major move.
Technical Outlook
Resistance: 4,080 – 4,090 USD
Support: 4,010 – 4,000 USD
Market Structure: Lower-High / Lower-Low (bearish bias)
EMA50: Slope remains downward, confirming short-term bearish momentum
RSI: Near oversold territory on lower timeframes, indicating possible rebound pressure
Despite the downward trend, the proximity to the 4,010 USD support zone increases the likelihood of a technical bounce toward 4,080 USD before any continuation lower.
Trading Plan Suggestion
Buy (counter-trend scalp):
Entry: 4,030 – 4,035 USD
Stop Loss: 4,010 USD
Take Profit: 4,080 USD
Sell (trend continuation):
Entry: 4,083 – 4,090 USD (after rejection)
Stop Loss: 4,110 USD
Take Profit: 4,020 – 4,000 USD
Summary
Gold remains in a short-term downtrend, but buyers may attempt to defend the 4,010 USD level. A strong bullish reaction from this zone could trigger a temporary pullback, whereas a breakdown below 4,000 USD would confirm further weakness toward 3,950 USD.
Keep this setup on your watchlist — follow to receive daily price action updates and intraday trading strategies.
