Gold Holds Above the Cloud – Bulls Wait for Confirmation PushHello everyone,
Gold continues to maintain a constructive structure after its strong recovery from the 4,100 USD zone, currently trading around 4,345 USD/oz on the H4 chart. Technically, the bullish structure remains intact as previous Fair Value Gaps (FVG) below price are still unfilled and price continues to respect the upper boundary of the Ichimoku cloud (Kumo). As long as price stays above 4,300 USD, upside potential toward 4,400–4,450 USD remains valid. However, a healthy retest toward 4,200–4,100 USD (overlapping FVG + lower Kumo boundary) should not be ruled out as part of liquidity collection.
On the macro side, fundamentals continue to support the bullish bias. Reuters reported gold gained over 2% in the latest session as markets increased bets on Fed rate cuts amid cooling economic signals in the US. Concerns over a potential US government shutdown also boosted demand for safe-haven assets. HSBC recently raised its gold forecast for 2025–2026, citing strong central bank accumulation, while Goldman Sachs emphasised that this rally is driven by genuine capital flows—not emotional fear. Financial Times, however, noted that the “debasement trade” effect (gold rising strongly due to a weaker USD) has yet to fully ignite, suggesting the uptrend still has room to extend.
I remain bullish overall. Above 4,300 USD, buying pullbacks remains my preferred strategy, targeting 4,400–4,450 USD initially and potentially 4,500 USD if momentum strengthens. A dip towards 4,200 USD would not negate the trend—instead, it would provide a better accumulation opportunity. If trading this setup, I would protect long positions with a stop-loss below 4,200 USD given upcoming high-impact events such as US GDP, CPI and Fed speeches.
In short, gold continues to follow a medium-term uptrend. Rather than chasing tops, it is wiser to wait patiently for clean entry points and trade with the trend, not against it.
Trade ideas

XAUUSD – Gold Recovers After US-China TensionsGold prices recently rose by nearly 1% during the Asian trading session on Thursday, recovering from two consecutive days of declines. The main reason for this is the renewed US-China trade tensions , which have increased demand for safe-haven assets like gold. At the same time, investors are awaiting important inflation data from the US , which could significantly impact the gold trend moving forward.
Technically, the chart shows that gold has experienced a slight correction after a strong rise from 4,060,000 USD. It is currently fluctuating within the range of 4,060,000 USD – 4,200,000 USD. Both EMA34 and EMA89 are supporting the price from below, confirming that the uptrend remains intact, despite the temporary correction.
Trading Strategy:
Buy if gold holds above 4,060,000 USD, with a target towards 4,200,000 USD.
Sell if gold fails to break through 4,200,000 USD and returns to test support at 4,060,000 USD.
In conclusion, with rising trade tensions and increased demand for safe-haven assets, gold is on a strong uptrend and is likely to continue testing the 4,200,000 USD resistance level in the near future.

XAUUSD – Bearish Pressure After Historical HighsGold prices continue to experience significant downward pressure as profit-taking surges after a strong rally. From the historical peak of nearly 4,400 USD/ounce, gold has lost nearly 12 million VND per tael , and is at risk of falling further if the 4,000 USD/ounce level cannot hold.
On the H4 chart, XAUUSD is forming a bearish trend with a clear price structure. Gold is facing a downward trendline , and each recovery from the lows encounters strong selling pressure . Currently, the price is hovering around 3,935 USD, near the support zone at 3,990 USD, and could drop further to 3,750 USD if this level fails to hold.
Key factors affecting the price:
USD recovery: The strengthening of the US dollar and rising US Treasury yields have reduced gold's appeal, as it does not yield interest.
Increased risk appetite: Progress in US-China trade talks is drawing funds towards equities and industrial commodities.
Trading Strategy: Sell gold around 4,000 USD, with a target of 3,750 USD, and stop loss above 4,050 USD.
Conclusion: XAUUSD remains in a mild bearish trend, with further downside potential if the 4,000 USD level is broken.

Technical Correction – Bullish Structure Remains IntactHello everyone, after a strong rally to new highs, gold (XAU/USD) is entering a necessary corrective phase before deciding its next direction. On the H1 timeframe, price is temporarily consolidating around $4,090 – a key support area where buyers are beginning to show signs of defence.
From a technical perspective, the overall bullish structure remains intact as price continues to form liquidity zones followed by FVG fills. The $4,090–$4,080 zone still acts as the short-term defensive line for buyers. If this area holds, gold may rebound to retest $4,120–$4,130 – a region where selling pressure previously intensified. Ichimoku Cloud remains below price and has yet to signal a bearish reversal, indicating that this move is still a correction rather than distribution.
On the news side, gold continues to receive medium-term support from expectations of a Fed rate cut in December, a cooling US dollar, declining bond yields and lingering geopolitical risks. While US–China trade dialogue may offer temporary signs of easing tension, institutional capital still favours defensive positioning, keeping gold within its broader uptrend.
In the short term, I prioritise the scenario of gold extending its correction to gather liquidity around $4,080–$4,090 before potentially resuming its upside. Only a decisive break below this zone with strong bearish momentum would expose the psychological level at $4,000.
What do you think about gold’s current trend – is this just a healthy pullback or an early warning of a deeper decline?
Why Did Gold Plunge Yesterday – Key Factors ExplainedHello everyone, the gold market just experienced a dramatic session, with the front-month futures contract falling over 5.39% in a single day, marking the deepest drop since June 2013. This sharp correction follows an extended period of rapid gains, forcing many traders to reassess the short-term trend.
Main reasons behind the sharp drop
Correction after strong growth: Gold has surged over 128% from its 2011 baseline, but the lack of intermittent pullbacks created expectations for a significant retracement. When the correction occurred, it happened quickly and steeply, just as many veteran traders anticipated.
Divergence with silver: Although silver fell 7.2%, its decline was “modest” compared to gold. Gold’s parabolic rise contrasted with silver’s steadier gains, reinforcing the likelihood that gold would continue adjusting while silver maintained a sustainable upward trajectory.
Historical surge dynamics: From lows around 2,500 USD/oz, gold soared past 4,200 USD with hardly any meaningful consolidation. A long-term surge without pullbacks almost inevitably leads to sharp reversals, clearly illustrated by yesterday’s drop.
With the Double Top pattern fully formed and the neckline broken, I expect gold could fall to the strong support zone around 4,000 USD or lower if the decline continues. Current resistance stands at 4,200 USD, a level difficult for gold to reclaim in the short term. The market is confirming a downtrend, so traders should monitor the support zones closely to identify optimal entry points.
Do you think this is a buying opportunity at lower gold prices or just a temporary dip? Share your thoughts below!

XAUUSD – Increased Selling Pressure After CPI DataHello traders,
With U.S. CPI rising sharply to 3.1% (compared to the forecast of 2.9%), inflation remains elevated, reinforcing the likelihood that the Fed will not cut interest rates anytime soon. With higher interest rates, the opportunity cost of holding gold (a non-yielding asset) increases, causing capital to flow into USD, which is a negative factor for gold.
On the H4 chart, XAUUSD is facing pressure at the 4.150 level, with a pullback pattern forming within a descending channel. After reaching this level, the price of gold is likely to continue its decline, with the next target being the 4.080 support area, and potentially heading toward 3.830 if the bearish momentum persists.
Additionally, while both the PMI for manufacturing and services have slightly decreased , reflecting a slowdown in the U.S. economy, the CPI remains the dominant factor , limiting the potential for gold's short-term price increase.

XAUUSD: Bullish Reversal Setup From Triangle SupportHello everyone, here is my breakdown of the current Gold setup.
Market Analysis
Gold (XAUUSD) continues to trade within a larger bullish market structure, maintaining higher lows above its key ascending Trend Line. After a strong impulsive rally that pushed the price above the 4,200 resistance, the market faced rejection near the top of the Range and entered a corrective phase. This correction evolved into a triangle pattern, with price now testing the Triangle Support Line, aligning closely with the horizontal Support area around 4,020 – 4,000 — a historically important demand zone.
Currently, the price is consolidating near the lower boundary of this structure, showing early signs of stabilization. This region also coincides with the previous breakout point, adding further confluence for potential buyer interest.
My Scenario & Strategy
I expect the price to hold above the Triangle Support Line and form a bullish reversal structure, signaling that buyers are once again defending this level. A confirmed breakout above the Triangle Resistance Line would indicate renewed bullish momentum and a potential continuation of the overall uptrend.
My primary target zone lies around 4,215, where previous resistance and the upper range boundary converge. However, if the support near 4,000 fails to hold, it could trigger a deeper correction toward 3,950, where the next demand zone is located. This setup offers a favorable risk-to-reward opportunity for traders anticipating a rebound from a major technical confluence zone.
That's the setup I'm tracking. Thank you for your attention, and always manage your risk.

GOLD 4H CHART ROUTE MAP UPDATE & TRADING PLAN FOR THE WEEKHey Everyone,
Please see our updated 4h chart levels and targets for the coming week.
We are seeing price play between two weighted levels with a gap above at 4333 and a gap below at 4225. We will need to see ema5 cross and lock on either weighted level to determine the next range.
We will see levels tested side by side until one of the weighted levels break and lock to confirm direction for the next range.
We will keep the above in mind when taking buys from dips. Our updated levels and weighted levels will allow us to track the movement down and then catch bounces up.
We will continue to buy dips using our support levels taking 20 to 40 pips. As stated before each of our level structures give 20 to 40 pip bounces, which is enough for a nice entry and exit. If you back test the levels we shared every week for the past 24 months, you can see how effectively they were used to trade with or against short/mid term swings and trends.
The swing range give bigger bounces then our weighted levels that's the difference between weighted levels and swing ranges.
BULLISH TARGET
4333
EMA5 CROSS AND LOCK ABOVE 4333 WILL OPEN THE FOLLOWING BULLISH TARGETS
4422
EMA5 CROSS AND LOCK ABOVE 4422 WILL OPEN THE FOLLOWING BULLISH TARGET
4494
EMA5 CROSS AND LOCK ABOVE 4494 WILL OPEN THE FOLLOWING BULLISH TARGET
4572
BEARISH TARGETS
4225
EMA5 CROSS AND LOCK BELOW 4225 WILL OPEN THE FOLLOWING BEARISH TARGET
3985
EMA5 CROSS AND LOCK BELOW 4122 WILL OPEN THE SWING RANGE
3985
3857
EMA5 CROSS AND LOCK BELOW 3857 WILL OPEN THE SECONDARY SWING RANGE
3741
3632
As always, we will keep you all updated with regular updates throughout the week and how we manage the active ideas and setups. Thank you all for your likes, comments and follows, we really appreciate it!
Mr Gold
GoldViewFX

GOLD Finally Bearish , Short Setup Valid To Get 300 Pips !Here is My 30 Mins Gold Chart , and here is my opinion , we finally Below 4050.00 With 4H Candle And this never happened for a long time ! and we have a 4H Candle closure below it And Perfect Breakout and this give us a very good confirmation , so we have a good confirmation now to can sell after the price go back to retest the broken area 4050.00 , and give us a good wicks as previous wicks ! and we can targeting 100 to 200 pips . if we have a daily closure above this area this mean this idea will not be valid anymore .
Reasons To Enter :
1- Perfect Touch For The Area .
2- Clear Bearish Price Action .
3- Bigger T.F Giving Good Bearish P.A .
4- Over Bought .
5- Perfect 30 Mins Closure .

Double Top Confirmed! Is Gold About to Fall Deeper?As expected from my previous idea , Gold touched its target of $4,183 ( the double top pattern’s target(Small) ). Before reaching that target, it had some ups and downs over the past few days, mainly due to the ongoing US-China tensions .
Gold is trading near a Support zone($4,193 – $4,156) .
From a classical technical analysis perspective, it’s forming a clear double top pattern on the 1-hour timeframe . There’s also a regular bearish divergence (RD-) visible between the two peaks of the double top.
From an Elliott Wave theory standpoint, it looks like Gold has started its corrective wave. If the Support zone($4,193 – $4,156) and the double top pattern’s neckline break , we can expect further downside .
I expect that after breaking the Support zone($4,193 – $4,156) and the neckline , Gold could drop at least to around $4,083(First Target) .
Second Target: $4,057
Stop Loss(SL): $4,385(Worst)
Note: Keep in mind that given the ongoing US-China tensions, any news could invalidate this analysis. So it’s more important than ever to manage your risk carefully these days.
Please respect each other's ideas and express them politely if you agree or disagree.
Gold Analyze (XAUUSD), 1-hour time frame.
Be sure to follow the updated ideas.
Do not forget to put a Stop loss for your positions (For every position you want to open).
Please follow your strategy; this is just my idea, and I will gladly see your ideas in this post.
Please do not forget the ✅ ' like ' ✅ button 🙏😊 & Share it with your friends; thanks, and Trade safe.

GOLD (XAUUSD): Support & Resistance Analysis For Next Week
Here is my latest support & resistance analysis for Gold.
Horizontal Structures
Resistance 1: 4186 - 4244 area
Resistance 2: 4358 - 4381 area
Support 1: 4040 - 4060 area
Support 2: 3942 - 3959 area
Support 3: 3870 - 3897 area
Support 4: 3766 - 3831 area
Support 5: 3691 - 3735 area
Vertical Structures
Vertical Support 1: Rising trend line
Consider these structures for pullback/breakout trading next week.
❤️Please, support my work with like, thank you!❤️
I am part of Trade Nation's Influencer program and receive a monthly fee for using their TradingView charts in my analysis.

Analysis of gold movement on the 4-hour time frameHi traders
Gold has not been able to close a candle above the equilibrium range (4114) for the 4-hour time frame for now, but it can have an upward movement to the resistance areas, pick up the rising liquidity, and then return to close a candle below the 4-hour equilibrium range (it can stabilize below 4067, in which case it will pullback to 4067 and 4090 and towards the sell).
For the resistances in question, 4171 - 4193 and 4208 - 4231 are two one-hour equilibrium resistances that the market has not yet pulled back to these numbers, and the 4-hour candle after the pullback should stabilize below these areas to confirm the continuation of the decline to low liquidity and sellers' TPs

Gold A waiting for rebound raising hopes for a potential tradeGold prices regained some lost ground on Tuesday after breaking below the key 4,000 support level. Following a sharp 32% decline in the previous session, the market is showing signs of stabilization. The rebound was supported by encouraging progress in U.S.–China trade negotiations, as both countries agreed to withdraw threats of 100% tariffs. Additionally, optimism has increased ahead of Thursday’s meeting between U.S. President Donald Trump and Chinese President Xi Jinping, raising hopes for a potential trade deal.
Technical Outlook:
From a technical perspective, the recent decline suggests that gold prices may retest the 3,925 / 3,900 support zone. It’s important to monitor this area closely — a clear break below could open the door for deeper downside movement. On the upside, if the bulls manage to reclaim and hold above 4,050, the market could see a short-term recovery toward the 3,985 / resistance area.
You may find more details in the chart.
Trade wisely best of Luck Buddies.
Ps; Support with like and comments for better analysis Thanks for Supporting.

#XAUUSD: +6000 Pips Swing Move In Making, Patience Pays!
Gold prices have fallen sharply as the DXY has regained strength. Following the recent significant sell-off, we can anticipate the potential direction of the price. Three key targets can be considered if the price moves in our favour. The first is a nearby target at $4000 which would represent a gain of 1100 pips. Subsequent targets should be determined according to your trading plan.
There are two potential entry points; if the first is invalidated the second should be considered.
We wish you the best of luck and trade safely.
Team Setupsfx 🚀❤️

THE KOG REPORT - UpdateEnd of day update from us here at KOG:
Yesterday we shared the hot spots together with the levels which as you can see worked well paired with the red box holding price down to play the range.
Now, with buyers starting to lose faith and start hedging longs from above, we need some more confidence in the up move in our opinion. For that reason, we will say that the baseline here sits are 4030 and above that level we may be looking at the 4070-74 level initially. We need to form a swing here to at least meet the voids.
Price: 4089
RED BOXES:
Break above 4095 for 4110, 4125 and 4140 in extension of the move
Break below 4082 for 4064✅, 4050✅ and 4020✅ in extension of the move
As always, trade safe.
KOG

THE KOG REPORT - UpdateEnd of day update from us here at KOG:
Interesting open on the markets with gaps all over the place. Gold managed to break below on the open then continuing to complete not only the red box targets but our Algo target as well. We would have liked higher to get in on this move, ideally we wanted 4055 during the NY Session but it wasn't to be. The move commenced and those that got in managed to bag themselves a decent trade short.
For now, due to another stretch on buyers, we would like to see where we close today. We have circled the potential play with a swing high looking like it will attempt the 4030 level while the red box below will need to break in order to continue to our long awaited target below.
As always, trade safe.
KOG

Gold Key Levels (4000-4400$)These are the Gold key levels which I’ll be using for trading.
Here’s how I trade these levels:
- Close above a level → Buy setup
When a candle closes clearly above a level, it confirms bullish momentum and I look to enter long immediately after the close.
- Close below a level → Sell setup
A confirmed candle close below support signals bearish strength, and I enter short right after the close.
- Rejection from a level → Opposite trade
If price shows a strong rejection from a level, I trade in the opposite direction - rejection from resistance = sell setup, rejection from support = buy setup.
These levels works well for both day trading (using 1H candles) and scalping (using 15M or lower timeframes). It keeps trading simple, just reactions to market behaviour.

Gold Hesitates Ahead of U.S. CPI — Watching the 4000 ZoneGold Hesitates Ahead of U.S. CPI — Watching the 4000 Zone
From the analysis I shared yesterday, gold reached the first target near 4152 before pulling back.
The market is currently hesitating to move further, mainly due to uncertainty around the upcoming U.S. CPI data. I’m not interpreting the data this time, as its impact on gold can be unpredictable — gold often moves independently of fundamentals.
I believe gold may rise once more toward the 4000–4060 zone, as shown on the chart. However, traders should remain cautious since the news could bring significant volatility.
Targets remain unchanged.
Keep in mind that a break below 4000 could confirm a bearish wave, potentially followed by an aggressive rebound — a classic false sell-off scenario.
You may find more details in the chart!
Thank you and Good Luck!
❤️PS: Please support with a like or comment if you find this analysis useful for your trading day❤️

(XAU/USD – Gold Spot, 1-hour timeframe)...(XAU/USD – Gold Spot, 1-hour timeframe), here’s the breakdown:
Current price: Around $4,337
First target (near-term): Around $4,284
Second (main) target: Around $4,205
These target levels are marked on my chart with blue arrows labeled “Target Point.”
📉 Interpretation:
The chart suggests a bearish (downward) move — likely following a correction from the peak labeled “2.”
The Ichimoku cloud and marked arrows indicate a short-term pullback, with a stronger support zone near $4,205–4,210.

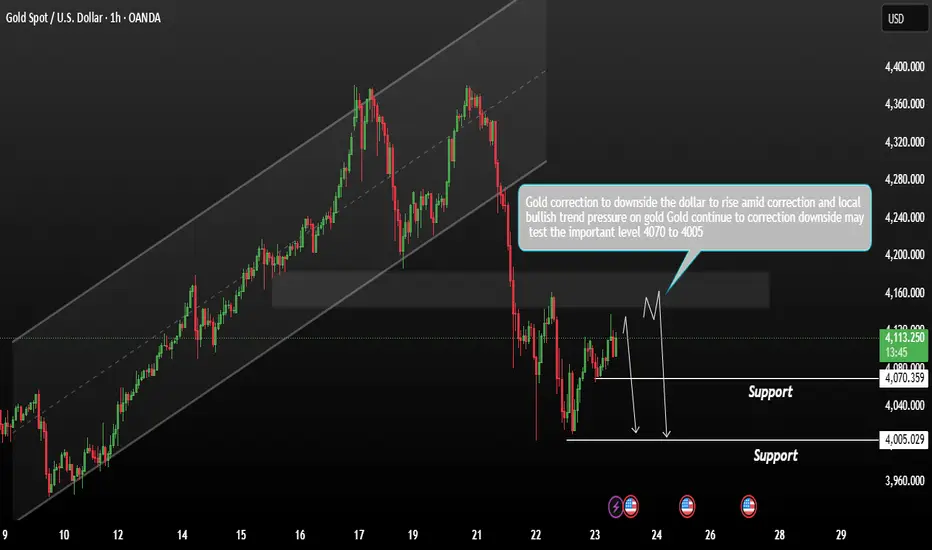
Gold forming a consolidation range What should Next?Gold prices continue to correct to the downside, forming a consolidation range near current levels. The market remains supported, but momentum is weakening as the US Dollar strengthens amid a local bullish trend.
As long as the dollar maintains its upward correction, downside pressure on gold is likely to persist. a break below the trading range support could trigger further declines toward the 4,070 4,005 zone (support area). This level may act as a potential retest zone for buyers. For now, it’s best to wait for price action to slow down near the lower boundary of the range before considering new trades — patience and confirmation are key to avoid false breaks.
You may find more datils in the chart,
Trade wisely best of Luck Buddies.
Ps; Support with like and comments for better analysis Thanks for Supporitng.
Gold downtrend, accumulation below 4000⭐️GOLDEN INFORMATION:
Gold (XAU/USD) picks up modestly in Tuesday’s Asian session, rebounding from a two-week low near $3,972. A softer US Dollar, pressured by expectations of two more Fed rate cuts this year, supports the non-yielding metal. Ongoing geopolitical tensions from the Russia-Ukraine conflict also add to its safe-haven appeal.
⭐️Personal comments NOVA:
There is still selling pressure, gold is definitely correcting below 4000, the market is waiting for interest rate results
⭐️SET UP GOLD PRICE:
🔥SELL GOLD zone: 4090 - 4092 SL 4097
TP1: $4080
TP2: $4070
TP3: $4050
🔥BUY GOLD zone: 3941 - 3943 SL 3936
TP1: $3960
TP2: $3980
TP3: $4000
⭐️Technical analysis:
Based on technical indicators EMA 34, EMA89 and support resistance areas to set up a reasonable SELL order.
⭐️NOTE:
Note: Nova wishes traders to manage their capital well
- take the number of lots that match your capital
- Takeprofit equal to 4-6% of capital account
- Stoplose equal to 2-3% of capital account

Gold Intraday Trading Plan 10/24/2025Yesterday gold indeed dropped initially to 4065 and rose up to 4155. However, in daily the pump is not strong enough and the close is still under EMA. Also in 12H TF, price is rejected from 38.2% retracement. Therefore, yesterday's rise is considered as retracement to me and the mid-term bearish trend should continue for today.
I am selling at current price. 1st target 4000. If broken, it should open way to 3950.

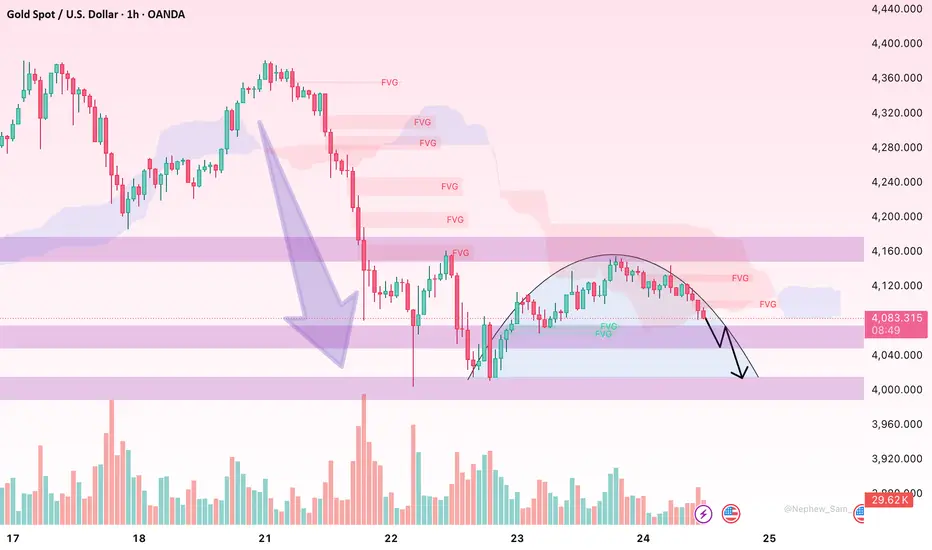
Gold Pauses After Sharp Selloff as Buyers Quietly ReturnHello everyone,
Gold has just experienced a rare deep sell-off, dropping from $4,380 to $3,980 – a nearly $400/oz loss in just a few sessions, equivalent to more than 9% of its value. Following this sharp decline, the price is now hovering around $4,010 and showing early signs of stabilising near the psychological support at $4,000 – a key area for the next directional move. This phase represents the market temporarily “catching its breath” to absorb liquidity after the large sell-off and prepare for the next step.
From the news perspective, the primary driver behind gold’s slump is the return of global “risk-on” sentiment after a preliminary US–China trade agreement. Capital promptly shifted away from safe-haven assets like gold into equities, crude oil, and other riskier assets. Yet the outlook is not entirely negative: US CPI data came in below expectations, reinforcing the potential for the Fed to cut rates by 25 basis points on 29/10. Lower rates continue to support gold in the medium term by making the precious metal more attractive.
Technically, the $3,980–$4,000 zone acts as strong support, coinciding with September’s low and containing unfilled liquidity gaps (FVG). After the steep drop, multiple FVG zones above remain – $4,120–$4,180 and $4,260–$4,320 – which could serve as recovery targets in upcoming sessions. Selling volume is weakening, and H4 candles show consistently long lower wicks – a clear indication that buyers are quietly absorbing selling pressure.
Personally, I believe gold has reached an important technical support and is likely to see its first technical rebound after this shock decline. The nearest target lies between $4,100–$4,200, overlapping the first FVG resistance. However, this recovery will likely be technical in nature until the market interprets the Fed’s post-29/10 policy message.
Do you see this as a buying opportunity at the bottom, or merely a trap rally before further declines?
