GOLD Very Near Perfect Place For See , 500 Pips Waiting !Here is My 30 Mins Gold Chart , and here is my opinion , we again Below 4050.00 With 4H Candle and the price come back to retest it ! and we have a 4H Candle closure below it And Perfect Breakout and this give us a very good confirmation , so we have a good confirmation now to can sell after the price go back to retest the broken area between 4050.00 : 4055.00 , and give us a good wicks as previous wicks ! and we can targeting 100 to 200 pips . if we have a daily closure above this area this mean this idea will not be valid anymore .
Reasons To Enter :
1- Perfect Touch For The Area .
2- Clear Bearish Price Action .
3- Bigger T.F Giving Good Bearish P.A .
4- Over Bought .
5- Perfect 30 Mins Closure .
Trade ideas

Lingrid | GOLD Weekly Support Hold Long OpportunityOANDA:XAUUSD pulled back sharply from the resistance and printed a higher low right at the confluence of the uptrend and above previous week low 4,050. Structurally, the broader upward channel remains intact while price retested the downward trendline from above, keeping the higher-low sequence alive. If 4,000–4,050 support continues to hold, it favor a rebound toward 4,245 and, if momentum extends, a run at 4,400; a daily close back below 4,043 would defer the bounce. Broader momentum still skews bullish with successive higher lows, suggesting the recent drop is a corrective pullback within the trend rather than a top.
⚠️ Risks:
A decisive break below 4,000 that invalidates the uptrend confluence could extend losses toward 3,950–3,900.
Strong USD and higher real yields on hawkish Fed rhetoric/data may cap upside or accelerate downside.
Diminishing geopolitical risk or risk-on equity strength could sap haven demand for gold.
If this idea resonates with you or you have your own opinion, traders, hit the comments. I’m excited to read your thoughts!

Gold 1H – Bearish Reaction After Consecutive Gains🟡 XAUUSD – Intraday Trading Plan | by Ryan_TitanTrader
📈 Market Context
After several sessions of steady gains, gold is showing signs of exhaustion as U.S. Treasury yields stabilize and traders reassess the Federal Reserve’s next move.
The market’s focus today is on U.S. housing data and Fed officials’ remarks, which could shape expectations for the December policy outlook.
• A hawkish tone from policymakers may strengthen the dollar and pressure gold lower.
• Conversely, softer remarks could briefly trigger buying around key discount zones, but the overall tone remains corrective after the recent rally.
Market liquidity is concentrated near the $4,230 area — where price may tap into unmitigated supply before continuing its bearish leg.
🔎 Technical Analysis (1H / SMC Style)
• Structure: The overall bias has shifted bearish following consecutive ChoCH and BOS formations.
• Premium Zone: The 4,230–4,228 area aligns with an H1 order block and previous liquidity pool — a prime zone for short re-entry.
• Liquidity Sweep: The recent upside push toward 4,230 may sweep late buyers before the next bearish leg unfolds.
• Discount Zone: Short-term liquidity may rest around 4,080–4,100, which aligns with previous sell-side imbalance (SSI) and acts as an intraday reaction zone.
🔴 Sell Setup
• Entry: 4,230 – 4,228
• Stop-Loss: 4,240
• Take-Profit Targets: 4,100 → 4,080 → 4,050+
🟢 Buy Scalp Setup (Short-Term Countermove)
• Entry: 4,081 – 4,083
• Stop-Loss: 4,074
• Take-Profit Targets: 4,100 → 4,115
(Only valid if liquidity sweep confirms reaction within discount zone)
⚠️ Risk Management Notes
• Confirm M15 BOS/ChoCH before entry — avoid blind orders during news.
• Reduce position size for scalp entries; primary directional bias remains bearish.
• Lock partial profits near first liquidity targets and trail stops as structure confirms continuation.
✅ Summary
Gold faces near-term correction pressure after multiple bullish sessions.
The 4,230–4,228 zone offers a clean premium OB entry for continuation shorts, while reactive buyers may scalp intraday from 4,081 if liquidity sweeps occur.
Stay adaptive — today’s sentiment is short-term bearish within a larger range-bound structure.
FOLLOW RYAN_TITANTRADER for daily SMC setups ⚡

retracement ?$3,500!With the reduction of international tensions and geopolitical risks in the last days of 2025 and of course the end of the fiscal year of international banks and financial institutions, as well as large companies in international stock markets, I think we can expect a two- or three-month break and price correction in the global gold price. The specified range can be re-tested by the average price.

Gold is about to experience a significant decline!Gold and Silver are ready to crash in next few days, It has a clear complete pattern of double 3 as w-x-y from Elliott wave analysis, and as whole this is only wave (ii), given the strength of wave (i), one can see a massive bearish move both in Gold and Silver.

Xauusd Focus ShortOn the XAU/USD chart, the hourly timeframe is currently in a downtrend, while the daily timeframe remains in an uptrend.
Therefore, the decline seen on the hourly chart represents a pullback within the broader daily uptrend.
Once this pullback completes, the daily trend is expected to push toward a new all-time high (ATH) before entering a longer-term correction phase.
Given this context, the current pullback could extend for several thousand points, so the focus should remain on short positions (sell setups) during this retracement phase.

XAUUSD – CPI Cools, USD Weakens, and Gold Regains MomentumMarket Overview:
Gold has regained bullish traction after the latest US CPI report showed softer inflation data, leading to a weaker USD and renewed buying across metals.
CPI figures came in below market expectations (Core CPI 0.2% vs 0.3%, CPI m/m 0.3% vs 0.4%, CPI y/y 3.0% vs 3.1%), signalling lower inflation pressure and reinforcing bets that the Fed will stay dovish heading into November.
As a result, gold bounced strongly from the 4,050–4,058 support zone, reclaiming key structure levels and stabilising above 4,100 USD/oz.
Market sentiment remains risk-sensitive, but the short-term tone favours further upside correction, as long as gold holds above the trendline and liquidity support zones highlighted on the chart.
Technical Outlook (H2):
The market structure suggests gold has completed its correction phase and is attempting to form a new bullish leg.
Price action shows a clean rejection at the 4,050 liquidity base, and the next immediate objectives are the 4,211 neckline and 4,260–4,342 supply zones.
Key Technical Levels:
Support / Buy Zone: 4,058 – 4,002
Liquidity Sweep Zone: 3,930 – 3,940
Resistance / Neckline: 4,211
Sell Zone Reaction Fibo: 4,260 – 4,342
Trading Plan – MMFLOW View
🔹 BUY Zone #1 (Continuation Play)
Entry: 4,058 – 4,050
Stop Loss: 4,035
Take Profit: 4,155 → 4,211 → 4,260
🔹 BUY Zone #2 (Liquidity Sweep Scenario)
Entry: 4,002 – 3,930
Stop Loss: 3,915
Take Profit: 4,058 → 4,155 → 4,211
Ideal setup if price retests liquidity before CPI-induced recovery continues.
🔹 SELL Zone(Reaction Trade)
Entry: 4,260 – 4,342
Stop Loss: 4,355
Take Profit: 4,211 → 4,100 → 4,058
Weekly Bias & Summary:
With CPI cooling and the USD losing momentum, gold’s structure points to a recovery phase, possibly extending into Wave III of the medium-term cycle.
However, the 4,211 neckline remains the key pivot — a breakout above this zone could trigger momentum extension toward 4,260–4,340, while a rejection may result in another range-bound pullback.
🟡 MMFLOW Bias: Bullish while above 4,050 — dips remain opportunities to buy.
Macro tone favours risk-on rotation, supporting gold’s upside into next week.
📊 Do you think gold will break 4,211 for the next bullish leg, or is another correction incoming before the real move?
👉 Follow MMFLOW TRADING for daily institutional updates and Smart Money Flow structure.

Gold: Watch for a corrective pullback toward 4,230Price was in a strong bullish trend. However, momentum started to fade as price created a double top pattern, a classic signal of buyer exhaustion.
After the second top, sellers stepped in aggressively, breaking below the neckline, confirming a shift in market structure from bullish to bearish. This breakdown accelerated as trapped buyers began exiting their positions, fueling a sharp decline.
From here, a short-term bullish pullback may develop, buyers could push price back toward the 4,230, aligning with the 0.5–0.618 Fibonacci retracement zone.

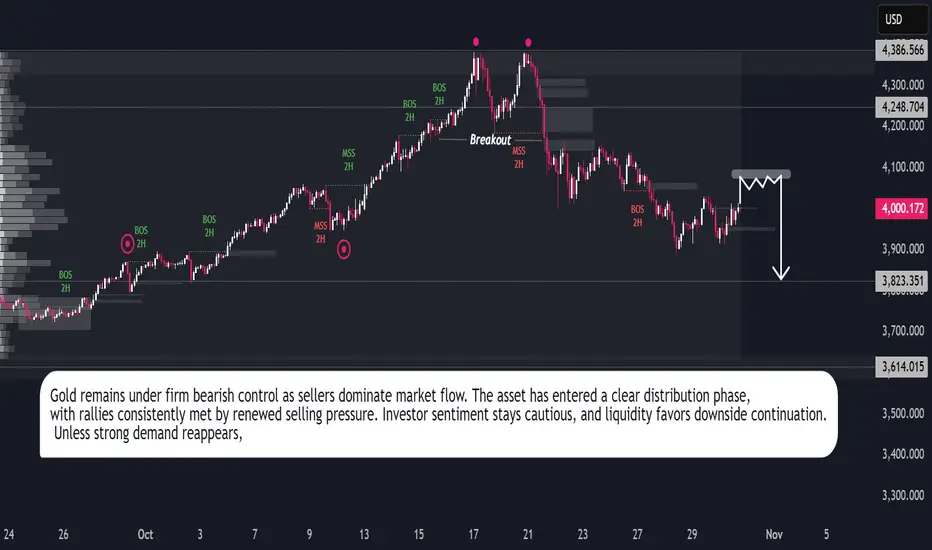
Gold Outlook: Bears Stay in ControlGold continues to operate within a bearish market environment characterized by persistent liquidation and declining momentum. The recent structural shift reflects an ongoing reallocation of capital away from defensive metals toward higher-yield instruments, signaling a broader change in market positioning.
Trading activity indicates that each upward movement is being met with renewed selling interest, suggesting limited participation from institutional buyers. This behavior aligns with the prevailing sentiment of caution, as investors prioritize stability over speculative exposure.
The broader outlook remains subdued, with market conditions favoring continued downside until clearer evidence of renewed demand emerges. Gold’s performance reflects a phase of market adjustment, where declining liquidity and moderate volatility reinforce the persistence of bearish sentiment across the short-term horizon.
Gold ready for another spike 4380Gold (XAU/USD) is holding above the support trend line, showing potential for a bullish rebound. As long as price stays above the 4,220 support area, it may target the next resistance near 4,380.

Gold Elliott Wave– Potential Wave (4) Completion ZoneGold (XAU/USD) on the daily chart appears to be completing a classic Elliott Wave 5-wave impulse structure. After a strong rally into the wave (3) high, price is currently retracing toward the projected wave (4) correction zone.
The highlighted support area aligns with key Fibonacci retracement levels:
0.5 retracement: around $3,845
0.618 retracement: around $3,718
This region also coincides with the lower boundary of the ascending channel, adding confluence for potential bullish reversal.
If wave (4) finds support within this zone and maintains structure, a new impulsive rally toward wave (5) could begin — targeting the upper trendline resistance near $4,500–$4,600.

Don't rush into gold; it's still going to fall!Although current market news is generally bullish for gold, the recent decline in gold prices is primarily driven by large-scale profit-taking and a technical correction that has been stronger than expected. Gold is currently at a critical turning point. Tuesday's sharp drop has indeed weakened the short-term trend, but Wednesday's rebound and the bullish engulfing pattern formed on the 4-hour chart clearly indicate solid buying support below. Overall, gold prices are likely to fluctuate and consolidate in the short term between 3980 and 4145-4155, awaiting new directional catalysts. Gold is currently in a correction cycle, with overall momentum weak. Therefore, the recommended trading strategy is to short on rallies. Sell on rallies!!!

GOLD WEEKLY CHART MID/LONG TERM ROUTE MAPHey everyone,
Please check out our updated Weekly Chart Route Map, featuring updated revised key levels after completion of our last long term weekly chart idea for precise level-to-level tracking.
We’ve refreshed our long-term structure on the weekly chart. Price action recently rejected the 4294 level and is now range-bound between 4284 (resistance) and 4059 (support). This consolidation aligns with a detachment from the EMA5, highlighted on the chart with a circle. Even if a full detachment doesn’t materialize, a partial (halfway) correction remains the more probable scenario.
To determine the next directional move, we’ll need a decisive test and break of either boundary level. On the broader horizon, 3006 stands as the long-range pivotal swing zone, which may come into play if a major correction unfolds.
🔹 Note: The key distinction between a retracement range and a swing range is that swing ranges typically produce larger bounces and wider price reactions compared to standard retracement ranges.
We’ll continue to update this outlook throughout the week as the structure develops. Thank you all for your likes, comments and follows, we really appreciate it!
Mr Gold
GoldViewFX

Gold price is consolidating around 4100⭐️GOLDEN INFORMATION:
Gold (XAU/USD) slips below $4,150 in Friday’s Asian session, weighed down by a firmer US Dollar and cautious sentiment after recent sharp losses. The end of India’s Diwali festival may also curb physical demand. However, lingering US government shutdown risks, global trade tensions, and expectations of US rate cuts could lend support to the non-yielding metal.
⭐️Personal comments NOVA:
Gold's downward correction is still continuing, accumulating below 4200. Buying power is weakening and there is not much momentum to increase prices this week.
⭐️SET UP GOLD PRICE:
🔥SELL GOLD zone: 4217 - 4219 SL 4224
TP1: $4202
TP2: $4190
TP3: $4170
🔥BUY GOLD zone: 3954 - 3956 SL 3949
TP1: $3970
TP2: $3990
TP3: $4015
⭐️Technical analysis:
Based on technical indicators EMA 34, EMA89 and support resistance areas to set up a reasonable SELL order.
⭐️NOTE:
Note: Nova wishes traders to manage their capital well
- take the number of lots that match your capital
- Takeprofit equal to 4-6% of capital account
- Stoplose equal to 2-3% of capital account

Gold at a Critical Crossroad: Bounce or Breakdown Ahead?Hi!
The gold price is currently trading around $4,042, sitting just above a critical support area near $3,953.80. This gray zone is a key decision point for the next major move.
Trend Structure:
The broader trend remains bullish, moving within a well-defined ascending channel.
Double Top Formation:
A short-term double top has formed near recent highs, triggering a corrective move down into the channel’s midline and the gray support area.
Critical Support Zone ($3,953.80):
This level aligns with previous structure support and the channel’s bottom, making it a high-probability reaction zone.
________________
Scenario 1: Bullish Reaction (Primary Scenario)
If gold holds above the gray critical area and bounces within the ascending channel, we could see a renewed bullish wave.
Confirmation: A strong bullish reaction or higher low around $3,953–$3,980.
Target: The green target zone around $4,619.57, corresponding to the upper channel boundary and a potential measured move from the recent correction.
Scenario 2: Bearish Breakdown
If the gray area fails to hold, it could signal deeper downside momentum.
Trigger: A clean break and 4H close below $3,953.80.
Target: The pink support zone near $3,656.01, which aligns with prior accumulation and the lower channel boundary.
________________
Disclaimer: As part of ThinkMarkets’ Influencer Program, I am sponsored to share and publish their charts in my analysis.

GOLD (Xauusd) is going DOWN! great sell tradeAs you can see GOLD - Xauusd is in a clear downtrend. The red lines drawn show a downward channel which indicate that GOLD is now moving to the downside... Secondly, Gold has broken a powerful support level (the upper green line)! It is now very likely to head down to the lower green line (next support level). Great time to sell!

Gold Bull Market Outlook And Targets: 5000 USD/7500 USDGold Bull Markets Long Term Overview and 2025 Market Update
________________________________________
🌊 Five-Wave Roadmap — Targets & Timing
• Wave 1 (2016–2020): From ~$1,050–1,200 to the COVID-era spike; established secular up-trend.
• Wave 2 (2020–2022): Consolidation/corrective pullback (~–20%).
• Wave 3 (2023–2025/26): Power leg to ATHs (current). Room to extend toward $4,200–$4,500 on flow surges before pausing.
• Wave 4 (2026, base case): Re-accumulation/consolidation ~12 months; likely range-bound –10% to –15% from the Wave-3 peak as institutional buying digests gains.
• Wave 5 (2027–2030/32): Final thrust to the cycle’s terminal zone:
– First objective: $5,000–$5,500 (consistent with 2026 Street “bull wave” scenarios).
– Terminal extension: $7,500–$8,000 by 2030–2032 (our desk’s stretch path if real yields stay muted, official-sector demand persists, and private capital rotation broadens).
Why Wave-4 can last ~12 months: prior secular bulls often paused for a full year near major breakouts while flows “change hands.” Expect lower realized vol, fading retail FOMO, and steady official accumulation to define the tape.
📈 Top 10 Stats of the Current Bull 2025
1. Price & ATHs: Spot ~$3.75–$3.79k; fresh ATH $3,790.82 on Sep 23, 2025.
2. 2025 YTD: Roughly +40–43% YTD
3. Central Banks: 1,045 t added in 2024 (later revised to ~1,086 t as lagged data came in). H1/Q1’25 tracking remained elevated.
4. ETF Flows: Back-to-back strong quarters; Q2’25 total demand 1,249 t, value US$132bn (+45% y/y) with ETFs instrumental.
5. Gold vs Equities: Gold ≈+40% vs S&P 500 ≈+13% total return YTD.
6. Jewelry Demand: Tonnage softened as prices surged; value at records (2024 down y/y; weakness persisted into H1’25).
7. Gold–Silver Ratio: ~85–88 (silver torque improving as it pushes into the mid-$40s).
8. Macro Link: Safe-haven bid + expected policy easing keep real-yield headwinds contained.
9. Technical: Confirmed 13-yr cup-and-handle breakout (Mar ’24) underpinning trend.
10. Street Forecasts: GS baseline $4,000 by mid-’26; bulled-up houses (HSBC/BofA) flag $4.9–$5.0k potential into 2026 if private/ETF rotation persists.
• This cycle is different: record central-bank buying + renewed ETF inflows + lower real rates = powerful tailwind.
• Price: Gold notched fresh ATHs this month (up to $3,790.82). 2025 is shaping up as the strongest year since the late 1970s.
• Relative: Gold is crushing equities YTD (≈+40% vs S&P 500 ≈+13% total return).
• Setup: A 13-year “cup-and-handle” breakout in 2024 kick-started the move.
• Outlook: Street base cases cluster near $4,000 by mid-’26; several houses now publish $4,900–$5,000 stretch targets into 2026 as flows accelerate.
________________________________________
🏆 Historic Gold Bull Markets — Timeline & Stats
1. 1968–1980 “Super Bull”
• Start/End: ~$35 → $850 (Jan 1980)
• Gain: ~2,330%
• Drivers: End of Bretton Woods, oil shocks, double-digit inflation, geopolitical stress.
• Drawdown: ~–45% (1974–1976) before the final blow-off run.
2. 1999–2011/12
• Start/Peak: ~$252 (1999) → ~$1,920 (2011–12)
• Gain: ~650%
• Drivers: Commodities supercycle, EM demand, USD weakness, GFC safe-haven bid.
3. 2016/2018–Present (The “CB-Led” Cycle)
• Start Zone: $1,050–$1,200 → New ATH $3,790 (Sep 2025)
• Gain: ~215–260% (depending on 2016 vs 2018 anchor)
• Drivers: Record central-bank accumulation, sticky inflation/low real rates, geopolitics; 2024 13-yr base breakout.
________________________________________
📊 At-A-Glance Comparison (Updated 2025)
Metric | 1968–80 Super Bull | 1999–2012 | 2016/18–2025 Current
🚀 Total Gain | ~2,330% | ~650% | ~215–260% (so far)
⏲️ Duration | 12 yrs | 13 yrs | 7–9 yrs (ongoing)
💔 Max Drawdown | ~–45% (’74–’76) | ~–30% (’08) | ~–20% (2022)
🏦 Main Buyer | Retail/Europe | Funds/EM | Central Banks
🏛️ Pattern | Secular parabolic | Cyclical ramps | 13-yr base → breakout (’24)
Notes: current-cycle characteristics validated by WGC demand trends & the 2024 technical breakout.
________________________________________
________________________________________
________________________________________
🔄 What Makes This Bull Different 2025 Edition
• 🏦 Central-Bank Dominance — Third consecutive 1k+ tonne year in 2024; 2025 is still tracking strong on a run-rate basis. This “sticky” demand is from price-insensitive reserve managers.
• ⚡ Faster Recoveries — Drawdowns are shallower/shorter vs the 1970s analog, consistent with a structural rather than speculative buyer base.
• 📈 Coexisting With Risk Assets — ATHs with equities positive YTD = macro hedge + diversification bid, not just “panic buying.”
• 📐 Structural Breakout — 13-yr base cleared in 2024; market now in multi-year price discovery.
________________________________________
🎯 Strategy Ideas 2025 & Beyond
• Buy/Hold on Dips: Stagger entries (DCA) into physical (allocated), ETFs (e.g., GLD/IAU), and quality miners/royalties.
• Prefer Physical/Allocated where counterparty risk matters; use ETFs for liquidity and tactical tilts.
Satellite/Leverage
• Silver & GSR Mean-Reversion: With GSR ~85–88, silver historically offers torque in up-legs. Pair with high-quality silver miners.
• Factor Tilt in Miners: Prioritize low AISC, strong balance sheets, reserve growth, rule-of-law jurisdictions; emphasize free-cash-flow yield and disciplined capex.
Risk-Management
• Define max drawdown per sleeve; pre-plan trims near parabolic extensions or if macro invalidates (e.g., real-yield spike).
• Use options overlays (collars on miners; long-dated calls on physical proxies) to shape payoff in Wave-3 late innings and Wave-4 digestion.
________________________________________
🧪 Reality Check: What Could Invalidate the Bull?
• Real yields + USD rip higher (sustained) → compress gold’s opportunity cost.
• Official-sector buying stalls (policy or FX-reserve shifts) → removes the anchor bid.
• Growth re-acceleration + faster-than-expected disinflation → weaker safe-haven + fewer rate cuts.
• Technical break: a persistent move below ~$3,600–3,700 would question Wave-3 extension and pull forward Wave-4.
________________________________________
🧭 Quick Reference Tables
🧾 Summary: Historic vs Current
Feature | 1968–80 | 1999–2012 | 2016/18–2025
Total Gain | ~2,330% | ~650% | ~215–260%
Duration | 12 yrs | 13 yrs | 7–9 yrs (ongoing)
Correction | ~–45% | ~–30% | ~–20% (’22)
Main Buyer | Retail/Europe | Funds/EM | Central Banks
Pattern | Parabolic | Cyclical | Cup & Handle → Secular
🧩 “If-This-Then-That” Playbook
• If real yields fall & CB buying persists → Ride trend / add on consolidations.
• If USD + real yields jump → Trim beta, keep core hedge.
• If GSR stays >80 with silver momentum → Overweight silver sleeve for torque.
________________________________________
🔚 Key Takeaways Updated
• Twin pillars: relentless official-sector demand + 2024 structural breakout.
• Base case: Street ~$3.7–4.0k by mid-’26 with upside to $4.5–5.0k on accelerated private/ETF rotation.
• Roadmap: Extend Wave-3 → Wave-4 re-accumulation (~12 months) → Wave-5 to $5,000–$5,500, then $7,500–$8,000 by 2030–2032 under favorable macro/flow dynamics.
• Operating stance: keep core, add on dips/sideways phases, manage beta and drawdowns proactively.

Bullish bounce off 50% Fibonacci support?The Gold (XAU/USD) is falling towards the pivot, which aligns with the 50% Fibonacci retracement and could bounce from this level to the swing high resistance.
Pivot: 3,847.44
1st Support: 3,701.62
1st Resistance: 4,357.81
Disclaimer:
The above opinions given constitute general market commentary, and do not constitute the opinion or advice of IC Markets or any form of personal or investment advice.
Any opinions, news, research, analyses, prices, other information, or links to third-party sites contained on this website are provided on an "as-is" basis, are intended only to be informative, is not an advice nor a recommendation, nor research, or a record of our trading prices, or an offer of, or solicitation for a transaction in any financial instrument and thus should not be treated as such. The information provided does not involve any specific investment objectives, financial situation and needs of any specific person who may receive it. Please be aware, that past performance is not a reliable indicator of future performance and/or results. Past Performance or Forward-looking scenarios based upon the reasonable beliefs of the third-party provider are not a guarantee of future performance. Actual results may differ materially from those anticipated in forward-looking or past performance statements. IC Markets makes no representation or warranty and assumes no liability as to the accuracy or completeness of the information provided, nor any loss arising from any investment based on a recommendation, forecast or any information supplied by any third-party.

GOLD | Bearish Momentum Below 4,053GOLD | Bearish Momentum Below 4,053 ⚠️
Gold currently shows bearish momentum while trading below 4,053, with potential to extend losses toward 4,011.
A confirmed break below 4,011 would signal continuation of the bearish trend toward 3,944.
However, if the price stabilizes above 4,011, a bullish reversal is possible.
A close above 4,053 would confirm bullish momentum toward 4,074 → 4,124.
Pivot Line: 4,053
Resistance: 4,074 – 4,101 – 4,124
Support: 4,011 – 3,978 – 3,945

Gold prices still face the risk of falling further
News:
Gold prices weakened again in U.S. trading on Monday (October 27), extending last week's decline. With the thaw in U.S.-China trade relations, investor demand for gold as a safe-haven asset has declined. Market focus has now shifted to the Federal Reserve's interest rate decision, which is expected to be a rate cut later this week.
Spot gold prices fell below $4,000 an ounce on Monday, hitting a three-week low of $3,885 an ounce at one point, as improved market sentiment weakened demand for the safe-haven metal.
Specifically:
Gold daily level: Yesterday closed with a big negative, losing the middle track support. Originally expected to close with a cross or a small positive or negative today, to rebound and confirm the middle track resistance and then rise and fall, to prepare for a wave of pull-ups after tomorrow's interest rate cut, it is also easy to cause a false fall after the middle track breaks, tempting investors to follow the trend and continue to bearish at low levels; but in fact, today continued to fall.
At present, the price of gold has fallen below the previous terraced support band in the 4-hour trend. The K-line continues to be under pressure and the short-term moving average maintains a good volatile downward trend. In the short term, we will pay attention to whether there will be a second downward trend after the rebound and repair.
Today's focus is on the 4000-20 area to suppress the decline, and breaking through 3970-75 to look below 3900. The target has been achieved. After the short-term plunge in gold, and with the Federal Reserve's interest rate decision approaching, the bulls and bears will play a tug-of-war.
Trading strategy:
Buy: 3990-3985, SL: 4050, TP: 3930-3910

XAUUSDGold is in a correction phase, with prices near the support zone of 3973-3954. If the price fails to break above 3954, a rebound is likely. Consider buying in the red zone.
** Very Risky Trade
🔥Trading futures, forex, CFDs and stocks carries a risk of loss.
Please consider carefully whether such trading is suitable for you.
>>GooD Luck 😊
❤️ Like and subscribe to never miss a new idea!

XAU/USD: Sharp Pullback Tests $4,000 as Rally Takes a BreatherXAU/USD faced heavy turbulence this week, rallying initially before hitting strong resistance and reversing sharply toward the $4,000 psychological support. The selloff, accompanied by rising volume, signals potential exhaustion following the recent parabolic move.
A dip toward $3,900 would not indicate a breakdown, but rather a healthy correction, offering the market a chance to reset momentum and prepare for a more sustainable bullish leg ahead.

XAUUSD (Gold) seeking $4,000 region?As my H4 chart shows, gold did make a double top a few days ago and then crashed. You can give credit for this massive 3,800 points move to profit taking or economic uncertainty or any technical reason, maybe a combination but it really does not matter.
What does matter is that we now have a double or triple top indicating that we have more room to the down side. I am seeing a medium term bearish move followed by a consolidation and now it may be that we will get a breakout (to the down side) to give us a bearish continuation.
How far will we go? I have no idea but the round number 4,000 followed by 3,950 do make sense. If all this works out as I anticipate, it may be a good idea to close a partial position, move the stop to a level of small profit and then trail the price action.
This is not a trade recommendation; it’s merely my own analysis. Trading carries a high level of risk so carefully managing your capital and risk is important. If you like my idea, please give a “boost” and follow me to get even more.
