XAUUSD H4 | Potential Bearish Drop Off?Based on the H4 chart analysis, we could see the price rise to the sell entry at 4,053.43, which is an overlap resistance and could reverse from this level to the take profit.
Stop loss is at 4,149.54, which is a pullback resistance.
Take profit is at 3,690.65, which is a pullback support that is slightly below the 61.8% Fibonacci retracement.
Stratos Markets Limited (tradu.com ):
CFDs are complex instruments and come with a high risk of losing money rapidly due to leverage. 68% of retail investor accounts lose money when trading CFDs with this provider. You should consider whether you understand how CFDs work and whether you can afford to take the high risk of losing your money.
Stratos Europe Ltd (tradu.com ):
CFDs are complex instruments and come with a high risk of losing money rapidly due to leverage. 70% of retail investor accounts lose money when trading CFDs with this provider. You should consider whether you understand how CFDs work and whether you can afford to take the high risk of losing your money.
Trade ideas

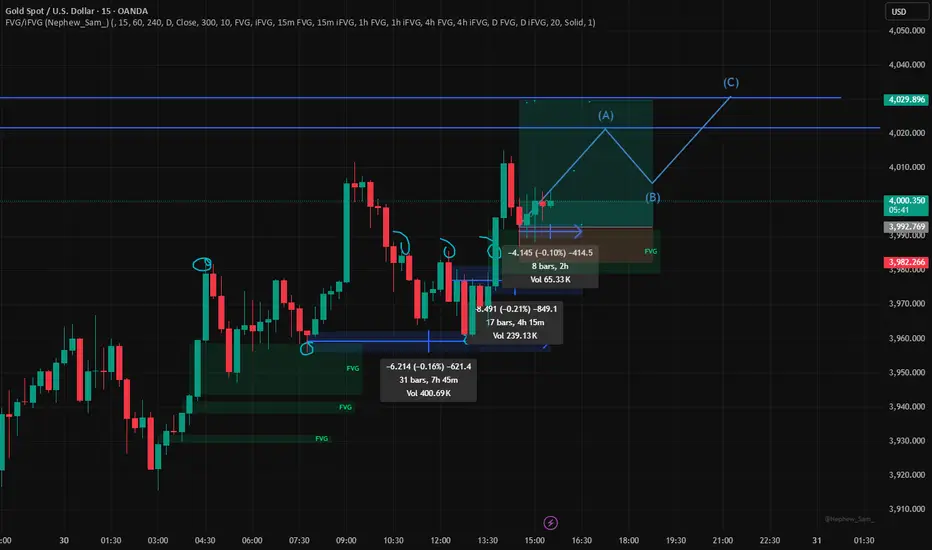
XAUUSD Bearish Outlook – Liquidity Grab Into FVG ZoneThis is my new update for gold. On the 1H timeframe, we can see a double top followed by a change of character (CHOCH) to the downside, confirming bearish intent. I’ve marked two Fair Value Gaps (FVG 1 and FVG 2) as potential retracement zones.
Price has now reached a support level and bounced, forming equal highs (marked with dollar signs), indicating liquidity above. I expect a liquidity grab above these equal highs before a potential drop.
The retracement may reach FVG 1 (~50% Fibonacci) or FVG 2 (~61.8% Fibonacci). From either level, if we see a CHOCH to the downside on the 5M timeframe, that could be a strong sell confirmation, aligning with the 1H bearish structure.
My target is around $3,950, making this a high-probability short setup based on Smart Money Concepts.

Potential bearish drop?The Gold (XAU/USD) has rejected off the pivot and could drop to the 1st support, which aligns with the 78.6% Fibonacci retracement.
PivotL 4,016.90
1st Support: 3,791.73
1st Resistance: 4,131.50
Disclaimer:
The above opinions given constitute general market commentary, and do not constitute the opinion or advice of IC Markets or any form of personal or investment advice.
Any opinions, news, research, analyses, prices, other information, or links to third-party sites contained on this website are provided on an "as-is" basis, are intended only to be informative, is not an advice nor a recommendation, nor research, or a record of our trading prices, or an offer of, or solicitation for a transaction in any financial instrument and thus should not be treated as such. The information provided does not involve any specific investment objectives, financial situation and needs of any specific person who may receive it. Please be aware, that past performance is not a reliable indicator of future performance and/or results. Past Performance or Forward-looking scenarios based upon the reasonable beliefs of the third-party provider are not a guarantee of future performance. Actual results may differ materially from those anticipated in forward-looking or past performance statements. IC Markets makes no representation or warranty and assumes no liability as to the accuracy or completeness of the information provided, nor any loss arising from any investment based on a recommendation, forecast or any information supplied by any third-party.


XAUUSD Long: Demand Zone Holding, Eyes on $4,080Hello traders! Gold (XAUUSD) is currently showing a corrective phase within its broader bullish trend. After a strong rally from the $3,850 Demand Zone, price climbed steadily along the ascending Trend Line, forming higher highs and higher lows until reaching the $4,150–$4,180 Resistance Area. This zone acted as a key pivot point, where buyers lost momentum and sellers initiated a retracement.
Following this, the market broke below the Trend Line, signaling the start of a short-term correction. The correction found temporary support near the $3,950 Demand Zone, where buyers have recently stepped in again. This level coincides with a previous pivot and a key structural support area, suggesting a potential rebound setup. At the moment, price is consolidating between the $3,950 Demand Zone and the $4,080–$4,150 Resistance Area, indicating indecision before the next move.
From my perspective, Gold is likely to attempt a bullish correction toward the $4,080–$4,150 Resistance Zone, which aligns with both the previous Trend Line and recent pivot structure. A successful break and close above $4,150 would confirm a trend continuation toward higher levels. However, if the price fails to break above this resistance area and gets rejected, sellers could regain control, pushing the market back down toward $3,950 or even lower. For now, I’ll be watching for confirmation of a bullish reaction from the $3,950 Demand Zone to validate a short-term long setup targeting $4,080. Manage your risk!

BULLS READY TO TAKE CHARGE AGAINChart Overview
Pair: XAUUSD (Gold / USD)
Timeframe: 1 Hour (1H)
Current Zone: Around 3960–4015
Type of Structure: You’ve drawn a descending wedge / falling channel pattern.
📉 Pattern Explanation
Your drawing shows:
Sharp impulsive drop → heavy selling pressure earlier.
Consolidation inside a wedge → price making lower highs and lower lows, but the slope is narrowing.
Circle area (highlighted) → likely key reaction zone / breakout area.
That means you’re expecting:
The market to retest the lower boundary once more.
Then reverse upward from support near 3920–3940.
Targeting breakout toward 4010–4040 zone.

XAUUSD Early Week: SELL Wave From FVG/Fibo 0.382 Resistance ZoneXAUUSD Early Week: SELL Wave From FVG/Fibo 0.382 Resistance Zone 🎯
Welcome back, everyone, Steven Trading here with the new week's Gold analysis!
The market is clearly showing selling pressure after a strong rejection from the peak. Technical analysis on the H4 frame confirms the downtrend remains dominant. We will focus on seeking SELL opportunities when the price recovers to the strong supply zone.
1. 📊 In-Depth Technical Analysis (H4 Technical Analysis)
Main Trend (Bearish Structure): The Bearish structure on H4 has been clearly established.
Volume Signal: The Volume Profile indicates accumulation by the Sellers at high price zones, reinforcing the search for SELL opportunities.
Ideal SELL Zone (High-Prob Zone): Gold tends to retest the important Resistance zone around $4235 - 4237. This is an extremely important technical convergence point:
FVG (Fair Value Gap): The price imbalance zone acts as a magnet.
Fibonacci 0.382: Provides high-quality SELL signals.
2. 📰 Macro Context (Context)
The Gold market is being influenced by two streams of information:
Short-Term Downward Pressure 📉: Optimism about US-China trade and the market's focus on the upcoming FOMC meeting have strengthened the USD, creating downward pressure on Gold. The psychological mark of $4200 is key.
Long-Term Support 📈: Global Central Banks are still buying Gold in record volumes, creating a solid price foundation, preventing prices from falling too deeply in the long term.
3. 🎯 Detailed Trading Plan (Action Plan)
The current range is quite narrow. We prioritize trading according to the downtrend.
🔴 Main SELL Scenario (Trend-following priority)
We wait for the price to recover to the supply zone to execute a Sell order.
Entry Zone: $4235 - 4237
Stop Loss (SL): $4243 (Set a tight SL to manage risk)
Profit Targets (TP):
TP1: $4212
TP2: $4200
TP3: $4177
TP4: $4145
🟢 Counter BUY Scenario (Higher risk - Defensive)
This scenario is triggered if the price drops deeply into the strong Liquidity zone.
Entry Zone: $3955 - 3958
Stop Loss: $3950
Profit Targets (TP):
TP1: $3975
TP2: $3998
TP3: $4025
TP4: $4060
4. 🧠 Notes and Discipline (Steven's Note)
Discipline is number 1: Always adhere to the set Stop Loss. If the market goes against the plan, we accept the small predetermined risk.
Capital Management: Only trade with a risk volume of 1-2% of the account per order.
Psychology: No FOMO (Fear of Missing Out) or trying to "revenge" the market. Waiting is a trading skill.
Do you agree with this Gold strategy? Please Like 👍 and Follow 🔔 to not miss the next analyses!

XAUUSD: A strong rebound toward 4,235 looks highly likelyHey everyone, it’s Erik here.
I’m closely watching a potential reversal zone on XAUUSD, which I’ve highlighted on my chart. Based on the current market structure, I expect price to face some rejection before continuing its move upward toward the 4,235 level.
This area could be a key decision point for the market. If buyers manage to hold the support, we could see a strong rebound and a continuation of the bullish momentum. But if price breaks below this zone, it could open the door for a deeper move down as liquidity builds beneath.
Should we get a clear bullish impulse, the next area I’ll be watching is T2. From there, we might see a period of accumulation or another sharp reaction, depending on the broader market sentiment at that time.
I’m simply sharing my personal view of the chart — this isn’t financial advice. Always confirm your own setups and manage your risk with patience and discipline.

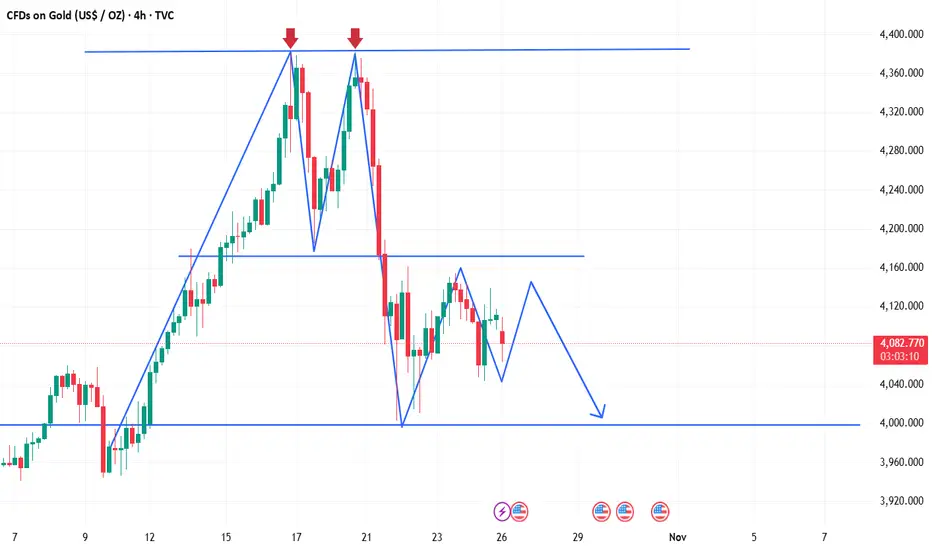
Gold analysis with trading ideasAfter nine consecutive weeks of strong gains, gold has entered a sharp correction phase. Driven by intense selling pressure, its nearly three-month winning streak has officially come to an end. However, given the persistently high levels of global geopolitical and economic uncertainty, the likelihood of a significant further decline in gold prices remains low, as safe-haven trading activity remains robust and dynamic. Currently, trade negotiations between the U.S. and China are still ongoing, while President Trump has announced the termination of all trade talks with Canada. Meanwhile, due to the U.S. Congress’ prolonged failure to pass an appropriations bill, the release of economic data continues to be disrupted, shifting traders’ focus back to central bank policies once again.
From a technical perspective, following the formation of a "double top" pattern on the 1-hour chart, gold has been oscillating under the resistance of the pattern’s neckline. Despite the bullish CPI data last Friday, gold bulls failed to push prices above the 4,160 level, indicating that short-term bullish momentum is still under significant pressure and gold is likely to remain in a wide-range consolidation. Looking at the 4-hour chart, after prices fell from the "double top" pattern, they rebounded with support from the acceleration line: the lower boundary of the range was reclaimed last Thursday, followed by a second bottoming-out and rebound on Friday—signaling that the short-term support at the lower boundary has been basically confirmed.
The key range currently lies between 4,060 and 4,170, and these two levels can be regarded as the dividing lines for short-term bullish and bearish trends. A break above 4,170 would suggest strengthened rebound momentum, potentially leading to a further test of the upper channel edge around the 4,300 area. Conversely, a break below 4,060 may trigger a continued decline toward the 4,000 support level—this forms the core framework for the current market movement.
Today’s trading strategy will revolve around the 4,000–4,170 range, prioritizing short positions at higher levels and long positions at lower levels. If prices break above 4,170, it will indicate that gold bulls have regained control, requiring a timely strategy adjustment to enter long positions on pullbacks.
XAUUSD Likely ScenarioGold is Bullish long term though due to double top it is bearish in short term. hence likely to get rejected at 4200 and drop upto 3950$ per troy once.
Gold need to create a strong consolidation base at 3950 to further go up. Presently it is likely to get rejected at 4200$

XAU/USD Gold support breakdown strong bearish trend📉 GOLD (XAU/USD) Sell Setup Alert 💰✨
🔹 Current Trend: Bearish momentum continues on the 1H timeframe
🔹 Support Breakdown Possible: from $3935 zone
🎯 Technical Targets:
1️⃣ TP1: $3894
2️⃣ TP2: $3826
⚠️ Watch for confirmation candles & volume before entry
📊 Always follow your risk management plan — protect your capital!
💬 What’s your view on this setup?
👇 Drop your thoughts in the comments!
📈 Like | 🔁 Share | 💬 Comment | 🔔 Follow for more live trade updates & insights!
#XAUUSD #GoldAnalysis #ForexTrading #PriceAction #SellSetup #RiskManagement #TraderMindset

Trade Idea – XAUUSD GO LONGOverview:
From the daily timeframe, we can see that the 4100 level remains intact, showing that buyers are still defending this zone. Price recently tapped into the H4 Fibonacci level at 4098, which acted as a strong support and triggered a bullish push. On the M15 timeframe, the bearish trendline has been broken — indicating an early shift in momentum from bearish to bullish.
🔍 Trade Plan (Buy Setup)
Entry Zone:
Wait for a retest between 4111.1 and 4106.3 before entering.
This area aligns with the recent structure retest and the broken M15 trendline — a potential confirmation of bullish continuation.
Stop Loss (SL):
4100 (below structure support and Fibonacci level)
Keep risk controlled — this is your invalidation point for the setup.
🎯 Take Profit (TP) Levels
TP 1 4117
For scalpers; quick exit on minor push.
TP 2 4123
Conservative intraday target.
TP 3 4131
Aligns with intraday resistance area.
TP 4 4137
Strong confluence level; previous structural high.
TP 5 4144
Extended target — potential top of range.
TP 6
Open Trail profits if bullish momentum continues.

GOLD Massive Long! BUY!
My dear friends,
Please, find my technical outlook for GOLD below:
The price is coiling around a solid key level - 4068.0
Bias - Bullish
Technical Indicators: Pivot Points Low anticipates a potential price reversal.
Super trend shows a clear buy, giving a perfect indicators' convergence.
Goal - 4087.0
Safe Stop Loss - 4058.5
About Used Indicators:
The pivot point itself is simply the average of the high, low and closing prices from the previous trading day.
Disclosure: I am part of Trade Nation's Influencer program and receive a monthly fee for using their TradingView charts in my analysis.
———————————
WISH YOU ALL LUCK

GOLD (XAUUSD) | Smart Money Buy Setup from Demand Zone 📝 Description:
Gold is showing a potential reversal structure from the lower demand zone after a liquidity grab near $3,962.
The price is now reacting bullishly from the mitigation block and aiming toward the supply zone at $3,984–$4,019.
Trade Plan:
Entry: From $3,972–$3,975 demand zone (after liquidity sweep)
Stop-Loss: Below $3,962 (structure invalidation)
Target: $4,019 (supply zone / PDH area)
Bias: Bullish – expecting continuation toward previous highs
R:R: ~1:3 setup
If price cleanly breaks above $3,984, expect further continuation to $4,029 (Previous Day High).
A failure to hold above $3,962 would invalidate this bullish setup.

Gold as of the momentGold continues its bullish run, pushing toward the $4,050 mark — momentum remains strong as investors rally behind the trend.”
Gold is eyeing $4,050, extending its bullish momentum! Market sentiment stays optimistic as demand strengthens.”
“Bullish energy in the gold market! Prices are climbing toward $4,050, reflecting growing investor confidence.”
GOLD BUY NOW!!!!!I`m still bullish as well on gold price is making a minor pull back to continue the rally to the upside am still going to buy gold here as far as our internal structure high have been taken out consider this pull back as retest.....

Gold Compresses Before the Fed Storm– Sideways or a Sudden Drop?Good day, fellow traders,
Looking at the current XAUUSD chart, this is truly a highly sensitive phase. After last week’s sharp decline, gold has been narrowing its range within a contracting triangle pattern on the 4-hour timeframe, with lower highs and higher lows — a clear sign that the market is “building pressure” before a potential breakout.
At the moment, price is hovering around 4,070 USD/oz, just below the EMA34 and EMA89 lines — indicating that sellers still hold a slight upper hand. The key support zone lies around 4,040, while the strong resistance level sits near 4,220, where a bearish reaction could occur if price retests that zone.
Combining this with the latest news — the USD continues to strengthen while the market awaits the upcoming FOMC meeting — I lean toward a sideways-to-slightly-bearish scenario over the next 24 hours. Price could fluctuate between 4,060–4,100, then drift lower to retest 4,040 or even 3,950, unless the Fed delivers an unexpectedly dovish tone.
In summary, XAUUSD is in a compression phase , awaiting a major catalyst. Without fresh bullish factors, the short-term trend remains sideways-bearish, with mild downside risk before any potential technical rebound.

XAUUSD Short term SwingThis probably will be a good setup, since its bearish now i suspect price will bounce around recent high to recent low to continue the trend.
Its also near the premium zone of 1H and its near breakout zone in 1D.
So we just need to wait a small liquidity grab inside 5m OB and CHOCH, and that is my entry.
If everything work accordingly, this can be 6R trade.
If there is any constructive feedback, please do so, i am still learning

XAUUSD (GOLD) – ASIA SESSION ANALYSIS RESULTS4️⃣ High-Probability Trade Scenarios
📉 SELL Setup (Main Bias)
• Entry Zone: 3,955 – 3,964 (Golden Zone)
• Confirmation: 5M/15M bearish engulfing or CHoCH after liquidity sweep.
• TPs: 3,940 → 3,930 → 3,916 → 3,898 → 3,886
• SL: Above 3,976
💡 Rationale: Rejection from fib zone aligns with H1 structure continuation; best risk-reward short setup.

Structure Neutral Until Breakout Confirmation”Currently, price is moving between two key zones
the upper OB (4040–4045) acting as resistance and the lower OB (3960–3980) serving as strong support.
Two Possible Scenarios...
Bullish Case: A break and hold above 4000 could push price toward the upper OB (4045 zone).
Bearish Case: A rejection from the mid-level 3980
may drag price back toward the lower OB / support zone (3960).
Key Levels:
Resistance: 4045
Support-1: 3998
Support-2: 3960
Wait for clear confirmation from either side before entering. This zone is no-trade territory until breakout.

GOLD Analysis Outlook The market has bounced strongly from the recent demand zone, showing renewed bullish momentum.
Price is currently trading above the 20 EMA (green) and testing the 200 EMA (red), adding confluence to a potential bullish continuation.
A sustained move above 4,025 could extend gains toward 4,200, 4,360, and 4,480.
However, a break below 3,910 would invalidate the bullish structure and shift bias to neutral.

short-term GOLD analysis🟡 Pattern Observed: Bullish Harmonic Formation (Potential Gartley/Deep Crab Variant)
The chart shows a completed harmonic reversal zone around point D, with a clear five-point structure (X-A-B-C-D).
This pattern indicates exhaustion of the prior down-leg and signals a potential bullish reversal in the short term.
📈 Bullish Projection
Immediate Reaction Zone: ₹ 4 020 – ₹ 4 030
Short-Term Upside Targets:
₹ 4 110 – ₹ 4 130 – initial profit-booking zone (previous minor swing).
₹ 4 170 – ₹ 4 190 – main harmonic target.
Extended Target (if momentum expands): ₹ 4 240 – ₹ 4 260.
Momentum oscillators are expected to turn upward from oversold regions once D is validated.
⚠️ Invalidation / Risk
Invalidation: A daily close below ₹ 4 000 (≈ below point X) negates the bullish setup.
Stop-loss Zone: ₹ 3 985 – ₹ 3 995 for traders.
Probability of Reversal: ≈ 70 % based on harmonic symmetry and candle positioning.
🧠 Summary
Parameter Observation
Pattern Type Bullish Harmonic (Gartley/Deep Crab)
Reversal Zone (PRZ) ₹ 4 000 – ₹ 4 030
Trend Expectation Short-term rebound
Targets ₹ 4 110 → ₹ 4 190 → ₹ 4 250
Stop-loss Below ₹ 4 000
Bias Bullish
Confidence ~70 %
📊 Conclusion
Gold appears to be completing a harmonic reversal zone near ₹ 4 000, signaling a short-term recovery phase.
A sustained bounce above ₹ 4 050 will confirm reversal strength, with potential for a ₹ 150–200 up-move.
Traders should stay long with tight risk management, watching for follow-through candles.
Disclaimer:
This analysis is for educational purposes only and does not constitute financial advice. Always use appropriate risk controls and confirm setups with your own system before trading.

Gold Under Pressure Sell Setup Near 3975XAU/USD is positioned near 3975, showing potential for a downside move as selling pressure builds and short term bullish momentum fades. If the current resistance holds, the pair could test the next support zone.
Key Levels:
Sell Entry: 3975
Take Profit: 3950
Stop Loss: 3995
Reasoning:
Technically, Gold has stalled near 3975, forming a local ceiling. Price action suggests that sellers may push the pair lower toward 3950.
Fundamentally, gold is facing headwinds from a firm U.S. dollar and rising interest rate expectations. Diminished haven demand and improving market sentiment in risk assets further limit upside potential.
Disclaimer:
This analysis is for educational purposes only and does not constitute financial advice.
