GOLD LONGLong gold from d ts, desitional block that created the true MSS, high bullish overall momentum from higher timeframes, liquidity grab at london open, D crt 50% target pending.
Trade ideas

Gold analysis with trading ideasAfter nine consecutive weeks of strong gains, gold has entered a sharp correction phase. Driven by intense selling pressure, its nearly three-month winning streak has officially come to an end. However, given the persistently high levels of global geopolitical and economic uncertainty, the likelihood of a significant further decline in gold prices remains low, as safe-haven trading activity remains robust and dynamic. Currently, trade negotiations between the U.S. and China are still ongoing, while President Trump has announced the termination of all trade talks with Canada. Meanwhile, due to the U.S. Congress’ prolonged failure to pass an appropriations bill, the release of economic data continues to be disrupted, shifting traders’ focus back to central bank policies once again.
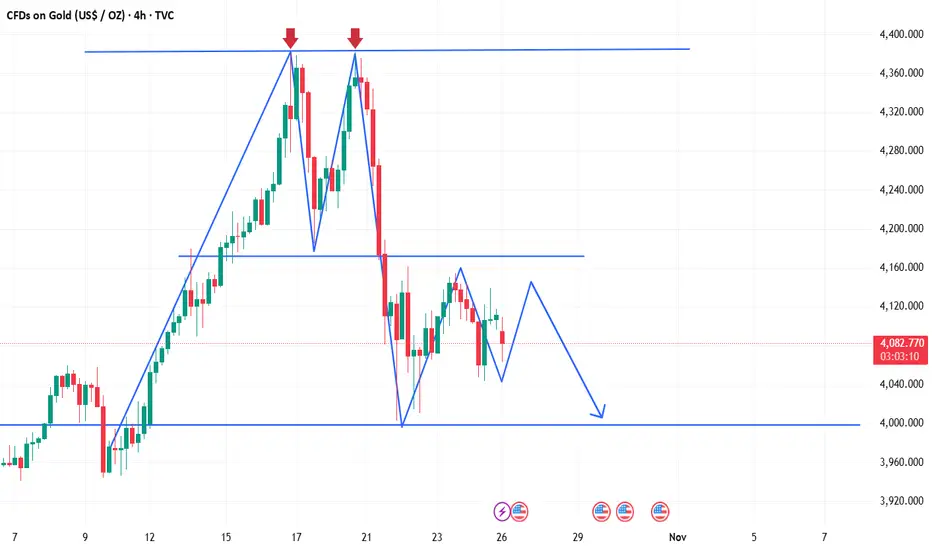
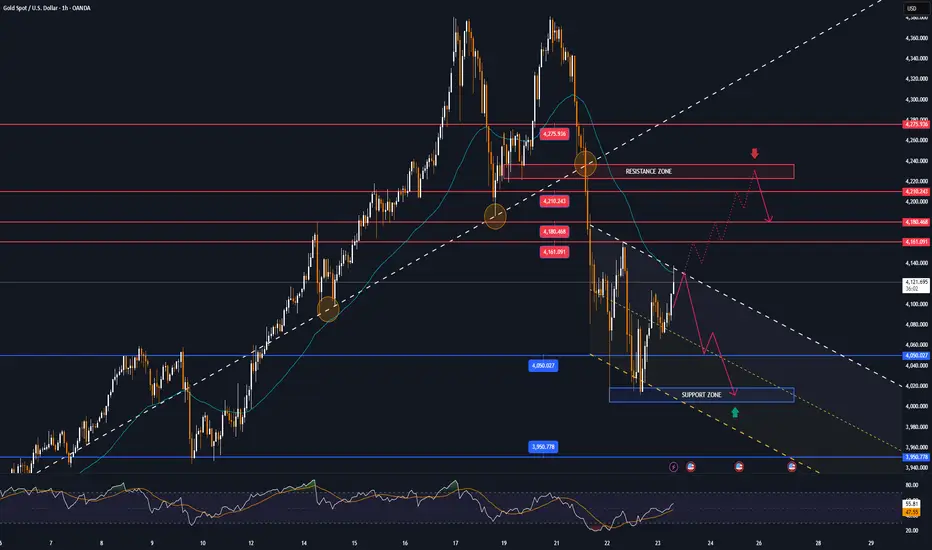
From a technical perspective, following the formation of a "double top" pattern on the 1-hour chart, gold has been oscillating under the resistance of the pattern’s neckline. Despite the bullish CPI data last Friday, gold bulls failed to push prices above the 4,160 level, indicating that short-term bullish momentum is still under significant pressure and gold is likely to remain in a wide-range consolidation. Looking at the 4-hour chart, after prices fell from the "double top" pattern, they rebounded with support from the acceleration line: the lower boundary of the range was reclaimed last Thursday, followed by a second bottoming-out and rebound on Friday—signaling that the short-term support at the lower boundary has been basically confirmed.
The key range currently lies between 4,060 and 4,170, and these two levels can be regarded as the dividing lines for short-term bullish and bearish trends. A break above 4,170 would suggest strengthened rebound momentum, potentially leading to a further test of the upper channel edge around the 4,300 area. Conversely, a break below 4,060 may trigger a continued decline toward the 4,000 support level—this forms the core framework for the current market movement.
Today’s trading strategy will revolve around the 4,000–4,170 range, prioritizing short positions at higher levels and long positions at lower levels. If prices break above 4,170, it will indicate that gold bulls have regained control, requiring a timely strategy adjustment to enter long positions on pullbacks.
XAUUSD Likely ScenarioGold is Bullish long term though due to double top it is bearish in short term. hence likely to get rejected at 4200 and drop upto 3950$ per troy once.
Gold need to create a strong consolidation base at 3950 to further go up. Presently it is likely to get rejected at 4200$

XAU/USD Gold support breakdown strong bearish trend📉 GOLD (XAU/USD) Sell Setup Alert 💰✨
🔹 Current Trend: Bearish momentum continues on the 1H timeframe
🔹 Support Breakdown Possible: from $3935 zone
🎯 Technical Targets:
1️⃣ TP1: $3894
2️⃣ TP2: $3826
⚠️ Watch for confirmation candles & volume before entry
📊 Always follow your risk management plan — protect your capital!
💬 What’s your view on this setup?
👇 Drop your thoughts in the comments!
📈 Like | 🔁 Share | 💬 Comment | 🔔 Follow for more live trade updates & insights!
#XAUUSD #GoldAnalysis #ForexTrading #PriceAction #SellSetup #RiskManagement #TraderMindset

BULLS IN CONTROL We are now buying, gold went down to test a major buy zone around 4004 and now are above 4125, so you can buy around 4129-24 and tp at 4190 or even allow it to run

Gold prices plummeted, analysis for next week!Gold market analysis for next Monday:
Gold finally experienced a sharp pullback. Yesterday, gold hit a high of 4379, then fluctuated back and forth, rising to a low of 4278 before rebounding to the intraday high. This is a typical extreme move driven by a short-term sell-off at high levels. This week, there seemed to be a series of one-way plunges of more than 80 points, followed by a rebound to offset the decline. While the Asian session rebounded, the US market presented a different picture! After the Asian session's correction, there was a V-shaped rebound, followed by a one-way decline after a high. The US market continued its decline, with a relatively wide range. The low reached 4186, a maximum difference of 193 points from the high of 4379. The 1-hour chart saw a second upward move, but pressure was applied at 4379, forming a double top. A sharp sell-off in the US market lowered the price to 4186. The daily chart recorded a large, real-body bearish candlestick. While a single candlestick pattern alone is insufficient to signal a reversal, the rapid pace of the previous rally suggests a technical correction is needed. The weekly chart support is far from support, so a short position at 4379 is still a viable option.
I saw a significant bearish trend on the daily chart, with a single bearish candlestick covering a bullish candlestick. The 4-hour chart also saw three large bearish candlesticks, resulting in a $170 drop. This indicates the presence of upward pressure, and this week's bullish rally has also led to a technical correction. Gold's pullback in the US market did not lead to a rebound, but instead broke down and fell. Short-term resistance has formed at 4280. If gold rebounds and finds pressure at 4280, short-term short positions are warranted. Gold may begin to adjust.
Yesterday, we repeatedly emphasized the importance of the 4280 area for gold. If it falls below this level, a direct short position could target the 4200-4180 area. Indeed, gold plummeted. This is the rhythm. Next Monday, consider shorting gold at the neckline resistance level of 4275-80. Overall, our short-term trading strategy for gold next Monday is to prioritize shorting on rallies, with a secondary focus on long positions on pullbacks. Focus on resistance at 4275-4280 in the upper short term, and support at 4180-4090 on the lower side. Be sure to keep up with the market. Specific price levels will be determined by real-time intraday data. Welcome to discuss real-time market trends.
Next Monday's gold trading strategy:
Selling strategy:
Short (sell) 20% of your position in batches when gold rebounds near 4275-4280, targeting the 4230-4200 range. A break below targets the 4180 level.
Buying strategy:
Buy (buy) 20% of your position in batches when gold pulls back near 4175-4180, targeting the 4230-4250 range. A break below targets the 4275 level.

GOLD cooling down, correction or signal of new cycle?Summary
“After three consecutive sessions of declines, gold is experiencing a short-term correction after a rally that has lasted more than two months. Despite falling nearly 6% from its recent peak, the medium-term uptrend remains solid as prices remain above the psychological level of $4,000 per ounce. This move reflects a technical cooling of an overbought market, rather than a fundamental reversal.
With the Fed expected to cut interest rates before the end of the year, geopolitical tensions lingering and the trend of “de-dollarization” spreading, gold continues to play a central role in the global safe-haven portfolio. Investors are now closely watching the price reaction around the $4,000 region, the balance point between short-term profit-taking pressure and medium-term accumulation momentum, while the technical outlook still favors a recovery trend if this support level holds.”
OANDA:XAUUSD corrects after 3-day decline, medium-term uptrend remains strong
Gold has fallen for three consecutive days, marking a technical correction after a long rally. Spot gold was hovering around $4,080/ounce on Tuesday morning, nearly 6% below its recent peak, reflecting a necessary pullback in an overbought market.
The decline comes amid global markets being cautious about the latest developments in US-China trade talks and unclear signals on the Federal Reserve’s interest rate path. Despite short-term pressure, gold remains a central part of the safe-haven portfolio, especially as geopolitical risks increase and major currencies face “soft devaluation” pressure.
Comment: “After a period of excessive growth, gold is correcting like an overstretched spring. The fact that the price is still holding above the $4,000 mark shows that this is a technical cooling process, not a fundamental reversal. The need for safe haven and defensive trades in the Dollar still exists.”
Gold has risen more than 55% year-to-date since mid-August, boosted by expectations of at least a 25 basis point cut by the Fed before the end of the year, along with a trend to hedge against inflation and widening budget deficits. The stability of the US dollar and ETF inflows supported gold prices, while silver and platinum recorded consecutive losses due to profit-taking pressure.
Traders are also focusing on new political-trade signals. US President Trump expressed optimism about a “good deal” at the upcoming meeting with Asian leaders, but admitted that a delay scenario is still possible. This situation has made the market sentiment “cautious but realistically optimistic,”.
The current decline reflects a technical correction, not a trend reversal. With the Fed likely to cut interest rates, persistent geopolitical tensions and the “de-dollarization” trend of some economies, gold remains a pillar in the global safe-haven structure. Investors should monitor the price reaction around the $4,000 mark, the balance point between short-term profit-taking and medium-term accumulation.
Technical outlook analysis of OANDA:XAUUSD
Gold Technical Outlook: Bulls Keep the Initiated Around $4,000
Gold prices are experiencing a short-term but strong correction, after a long rally since mid-August. On the daily chart, the decline has brought the price to test the important support cluster around $4,000–$4,050/oz, corresponding to the Fibonacci 0.618 zone and the MA50 average, which acts as a key “psychological milestone” for the bulls.
The RSI has retreated to near the neutral level of 50, reflecting a temporary cooling rather than a trend reversal. The major trend structure remains clearly bullish, as evidenced by the intact upward price channel.
If the $4,000 zone is maintained, gold is likely to enter an accumulation-recovery phase, with the nearest resistance zones at $4,160–$4,180 (Fibo 0.5) and $4,210–$4,275 (Fibo 0.382–0.236). Conversely, a loss of the $4,000 mark would trigger deeper profit-taking towards the extended support zone of $3,950.
The current correction suggests the market is consolidating its medium-term uptrend, with no signs of breaking the trend. Once sentiment stabilizes around the $4,000 threshold, new buying pressure is likely to return, especially if there are supportive signals from US economic data or expectations of a Fed rate cut.
SELL XAUUSD PRICE 4231 - 4229⚡️
↠↠ Stop Loss 4235
→Take Profit 1 4223
↨
→Take Profit 2 4217
BUY XAUUSD PRICE 4001 - 4003⚡️
↠↠ Stop Loss 3997
→Take Profit 1 4009
↨
→Take Profit 2 4015
Trade Idea – XAUUSD GO LONGOverview:
From the daily timeframe, we can see that the 4100 level remains intact, showing that buyers are still defending this zone. Price recently tapped into the H4 Fibonacci level at 4098, which acted as a strong support and triggered a bullish push. On the M15 timeframe, the bearish trendline has been broken — indicating an early shift in momentum from bearish to bullish.
🔍 Trade Plan (Buy Setup)
Entry Zone:
Wait for a retest between 4111.1 and 4106.3 before entering.
This area aligns with the recent structure retest and the broken M15 trendline — a potential confirmation of bullish continuation.
Stop Loss (SL):
4100 (below structure support and Fibonacci level)
Keep risk controlled — this is your invalidation point for the setup.
🎯 Take Profit (TP) Levels
TP 1 4117
For scalpers; quick exit on minor push.
TP 2 4123
Conservative intraday target.
TP 3 4131
Aligns with intraday resistance area.
TP 4 4137
Strong confluence level; previous structural high.
TP 5 4144
Extended target — potential top of range.
TP 6
Open Trail profits if bullish momentum continues.

Gold Stuck Near $4,100 Ahead of CPI Market Pulse:
Gold is holding steady around $4,100, caught between uncertainty and opportunity as traders brace for the US CPI release and new developments in US–China trade talks.
The yellow metal has paused its recovery from $4,050 → $4,160, while the US Dollar and bond yields edge higher amid renewed geopolitical tension and surging oil prices.
This is the classic “calm before volatility” moment — the market is simply waiting for data to decide the next wave.
If CPI comes in softer or trade talks disappoint, liquidity could flood back into gold, breaking above 4,155–4,160 and opening the path toward 4,215 → 4,261.
But a strong CPI surprise could flip sentiment fast — dragging price back into the 4,056 and 4,018 buy zones, where the next reaction will decide direction.
📊 Technical Outlook (M30)
Price continues to coil within a tight structure between 4,100 – 4,155, forming a “spring compression” right below trendline resistance.
Market flow suggests accumulation beneath 4,100, hinting that liquidity is building before the next expansion.
Key Structure Zones:
Resistance Pivot: 4,154 – 4,155 → Key breakout level
Breakout Support (CP Zone): 4,056 – 4,060
Liquidity Buy Zone: 4,018 – 4,020
Sell Zone (Fibo Reaction): 4,215 – 4,261
🎯 Trading Plan – MMFLOW Style
🔹 BUY PLAN – Reaccumulation Base
Entry: 4,056 – 4,060
Stop Loss: 4,045
Targets: 4,100 → 4,140 → 4,155
Focus on reaction candles & liquidity grab confirmation.
🔹 BUY PLAN – Liquidity Sweep Setup
Entry: 4,018 – 4,020
Stop Loss: 4,005
Targets: 4,056 → 4,100 → 4,150
If liquidity sweeps this zone clean, watch for a sharp recovery flow.
🧭 Summary – MMFLOW View
Gold is in “decision mode”, waiting for CPI and macro catalysts to trigger the next trend.
The structure stays neutral-bullish as long as price holds above 4,056.
A confirmed breakout above 4,155 may unlock a fast rally toward 4,215–4,260, while a break below 4,018 could open the door for one more liquidity flush.
⚜️ MMFLOW Bias: “No need to predict the move — just follow the flow when liquidity confirms.”
📊 Do you expect gold to break higher after CPI, or trap traders before reversing?
👉 Follow MMFLOW TRADING for daily flow-based setups, structure breakdowns, and institutional insights.

XAUUSD on consolidation ready for again upside XAUUSD is cool down & captured the consolidation zone from 4090-4140 .
What are my conditions For Today's session?
Currently i m looking for buy trade from 4085-4175 zone ,I'm expecting H4 and H1 Candle closing will be above 4100 .
Targets: 4145- 4175.
✳️Secondly if H4-H1 candle closes below 4070
our buying will be postpond and market will test 4045.

GOLD Massive Long! BUY!
My dear friends,
Please, find my technical outlook for GOLD below:
The price is coiling around a solid key level - 4068.0
Bias - Bullish
Technical Indicators: Pivot Points Low anticipates a potential price reversal.
Super trend shows a clear buy, giving a perfect indicators' convergence.
Goal - 4087.0
Safe Stop Loss - 4058.5
About Used Indicators:
The pivot point itself is simply the average of the high, low and closing prices from the previous trading day.
Disclosure: I am part of Trade Nation's Influencer program and receive a monthly fee for using their TradingView charts in my analysis.
———————————
WISH YOU ALL LUCK

GOLD sellsSells idea for continuation bears if friday US CPI data comes in as expected or even higher. which could signical that inflation is still persistant so the FEd my be hesitant to continue any future rate cuts which can results in more capital investor inflows due to the higher returns offered by higher rates.

Gold – Has the Positioning Cleanout Ended?In our update on Monday, we discussed the possible involvement of speculators in recent Gold moves and the potential for higher volatility that this could generate because they tend to liquidate positions quickly when a particular move turns stale.
It seems this may have had an impact on Gold prices this week, with a push to record highs of 4381 on Monday followed by a sharp reversal and drop down to lows at 4004 on Wednesday morning, a straight line move that may have more similarities with Bitcoin price action than the potential number 1 safe haven asset of choice for investors.
Now, with traders still reeling from the speed of changes in Gold prices, the emphasis may shift to short term drivers with the US and EU announcing further sanctions on Russian energy in an attempt to end the war in Ukraine, while uncertainty is growing around trade discussions between the US and China after the White House yesterday announced it is considering applying new broad software export restrictions against China, bringing into doubt the ability of the 2 sides to reach an agreement in time for President Trump and Chinese President Xi to potentially still meet at some stage next week.
Also, with the on-going US government shutdown starving traders of some key economic data readings ahead of a crucial Federal Reserve (Fed) interest rate decision next week (Wednesday October 29th), the delayed US CPI reading on Friday, due at 1330 BST may take on increased significance. Any CPI reading above market expectations could lead to a stronger dollar with potential negative implications for Gold, while an in-line or below print could help to stabilise prices around current levels.
Looking forward, with so much uncertainty surrounding the current direction of Gold, it can be helpful to adapt your approach from a technical aspect to initiating trades. This may mean assessing the wider perspective through a daily chart, before moving to a more near-term approach, using a 4 hourly chart to monitor prices ahead of the key risk events into the weekend.
This may help you to adjust your time horizons to potentially take advantage of any short term over extension of moves that could be followed by a quick snap back/reversal as investors consider the wider macro backdrop.
Technical Update: Gold - The Daily Perspective
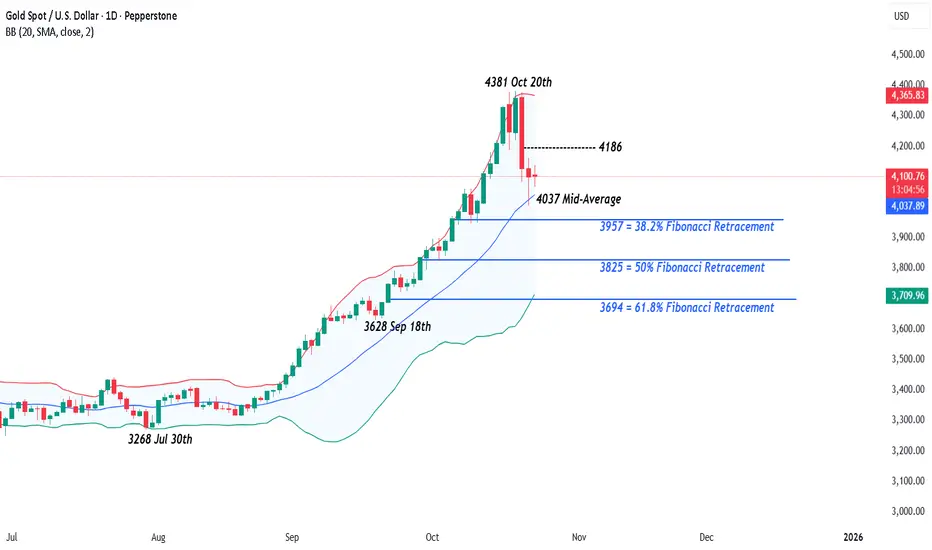
During periods of high volatility, prices often become stretched away from the 20-period Bollinger mid-average, driven by momentum or sentiment extremes. However, when sentiment shifts direction, price tends to snap back sharply to the average, highlighting the market’s tendency to revert after an overextension.
As shown on the daily chart above, Gold’s latest price weakness could possibly be seen as a similar snap-back move. However, the rising daily Bollinger mid-average, currently at 4037, has so far held the decline on a closing basis, suggesting reversion might be at play following recent volatility.
Traders could now be focusing on this 4037 Bollinger mid-average as a daily support focus, with closing defence of this level watched over the coming key risk events.
However, by also monitoring the 4-hourly chart, it may offer earlier clues to shorter term directional risks, helping traders to anticipate whether longer term momentum is building again or may stall.
Potential Shorter Term Support Levels:
With the 4037 daily Bollinger mid-average already acting as support, the 4-hourly chart perhaps adds another layer of interest. It suggests 4004 as also a potential support level. This is equal to the 38.2% Fibonacci retracement of the September 18th to October 20th rally, and current price action suggests attempts at recovery may well be developing from here.
While not a guarantee of further weakness, 4-hourly closing breaks below the 4004/4037 range, a combination of both the daily and 4 hourly supports, could signal further price weakness. Such breaks may open the way for tests of 3944, the October 9th low, and potentially 3915, the deeper 62% Fibonacci retracement.
Potential Shorter Term Resistance Levels:
Following the recent recovery from the 4004/4037 support zone, the 4-hourly chart suggests 4141 could now be the first resistance focus. This level marks the 38.2% Fibonacci retracement of the October 20th to 21st decline and has already capped earlier attempts at price strength on Wednesday, perhaps further increasing traders attention on this level.
A confirmed 4-hour closing break above 4141 in Gold could lead to further attempts to move higher with 4184, the 50% retracement of the recent decline potentially then the next resistance.
If this level gives way, the rally could have potential to extend towards 4227, which is the higher 62% retracement.
The material provided here has not been prepared accordance with legal requirements designed to promote the independence of investment research and as such is considered to be a marketing communication. Whilst it is not subject to any prohibition on dealing ahead of the dissemination of investment research, we will not seek to take any advantage before providing it to our clients.
Pepperstone doesn’t represent that the material provided here is accurate, current or complete, and therefore shouldn’t be relied upon as such. The information, whether from a third party or not, isn’t to be considered as a recommendation; or an offer to buy or sell; or the solicitation of an offer to buy or sell any security, financial product or instrument; or to participate in any particular trading strategy. It does not take into account readers’ financial situation or investment objectives. We advise any readers of this content to seek their own advice. Without the approval of Pepperstone, reproduction or redistribution of this information isn’t permitted.
Gold Towards Buy side liquidity Entry: 4,140 – 4,145 (Breakout confirmation above zone)
Stop Loss: 4,119
Take Profit:
TP1: 4,300
TP2: 4,350
TP3: 4,400
Risk/Reward: ~1:3
Trend: Bullish
Confidence: 🔥 Medium–High
Gold is showing signs of a bullish continuation from the current 4H accumulation zone (~4140). After a previous ChoCH from Equal Highs, price is consolidating below liquidity ($$$) with an ascending triangle structure. A clean breakout above the range could trigger a move toward the Weak High zone (4350–4400).
Bias: Bullish continuation
Pattern: Ascending Triangle / Liquidity Accumulation
Structure: Higher-Low formation after ChoCH

Gold finally has a supply range! Time for bullish correction?I talked about everything but the obvious inverse head and shoulders/Quasimodo forming the right shoulder now. If everything goes right can we expect an arm to extend upwards here during the stochastic buy cycle?
Let me know what you think and be sure to share and care for others if you found this helpful.
Also talked about the "REAPER WARNING" as we have a reaper inversion range actively terrorizing price 🧩

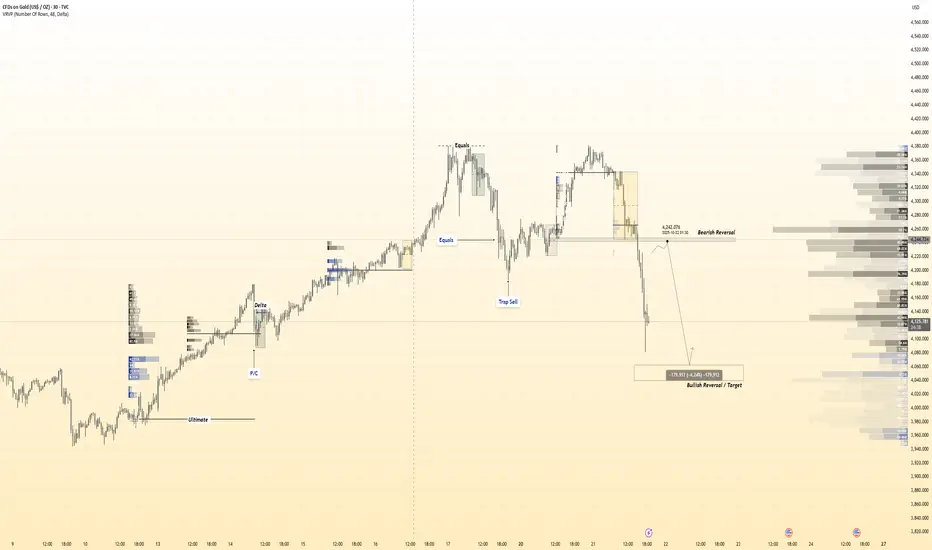
( HANZO Gold Protocol ) Bearish Reversal DetectedTime Frame: 30-Minute Warfare
Entry Protocol: Only after volume-verified breakout
🩸Bearish Reversal - 4240
🆚 Reasons To Enter The path
————
➕ Volume Engaged & Confirmed
➕ Time Zone Aligned (London / NY)
➕ Liquidity Cleared Below
➕ Cluster Shield Active
➕ Delta Shift Showing Buyer Control
➕ Reversal Formation Detected
➕ Price Below POC – Ready for Retrace
➕ Entry Prepared with Zero Emotion
Gold Elliott Wave– Potential Wave (4) Completion ZoneGold (XAU/USD) on the daily chart appears to be completing a classic Elliott Wave 5-wave impulse structure. After a strong rally into the wave (3) high, price is currently retracing toward the projected wave (4) correction zone.
The highlighted support area aligns with key Fibonacci retracement levels:
0.5 retracement: around $3,845
0.618 retracement: around $3,718
This region also coincides with the lower boundary of the ascending channel, adding confluence for potential bullish reversal.
If wave (4) finds support within this zone and maintains structure, a new impulsive rally toward wave (5) could begin — targeting the upper trendline resistance near $4,500–$4,600.

XAUUSD remains stable at high levels, focus on what comes nextHey everyone, Erik here.
XAUUSD has been showing strong momentum lately. After a sharp decline, the market quickly recovered, rebounding powerfully from the lower boundary of the newly projected channel. What initially appeared as weakness was actually a calculated shakeout, trapping sellers before reversing upward with confidence.
This behavior is typical of strong bullish trends. It clears out weak positions, triggers stop losses, and restores balance before the next upward movement. At this stage, the market appears to be entering the early phase of a new bullish impulse.
There might be a short consolidation or a slight correction, but the momentum is clearly pointing toward the upper boundary of the channel. For XAUUSD, the bullish continuation scenario seems far more convincing.
My target is around 4,585, near the upper resistance zone of the projected channel. The overall market structure remains decisively bullish, and the emotional surge during the last drop may become the fuel that powers the next strong rally.

Gold drops sharply, but don't give up just yet.Hello traders,
Gold experienced a sharp decline on October 21st , as investors began to take profits following strong expectations that the U.S. might cut interest rates. This is a necessary correction after a sustained rally that pushed gold to record highs. However, don’t be too quick to assume this signals a strong downtrend – even during this correction, gold still maintains certain strength.
With the easing of trade tensions between the U.S. and China, as indicated by President Donald Trump's forecast of a peace deal , the demand for safe-haven assets like gold might decrease. However, keep in mind that, in the long run, factors such as the Fed’s ongoing low interest rate policy will continue to support gold prices.
The current chart shows gold recovering after a sharp drop to the support level of 4,020,000 USD/ounce , with a strong bullish candle forming above the EMA 34 line (red), signaling the continuation of the long-term uptrend. The next target could be 4,210,000 USD/ounce, but before reaching this level, gold might experience a slight correction, providing an opportunity to enter at a more attractive price. If you are holding gold, be patient and wait for the next breakout.

XAUUSD: Market Analysis and Strategy for October 23Gold Technical Analysis
Daily Resistance: 4380, Support: 4000
4-Hour Resistance: 4185, Support: 4015
1-Hour Resistance: 4160, Support: 4065
Gold prices have fluctuated significantly recently. A trading institution recently reviewed the historical trends of gold prices after nine consecutive weeks of gains and concluded that a 20%-40% correction is typical over the next year, with the exception of 1970. Investors should be prepared for a potential multi-month decline of 20%-40% and manage their funds accordingly. However, the long-term bull market logic for gold remains solid. Factors such as the restructuring of the global monetary and credit system, the trend of de-dollarization, continued gold purchases by central banks, and structural imbalances in supply and demand constitute the core support for gold's rise.
This view also aligns with the forecasts of many international investment banks for gold prices next year. This year's insane rally is undoubtedly unsustainable. The simple reason is that there is no such thing as a stock that only rises and never falls in the trading market.
As for the future market trend, I personally believe that after the rebound, gold will fall below 4000 points, perhaps even back to the 3750-3850 range. This would be a very good place to buy the dip. It also represents the 50% and 61.8% golden ratios of the upward trend from the August low of around 3311. Furthermore, 4000 points is a key psychological support level for retail traders; a break below this level would prompt many undecided traders to exit.
For today's trading, follow a sideways range, selling high and buying low. Focus on the upper resistance levels of 4160/4185 and the lower support levels of 4065/4015.
BUY: 4065 near
BUY: 4015 near
SELL: 4160 near
SELL: 4185 near
More Analysis →

Gold Compresses Before the Fed Storm– Sideways or a Sudden Drop?Good day, fellow traders,
Looking at the current XAUUSD chart, this is truly a highly sensitive phase. After last week’s sharp decline, gold has been narrowing its range within a contracting triangle pattern on the 4-hour timeframe, with lower highs and higher lows — a clear sign that the market is “building pressure” before a potential breakout.
At the moment, price is hovering around 4,070 USD/oz, just below the EMA34 and EMA89 lines — indicating that sellers still hold a slight upper hand. The key support zone lies around 4,040, while the strong resistance level sits near 4,220, where a bearish reaction could occur if price retests that zone.
Combining this with the latest news — the USD continues to strengthen while the market awaits the upcoming FOMC meeting — I lean toward a sideways-to-slightly-bearish scenario over the next 24 hours. Price could fluctuate between 4,060–4,100, then drift lower to retest 4,040 or even 3,950, unless the Fed delivers an unexpectedly dovish tone.
In summary, XAUUSD is in a compression phase , awaiting a major catalyst. Without fresh bullish factors, the short-term trend remains sideways-bearish, with mild downside risk before any potential technical rebound.

short-term GOLD analysis🟡 Pattern Observed: Bullish Harmonic Formation (Potential Gartley/Deep Crab Variant)
The chart shows a completed harmonic reversal zone around point D, with a clear five-point structure (X-A-B-C-D).
This pattern indicates exhaustion of the prior down-leg and signals a potential bullish reversal in the short term.
📈 Bullish Projection
Immediate Reaction Zone: ₹ 4 020 – ₹ 4 030
Short-Term Upside Targets:
₹ 4 110 – ₹ 4 130 – initial profit-booking zone (previous minor swing).
₹ 4 170 – ₹ 4 190 – main harmonic target.
Extended Target (if momentum expands): ₹ 4 240 – ₹ 4 260.
Momentum oscillators are expected to turn upward from oversold regions once D is validated.
⚠️ Invalidation / Risk
Invalidation: A daily close below ₹ 4 000 (≈ below point X) negates the bullish setup.
Stop-loss Zone: ₹ 3 985 – ₹ 3 995 for traders.
Probability of Reversal: ≈ 70 % based on harmonic symmetry and candle positioning.
🧠 Summary
Parameter Observation
Pattern Type Bullish Harmonic (Gartley/Deep Crab)
Reversal Zone (PRZ) ₹ 4 000 – ₹ 4 030
Trend Expectation Short-term rebound
Targets ₹ 4 110 → ₹ 4 190 → ₹ 4 250
Stop-loss Below ₹ 4 000
Bias Bullish
Confidence ~70 %
📊 Conclusion
Gold appears to be completing a harmonic reversal zone near ₹ 4 000, signaling a short-term recovery phase.
A sustained bounce above ₹ 4 050 will confirm reversal strength, with potential for a ₹ 150–200 up-move.
Traders should stay long with tight risk management, watching for follow-through candles.
Disclaimer:
This analysis is for educational purposes only and does not constitute financial advice. Always use appropriate risk controls and confirm setups with your own system before trading.

Continuation of downtrendI believe we will see a continuation of a downtrend to 3800-3500 before we consolidate for another higher run.
FOMC soon and signs show inflation is higher than expected - additional rate cuts may not happen. Market priced in 25bps so it will be a sell the news
