FCR Setup - 30 Oct 2025Made this setup for today - 30th Oct. Ended up on winning trade for the day. FCR Setup for this.
Trade ideas

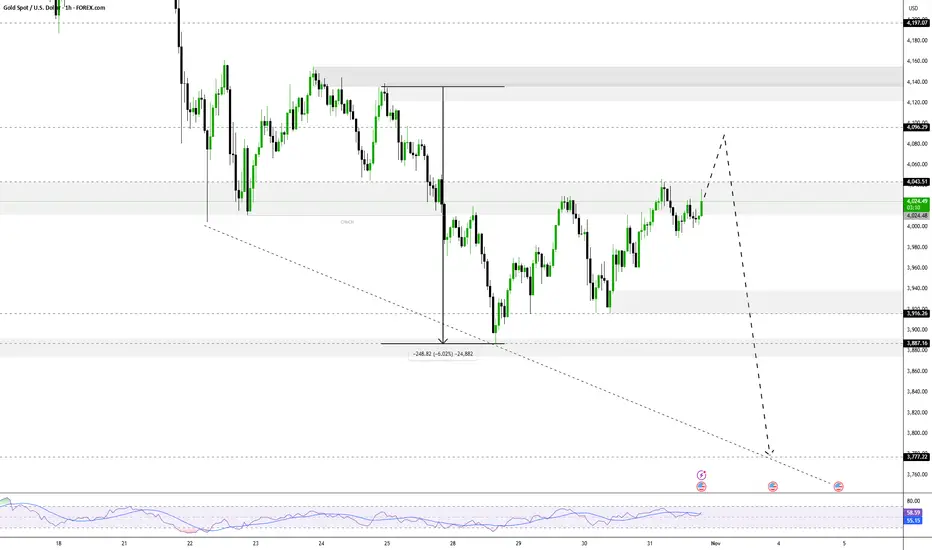
XAUUSD Buy Setup - Bearish Continuation From 40301H chart shows strong bearish
impulse followed by consolidation.
Price holding above structure — continuation likely if support holds.
Setup: bearish on back near 4030 with targets up to 3880,
Stop below 4040 to protect from invalidation.
‹ Educational analysis only. Not financial advice


XAUUSD ANALYSIS🪙 XAU/USD – Market Insight (Breakout Confirmation)
Structure Update
Price has broken above the descending trendline, marking the first valid breakout after multiple lower-high rejections.
The breakout candle closed above the diagonal, aligning with the Breaker Block + FVG (3,955–3,968) zone.
This area now transitions from resistance into a potential support-retest zone.
Current Context
The broader trend remains bearish, but the breakout suggests a possible short-term retracement phase before trend continuation.
The structure between 3,955–3,968 will decide whether price sustains momentum upward toward 3,985–3,994 (OB/Golden Reaction Zone) or rejects back to the 3,905 liquidity pocket.
Scenarios to Monitor
1️⃣ Bullish Case (Continuation)
Price holds above 3,955 and shows bullish confirmation at the retest zone.
Next potential upside area: 3,985–3,994, where OB and equilibrium converge.
Above 3,994, the next liquidity target lies around 4,010–4,020 (premium zone).
2️⃣ Bearish Case (Fake-out)
If the candle closes below 3,955 after retest, the breakout invalidates.
This would signal a liquidity sweep, opening room for a move back toward 3,905 and possibly the weak low near 3,880–3,890.
Trader Lenses
Scalper: Watch M1–M5 reactions within 3,955–3,968. A small rejection-retest can offer short-term confirmation bias.
Intraday: Focus on M15–H1 structure holding above 3,955 before anticipating upside toward OB zone.
Swing: Wait for H4 confirmation. The trendline break alone isn’t enough—need BOS above 3,994 to shift higher-timeframe bias.
Market Sentiment Factors
Gold remains sensitive to USD index moves and bond yields.
Any hawkish Fed comment or strong US data may limit upside; weaker USD can support retracement strength.
⚠️ Disclaimer
All analysis provided is for educational and informational purposes only.
This does not constitute investment advice or a buy/sell signal.
Always manage your risk and confirm entries with your own strategy.

The gold price is still in the process of correcting Wave 4The gold price is still in the process of correcting Wave 4, and nothing has changed structurally.
Currently, the price continues to respect the corrective zone we have been monitoring, and the internal waves still support the complex WXY pattern. This tells us one thing:
⏳ The correction is not over.
Once Wave 4 is complete, the real opportunity will begin:
✅ First impulse up → confirms trend resumption
✅ Pullback (Wave 2) → optimal entry point
✅ Wave 3 → highest potential reward 🚀
If the price breaks above the current resistance zone from here, we will monitor the alternative count. However, as long as the structure hasn't confirmed it, we remain patient.
Remember:
Corrections are designed to test patience.
Wave 4 is historically the most complex wave; triangles, flats, and complex structures are common.
Remain disciplined. Let the structure settle. The next leg up will be worth the wait.
Based on my experience and my IDA, the market should sell. My taBased on my experience and my IDA, the market should sell. My target is you can trade according to your own calculations.

Gold /XAUUSD long🎯 Idea Summary:
· Direction: Long
· Instrument: XAUUSD (Spot Gold)
· Primary Timeframe: 4H
· Bias: Bullish (Counter-trend bounce)
📊 Technical Rationale:
· Market Structure: The longer-term trend is still bullish, but price has corrected into a major support zone. Looking for a bounce.
· Key Levels:
· Support: $2315** (Previous Resistance), **$2300 (Major Psychological & Swing Low)
· Resistance: $2340** (Recent Swing High), **$2355 (21 EMA)
· Price Action / Pattern: Price is approaching the $2315 support. Watching for a bullish reversal candle (like a hammer or bullish engulfing) for a confirmation signal.
· Confluence:
· The $2315 level coincides with the 61.8% Fibonacci retracement of the last major up-move.
· RSI is entering oversold territory (<30), suggesting selling pressure may be exhausting.
⚙️ Trade Setup:
· Entry Zone: $2315 - $2320 (On a bullish confirmation candle)
· Stop Loss: $2305 (Just below the key $2300 psychological level and the Fib level)
· Take Profit Targets:
· TP1: $2340 (First resistance, take 50% off)
· TP2: $2350 (21 EMA & next resistance)
· Risk-Reward Ratio: ~1:2.5
💡 Narrative / Fundamental Context:
This is a mean-reversion play within a bull market.The confluence of a major Fibonacci level, prior support, and oversold RSI creates a high-probability zone for a technical bounce. A break below $2300 would signal a much deeper correction is likely.
Disclaimer: This is my personal analysis and not financial advice. Trading commodities like gold carries a high level of risk. Always do your own research (DYOR) and manage your risk appropriately.

$GOLD topped until 2026?TVC:GOLD seems topped, by 105 days cycle 15(weeks) we can await a pullback after left ranslation by gold

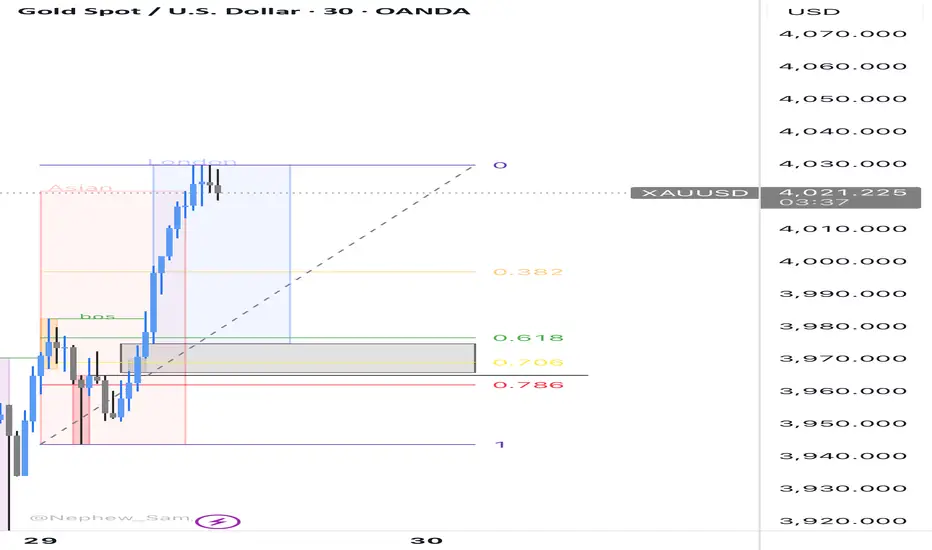
Sell XAUUSDFrom this 1H chat, I have 3 narratives that could play out
- London session didn’t sweep Asian’s liquidity with means US session would sweep London liquidity
- using Fibonacci tool, I see that golden zone 0.618 … there’s also an Imbalance in that area
- the last bearish candle before an impulse move is an order and it’s around that area
There’s a current resistance now
You know what to do with this information
GOLD Still Very Bearish , 2 Short Setups Valid To Get 500 Pips !Here is My 30 Mins Gold Chart , and here is my opinion , we are Below 3972.00 With 4H Candle And this never happened for a long time ! and we have a 4H Candle closure below it And Perfect Breakout and this give us a very good confirmation , so we have a good confirmation now to can sell after the price go back to retest the broken area 3972.00 and this will be my best place to sell to can use small stop loss , and i have another place if he price will not go up more to retest 3972.00 m we have a very good res level 3940.00 , if we have a good bearish price action when the price touch it we can sell from it and targeting 100 to 200 pips , and if the price didn`t give us a good bearish price action from it i will wait the price at 3972.00 to can sell and targeting 200 to 500 pips , if we have a daily closure above this area this mean this idea will not be valid anymore .
Reasons To Enter :
1- Perfect Breakout .
2- Clear Bearish Price Action .
3- Bigger T.F Giving Good Bearish P.A .
4- Bearish Control .
5- Perfect 4H Mins Closure .

Don't rush into gold; it's still going to fall!Although current market news is generally bullish for gold, the recent decline in gold prices is primarily driven by large-scale profit-taking and a technical correction that has been stronger than expected. Gold is currently at a critical turning point. Tuesday's sharp drop has indeed weakened the short-term trend, but Wednesday's rebound and the bullish engulfing pattern formed on the 4-hour chart clearly indicate solid buying support below. Overall, gold prices are likely to fluctuate and consolidate in the short term between 3980 and 4145-4155, awaiting new directional catalysts. Gold is currently in a correction cycle, with overall momentum weak. Therefore, the recommended trading strategy is to short on rallies. Sell on rallies!!!

Gold Bull Market Outlook And Targets: 5000 USD/7500 USDGold Bull Markets Long Term Overview and 2025 Market Update
________________________________________
🌊 Five-Wave Roadmap — Targets & Timing
• Wave 1 (2016–2020): From ~$1,050–1,200 to the COVID-era spike; established secular up-trend.
• Wave 2 (2020–2022): Consolidation/corrective pullback (~–20%).
• Wave 3 (2023–2025/26): Power leg to ATHs (current). Room to extend toward $4,200–$4,500 on flow surges before pausing.
• Wave 4 (2026, base case): Re-accumulation/consolidation ~12 months; likely range-bound –10% to –15% from the Wave-3 peak as institutional buying digests gains.
• Wave 5 (2027–2030/32): Final thrust to the cycle’s terminal zone:
– First objective: $5,000–$5,500 (consistent with 2026 Street “bull wave” scenarios).
– Terminal extension: $7,500–$8,000 by 2030–2032 (our desk’s stretch path if real yields stay muted, official-sector demand persists, and private capital rotation broadens).
Why Wave-4 can last ~12 months: prior secular bulls often paused for a full year near major breakouts while flows “change hands.” Expect lower realized vol, fading retail FOMO, and steady official accumulation to define the tape.
📈 Top 10 Stats of the Current Bull 2025
1. Price & ATHs: Spot ~$3.75–$3.79k; fresh ATH $3,790.82 on Sep 23, 2025.
2. 2025 YTD: Roughly +40–43% YTD
3. Central Banks: 1,045 t added in 2024 (later revised to ~1,086 t as lagged data came in). H1/Q1’25 tracking remained elevated.
4. ETF Flows: Back-to-back strong quarters; Q2’25 total demand 1,249 t, value US$132bn (+45% y/y) with ETFs instrumental.
5. Gold vs Equities: Gold ≈+40% vs S&P 500 ≈+13% total return YTD.
6. Jewelry Demand: Tonnage softened as prices surged; value at records (2024 down y/y; weakness persisted into H1’25).
7. Gold–Silver Ratio: ~85–88 (silver torque improving as it pushes into the mid-$40s).
8. Macro Link: Safe-haven bid + expected policy easing keep real-yield headwinds contained.
9. Technical: Confirmed 13-yr cup-and-handle breakout (Mar ’24) underpinning trend.
10. Street Forecasts: GS baseline $4,000 by mid-’26; bulled-up houses (HSBC/BofA) flag $4.9–$5.0k potential into 2026 if private/ETF rotation persists.
• This cycle is different: record central-bank buying + renewed ETF inflows + lower real rates = powerful tailwind.
• Price: Gold notched fresh ATHs this month (up to $3,790.82). 2025 is shaping up as the strongest year since the late 1970s.
• Relative: Gold is crushing equities YTD (≈+40% vs S&P 500 ≈+13% total return).
• Setup: A 13-year “cup-and-handle” breakout in 2024 kick-started the move.
• Outlook: Street base cases cluster near $4,000 by mid-’26; several houses now publish $4,900–$5,000 stretch targets into 2026 as flows accelerate.
________________________________________
🏆 Historic Gold Bull Markets — Timeline & Stats
1. 1968–1980 “Super Bull”
• Start/End: ~$35 → $850 (Jan 1980)
• Gain: ~2,330%
• Drivers: End of Bretton Woods, oil shocks, double-digit inflation, geopolitical stress.
• Drawdown: ~–45% (1974–1976) before the final blow-off run.
2. 1999–2011/12
• Start/Peak: ~$252 (1999) → ~$1,920 (2011–12)
• Gain: ~650%
• Drivers: Commodities supercycle, EM demand, USD weakness, GFC safe-haven bid.
3. 2016/2018–Present (The “CB-Led” Cycle)
• Start Zone: $1,050–$1,200 → New ATH $3,790 (Sep 2025)
• Gain: ~215–260% (depending on 2016 vs 2018 anchor)
• Drivers: Record central-bank accumulation, sticky inflation/low real rates, geopolitics; 2024 13-yr base breakout.
________________________________________
📊 At-A-Glance Comparison (Updated 2025)
Metric | 1968–80 Super Bull | 1999–2012 | 2016/18–2025 Current
🚀 Total Gain | ~2,330% | ~650% | ~215–260% (so far)
⏲️ Duration | 12 yrs | 13 yrs | 7–9 yrs (ongoing)
💔 Max Drawdown | ~–45% (’74–’76) | ~–30% (’08) | ~–20% (2022)
🏦 Main Buyer | Retail/Europe | Funds/EM | Central Banks
🏛️ Pattern | Secular parabolic | Cyclical ramps | 13-yr base → breakout (’24)
Notes: current-cycle characteristics validated by WGC demand trends & the 2024 technical breakout.
________________________________________
________________________________________
________________________________________
🔄 What Makes This Bull Different 2025 Edition
• 🏦 Central-Bank Dominance — Third consecutive 1k+ tonne year in 2024; 2025 is still tracking strong on a run-rate basis. This “sticky” demand is from price-insensitive reserve managers.
• ⚡ Faster Recoveries — Drawdowns are shallower/shorter vs the 1970s analog, consistent with a structural rather than speculative buyer base.
• 📈 Coexisting With Risk Assets — ATHs with equities positive YTD = macro hedge + diversification bid, not just “panic buying.”
• 📐 Structural Breakout — 13-yr base cleared in 2024; market now in multi-year price discovery.
________________________________________
🎯 Strategy Ideas 2025 & Beyond
• Buy/Hold on Dips: Stagger entries (DCA) into physical (allocated), ETFs (e.g., GLD/IAU), and quality miners/royalties.
• Prefer Physical/Allocated where counterparty risk matters; use ETFs for liquidity and tactical tilts.
Satellite/Leverage
• Silver & GSR Mean-Reversion: With GSR ~85–88, silver historically offers torque in up-legs. Pair with high-quality silver miners.
• Factor Tilt in Miners: Prioritize low AISC, strong balance sheets, reserve growth, rule-of-law jurisdictions; emphasize free-cash-flow yield and disciplined capex.
Risk-Management
• Define max drawdown per sleeve; pre-plan trims near parabolic extensions or if macro invalidates (e.g., real-yield spike).
• Use options overlays (collars on miners; long-dated calls on physical proxies) to shape payoff in Wave-3 late innings and Wave-4 digestion.
________________________________________
🧪 Reality Check: What Could Invalidate the Bull?
• Real yields + USD rip higher (sustained) → compress gold’s opportunity cost.
• Official-sector buying stalls (policy or FX-reserve shifts) → removes the anchor bid.
• Growth re-acceleration + faster-than-expected disinflation → weaker safe-haven + fewer rate cuts.
• Technical break: a persistent move below ~$3,600–3,700 would question Wave-3 extension and pull forward Wave-4.
________________________________________
🧭 Quick Reference Tables
🧾 Summary: Historic vs Current
Feature | 1968–80 | 1999–2012 | 2016/18–2025
Total Gain | ~2,330% | ~650% | ~215–260%
Duration | 12 yrs | 13 yrs | 7–9 yrs (ongoing)
Correction | ~–45% | ~–30% | ~–20% (’22)
Main Buyer | Retail/Europe | Funds/EM | Central Banks
Pattern | Parabolic | Cyclical | Cup & Handle → Secular
🧩 “If-This-Then-That” Playbook
• If real yields fall & CB buying persists → Ride trend / add on consolidations.
• If USD + real yields jump → Trim beta, keep core hedge.
• If GSR stays >80 with silver momentum → Overweight silver sleeve for torque.
________________________________________
🔚 Key Takeaways Updated
• Twin pillars: relentless official-sector demand + 2024 structural breakout.
• Base case: Street ~$3.7–4.0k by mid-’26 with upside to $4.5–5.0k on accelerated private/ETF rotation.
• Roadmap: Extend Wave-3 → Wave-4 re-accumulation (~12 months) → Wave-5 to $5,000–$5,500, then $7,500–$8,000 by 2030–2032 under favorable macro/flow dynamics.
• Operating stance: keep core, add on dips/sideways phases, manage beta and drawdowns proactively.

XAUUSD remains stable at high levels, focus on what comes nextHey everyone, Erik here.
XAUUSD has been showing strong momentum lately. After a sharp decline, the market quickly recovered, rebounding powerfully from the lower boundary of the newly projected channel. What initially appeared as weakness was actually a calculated shakeout, trapping sellers before reversing upward with confidence.
This behavior is typical of strong bullish trends. It clears out weak positions, triggers stop losses, and restores balance before the next upward movement. At this stage, the market appears to be entering the early phase of a new bullish impulse.
There might be a short consolidation or a slight correction, but the momentum is clearly pointing toward the upper boundary of the channel. For XAUUSD, the bullish continuation scenario seems far more convincing.
My target is around 4,585, near the upper resistance zone of the projected channel. The overall market structure remains decisively bullish, and the emotional surge during the last drop may become the fuel that powers the next strong rally.

XAUUSD – Increased Selling Pressure After CPI DataHello traders,
With U.S. CPI rising sharply to 3.1% (compared to the forecast of 2.9%), inflation remains elevated, reinforcing the likelihood that the Fed will not cut interest rates anytime soon. With higher interest rates, the opportunity cost of holding gold (a non-yielding asset) increases, causing capital to flow into USD, which is a negative factor for gold.
On the H4 chart, XAUUSD is facing pressure at the 4.150 level, with a pullback pattern forming within a descending channel. After reaching this level, the price of gold is likely to continue its decline, with the next target being the 4.080 support area, and potentially heading toward 3.830 if the bearish momentum persists.
Additionally, while both the PMI for manufacturing and services have slightly decreased , reflecting a slowdown in the U.S. economy, the CPI remains the dominant factor , limiting the potential for gold's short-term price increase.

Gold Outlook after the Dip. What to expect NOW?The price correction has ended, and the price is now in a strong support zone according to Fibonacci levels. From this point onward, the price is expected to rise and retest its previous high.

gold usdHI GUYS,
GOLD usd is on the right shoulder , expect buys in london session to Take profit GRAND FINAL H4 HS

Gold weekly chart with both buy and sell entriesLast week both buy and sell levels hit for over 1000 pips each.
This will probably be my last chart for awhile as i dont think theres much intrest in this
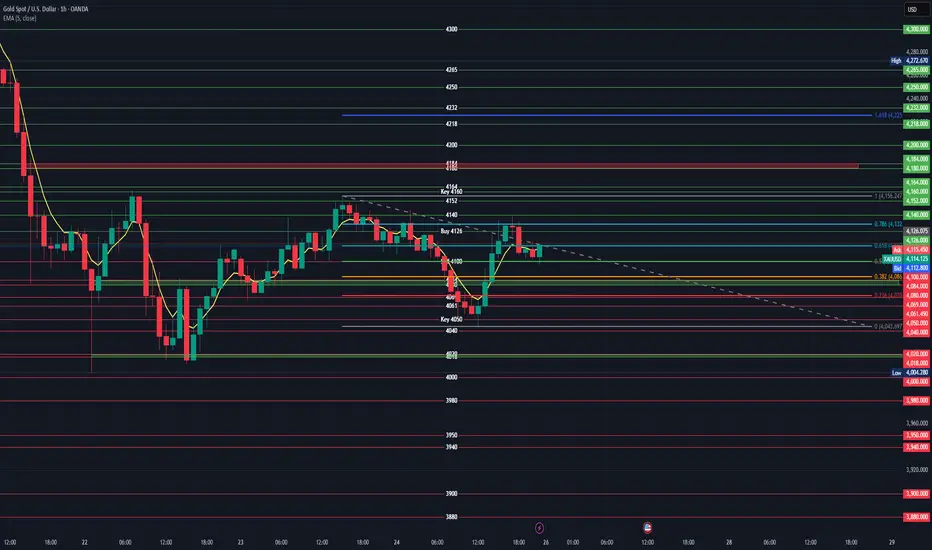
### XAUUSD 4-Hour Chart Analysis
#### **Key Levels Identified**
The chart shows critical **support/resistance zones** based on Fibonacci retracements, historical price action, and labeled key levels. Below is a breakdown of actionable buy/sell levels:
---
### **1. Buy Levels (Long Entry)**
These levels represent potential support where price may reverse upward:
- **Primary Buy Zone**: `4,126` (labeled "Buy 4126" on the chart)
- **Why?** This level aligns with the **0.236 Fibonacci retracement** of the recent swing high (4,164) to swing low (4,004). Historically, price has bounced here.
- **Entry Trigger**: Wait for bullish reversal signals (e.g., bullish engulfing candle, RSI divergence, or price closing above the 5-period EMA).
- **Stop Loss**: `4,095` (below the "Sell 4100" resistance level).
- **Take Profit**: Target `4,160` (Key 4160 resistance), then `4,180` and `4,184`.
- **Secondary Buy Zone**: `4,110–4,115` (near the 0.618 Fibonacci retracement at `4,113.253`)
- **Why?** The price is consolidating here after a dip. A hold above `4,100` (Sell 4100 level) suggests bullish momentum.
- **Stop Loss**: `4,095` (as above).
- **Take Profit**: Same as primary zone (`4,160` and beyond).
---
### **2. Sell Levels (Short Entry)**
These levels represent potential resistance where price may reverse downward:
- **Primary Sell Zone**: `4,132` (0.786 Fibonacci retracement of the swing high/low)
- **Why?** This level is a strong resistance zone where the price often reverses after a rally.
- **Entry Trigger**: Wait for bearish reversal signals (e.g., bearish pin bar, RSI divergence, or price rejecting the level).
- **Stop Loss**: `4,135` (above the resistance level).
- **Take Profit**: Target `4,099` (0.5 Fib), then `4,086` (0.382 Fib), and `4,050` (Key 4050 support).
- **Secondary Sell Zone**: `4,160` (labeled "Key 4160")
- **Why?** This is the **major swing high** (4,164) and a key psychological resistance level. A rejection here confirms a bearish trend.
- **Entry Trigger**: Price must break above `4,160` and then fail to hold (e.g., a bearish candlestick pattern at the level).
- **Stop Loss**: `4,165` (above the resistance level).
- **Take Profit**: Same as primary sell zone (`4,099` and below).
---
### **Critical Context**
- **Current Price**: `4,111.797` (EMA 5 close). This is **above support (`4,100`)** and **below resistance (`4,132`)**.
- **Trend**: Short-term downward momentum after the 4,164 high, but price is recovering from a low. Wait for confirmation of reversal.
- **Fibonacci Retracement**:
- `0.786` (4,132) and `0.618` (4,113) act as key resistance/support.
- `0.5` (4,099) and `0.382` (4,086) are stronger support levels.
- **Risk Management**:
- Always use a stop loss to limit downside risk.
- Target levels should align with the broader trend (e.g., if the trend is bearish, prioritize sell setups).
---
### **Summary of Actionable Levels**
| **Trade Type** | **Entry Level** | **Stop Loss** | **Take Profit** | **Confirmation Signal** |
|----------------|-----------------|---------------|-----------------|-------------------------|
| **Buy** | 4,126 (primary)4,110–4,115 (secondary) | 4,095 | 4,160 → 4,180 → 4,184 | Bullish reversal candle, RSI divergence |
| **Sell** | 4,132 (primary)4,160 (secondary) | 4,135 → 4,165 | 4,099 → 4,086 → 4,050 | Bearish reversal candle, RSI divergence |
> **Note**: Always validate entries with additional indicators (e.g., RSI, volume) and avoid trading during low-volume periods. The 4-hour timeframe favors medium-term trades (1–3 days), so patience is key.
GOLD WEEKLY CHART MID/LONG TERM ROUTE MAPHey everyone,
Please check out our updated Weekly Chart Route Map, featuring updated revised key levels after completion of our last long term weekly chart idea for precise level-to-level tracking.
We’ve refreshed our long-term structure on the weekly chart. Price action recently rejected the 4294 level and is now range-bound between 4284 (resistance) and 4059 (support). This consolidation aligns with a detachment from the EMA5, highlighted on the chart with a circle. Even if a full detachment doesn’t materialize, a partial (halfway) correction remains the more probable scenario.
To determine the next directional move, we’ll need a decisive test and break of either boundary level. On the broader horizon, 3006 stands as the long-range pivotal swing zone, which may come into play if a major correction unfolds.
🔹 Note: The key distinction between a retracement range and a swing range is that swing ranges typically produce larger bounces and wider price reactions compared to standard retracement ranges.
We’ll continue to update this outlook throughout the week as the structure develops. Thank you all for your likes, comments and follows, we really appreciate it!
Mr Gold
GoldViewFX

Gold Pullback: Technical Correction Keeps the Main Trend IntactHello everyone,
Gold is currently trading around 4,112 USD on the H4 chart after a fairly deep correction. Many traders seem concerned seeing strong selling pressure, but a closer look at price action reveals this is merely a technical pullback, not a signal of a long-term trend reversal.
After the parabolic surge, gold paused due to profit-taking. The dense Fair Value Gaps (FVG) in the 4,050–4,130 USD area indicate plenty of “unfinished business” — liquidity has not been fully tested, stop-losses not swept, supply and demand not fully balanced.
The 4,050 USD zone is key support, both technically and psychologically for buyers. Holding above this level preserves the H4 uptrend structure. Meanwhile, the 4,130 USD zone presents a short-term resistance — FVG combined with the Ichimoku cloud — and gold must decisively handle this region to continue higher.
From the news perspective, the market is caught between two forces: anticipation of Fed rate decisions and the upcoming US CPI, which could trigger volatility; versus easing US–China tensions, temporarily reducing safe-haven demand. The recent selling was mostly profit-taking after a 5.5% rally earlier this month; buyers haven’t exited, they are merely reorganising positions before returning.
My preferred scenario: gold retests 4,050–4,070 USD, sweeps remaining liquidity, and then bounces to test 4,130 USD. Only if 4,050 USD breaks with high volume would the market likely head toward 4,000 USD, where buyers will defend aggressively. If it holds, a recovery is expected and gold could target higher levels.
Do you see this as a normal pullback or a precursor to a sharp drop? Share your thoughts below.

Gold finally has a supply range! Time for bullish correction?I talked about everything but the obvious inverse head and shoulders/Quasimodo forming the right shoulder now. If everything goes right can we expect an arm to extend upwards here during the stochastic buy cycle?
Let me know what you think and be sure to share and care for others if you found this helpful.
Also talked about the "REAPER WARNING" as we have a reaper inversion range actively terrorizing price 🧩

How Smart Money Moves Gold (XAUUSD)🟡 Gold never moves randomly — it moves with intention.
Every spike, every fake breakout, every sharp reversal… it’s all part of a bigger plan by smart money (institutions) to trap emotional traders and collect liquidity.
Let’s break it down 👇
⚡ 1️⃣ Liquidity Grab (The Trap Phase)
Before any real move, gold sweeps stop-losses above highs or below lows.
Retail traders think it’s a breakout — but it’s actually a liquidity hunt.
Smart money fills large positions here while emotions run high.
⚡ 2️⃣ Market Structure Shift (The Clue)
After collecting liquidity, watch for a BOS (Break of Structure) or CHoCH (Change of Character) — these reveal when the real move is starting.
⚡ 3️⃣ Smart Money Entry (The Real Move)
Once the trap is set, gold often makes a strong impulsive push.
This is where institutions enter — and where smart traders follow with confirmation, not emotion.
⚡ 4️⃣ Emotional Traders Lose, Logical Traders Win
The market doesn’t hate you — it simply feeds on emotional reactions.
Be patient, wait for liquidity sweep ➜ structure shift ➜ confirmation entry.
🧭 Pro Tip:
👉 Stop chasing candles.
👉 Study liquidity and market structure.
👉 Let the chart show who’s trapped — and then trade against them.
💬 Remember:
“The market rewards patience, not panic.”
💎 Gold (XAUUSD) moves on liquidity — not luck.
#TradeSmart #ThinkLikeInstitutions #XAUUSD

Gold ready for another spike 4380Gold (XAU/USD) is holding above the support trend line, showing potential for a bullish rebound. As long as price stays above the 4,220 support area, it may target the next resistance near 4,380.

#XAUUSD: Massive Drop Is In Making! Bears In ControlDear all,
We are seeing significantly increased bearish volume since yesterday now we think price is likely to remain bearish for couple of days or week so price could make major correction. Please wait for price to settle down.
Good Luck
Team Setupsfx_
