XAU/USD | GOLD Breaking Records – $4K Target Loading…!By analyzing the TVC:GOLD chart on the 1-hour timeframe, we can see that nothing seems to be stopping its series of new record highs — it almost feels like the $4,000 target isn’t too far away! Every small correction in gold is simply gathering more liquidity and demand to push toward higher levels.
At this very moment, gold has printed a new ATH at $ 3,734 , and I expect the rally to continue. The next possible upside targets are $3,740, $3,780, and $3,800.
THE MAIN ANALYSIS :
Please support me with your likes and comments to motivate me to share more analysis with you and share your opinion about the possible trend of this chart with me !
Best Regards , Arman Shaban
GOLD trade ideas

XAUUSDHello Traders! 👋
What are your thoughts on GOLD?
Gold, after its strong recent rally, is now facing the key resistance area around 3700.
Possible Scenarios:
1️⃣ Scenario One (More Likely):
Given that the market is in an overbought zone, a corrective/ranging move toward the lower boundary of the drawn channel and the marked support area is likely. From there, a new bullish wave could begin, eventually leading to a breakout above resistance and a move toward higher targets.
2️⃣ Scenario Two:
Gold makes only a shallow correction, quickly breaks above the resistance zone, and continues its bullish momentum toward higher levels.
Due to the current overbought conditions, Scenario One (correction before continuation) is more probable. However, the overall trend remains bullish as long as key support levels hold.
Don’t forget to like and share your thoughts in the comments! ❤️

Lingrid | GOLD Weekly Analysis: Sideways Shuffle Before Next RunOANDA:XAUUSD attempted an upward break this week but encountered resistance near the $3,700 level, retreating as the market enters a consolidation phase. 4H chart reveals gold trading within an ascending channel, testing the upper resistance zone around $3,700 after a significant rally from the August bottom.
Price action suggests a healthy pullback within the broader uptrend. The upward trendline remains intact, providing dynamic support around $3,630, while the PWL (Previous Week Low) acts as immediate support. This sideways action appears to be profit-taking rather than a trend reversal, as gold consolidates recent gains before potentially targeting the ATH zone again.
Key factors supporting long-term bullish sentiment include persistent geopolitical tensions, central bank gold accumulation, and currency debasement concerns. The ascending channel structure suggests any weakness toward the PWL support zone could present attractive entry opportunities for patient buyers.
An expansion - contraction market phase aligns with typical consolidation patterns following sharp advances. Gold's ability to hold above the trendline will be crucial. A break below would signal deeper correction toward the channel midpoint, while a decisive move above current resistance opens the path to new highs towards $3,800. The overall structure remains constructive for gold's longer-term trajectory despite near-term choppiness.
If this idea resonates with you or you have your own opinion, traders, hit the comments. I’m excited to read your thoughts!

Lingrid | GOLD Rally Targeting $3800 Resistance Level ?The price perfectly fulfilled my previous idea . OANDA:XAUUSD is pressing higher after breaking out of its consolidation channel and reclaiming the 3750 level. The market structure is supported by an upward trendline with successive higher highs confirming bullish momentum. As long as price holds above 3728, a push toward the 3800 resistance zone remains likely. The broader trend continues to favor buyers with gold eyeing new all-time highs.
⚠️ Risks:
A drop back below 3728 would weaken the breakout and open the way for a retest of 3700 support.
Stronger USD from Fed Chair Powell comments could cap upside momentum.
Profit-taking near the 3800 psychological level may trigger short-term volatility.
If this idea resonates with you or you have your own opinion, traders, hit the comments. I’m excited to read your thoughts!

GOLD → The rally continues. We are waiting for a pullback to buyFX:XAUUSD is rallying since the opening of the trading session. The movement has been continuing since Friday, after the end of the correction. The market is realizing the potential for interest rate cuts...
The metal is showing gains for the fifth week in a row, despite the local recovery of the dollar.
Key supporting factors: The forecast of two rate cuts before the end of the year continues to fuel interest. Tensions in US trade relations with India and other sources of instability. Upcoming PCE data on Friday may confirm the need for a soft policy. BUT! Caution is needed, as a short-term correction (profit-taking) is possible after record growth.
Resistance levels: 3730, 3740, 3750
Support levels: 3703, 3685, 3674
The price is in the ATH zone, having come a long way since the opening of the session, and a correction may form. It is dangerous to sell in the current zone, and for trading within the bullish trend, it is worth waiting for a pullback to the nearest local support levels...
Best regards, R. Linda!

GOLD → Retest of resistance at 3660. What could happen?FX:XAUUSD is testing resistance to correction after breaking the local market structure from bearish to bullish. A breakout of 3660 could give buyers a chance...
A 25 bp rate cut to 4.25% was expected, but the forecast for further cuts came as a surprise: now two cuts before the end of 2025 (instead of one) and one in 2026.
The reason for the shift: fears of a slowdown in the labor market outweighed the risks from inflation (2.9% in August).
The dollar continues its countertrend correction (rebound) after Powell's speech and economic news. This temporary phenomenon may soon end. Gold, after a manipulative phase, may return to an upward movement if the price breaks 3660 and consolidates above this level.
The Fed preferred to support employment, risking accelerating inflation. In the long term, this will support risk assets and commodities, but in the short term, the markets have taken a pause.
Resistance levels: 3360, 3675, 3688
Support levels: 3643, 3631
Gold is not updating local lows, a cascade bottom is forming and the local bearish structure is breaking down. If the market manages to overcome the resistance of the correction, a bullish impulse may form!
Best regards, R. Linda!

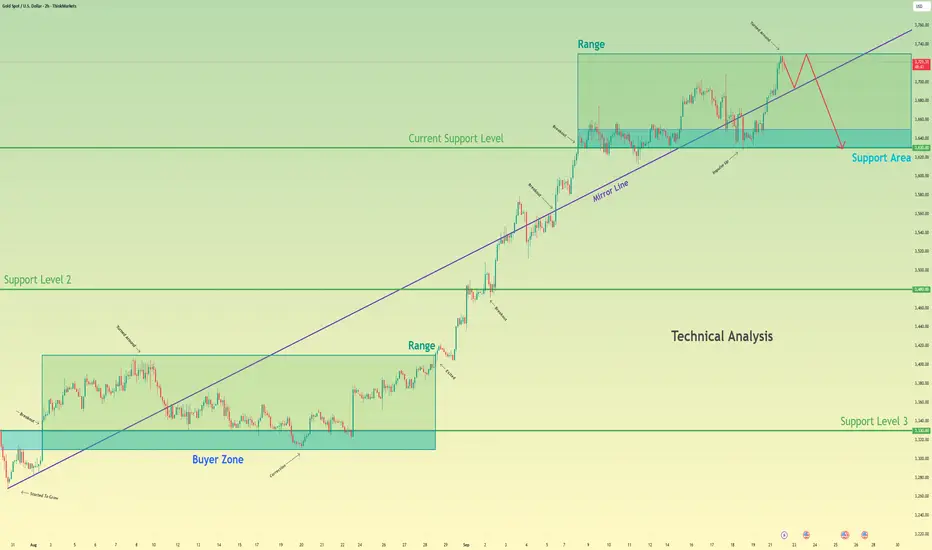
Gold can Complete its Topping Pattern and FallHello traders, I want share with you my opinion about Gold. The market has been developing a complex consolidation structure after its initial uptrend failed to sustain momentum. After breaking out of a first range, the bullish impulse failed, leading to a breakdown below the major ascending mirror line and establishing the current, higher second range. The price action for XAU has since been contained within this new consolidation, repeatedly testing the upper resistance and lower support boundaries. Currently, the asset is again testing the upper boundary of this range, an area that has consistently attracted sellers. In my mind, this price action is forming a complex topping pattern. I expect that the price will be rejected from the top of the current range, perhaps after a brief interaction with the nearby mirror line, and then fail at the highs one more time. I think this final failure will trigger a significant decline with enough momentum to break the mirror line support decisively. Therefore, I have placed my TP at the 3630 current support level, targeting the bottom of this second range. Please share this idea with your friends and click Boost 🚀
Disclaimer: As part of ThinkMarkets’ Influencer Program, I am sponsored to share and publish their charts in my analysis.
THE KOG REPORTTHE KOG REPORT
In last week’s KOG Report we would like to see the red box defence hold the price, and if it did we felt an opportunity to long would be available to traders into the red box target levels.
Price did exactly what we wanted and all the red box target levels for the week were completed as well as the Excalibur targets we had in Camelot.
We then released the FOMC KOG Report and shared not only the red boxes but also the hot spots that were active. This suggested a move upside from lower support and then a decline from there into the 3630-40 regions which again worked to the pip and gave us another opportunity not only to short but then to long up to where we closed.
A fantastic week in Camelot with price playing just the way we wanted it to on gold.
So, what can we expect in the week ahead?
For this week we have the key level of 3660-55 support which needs to break for us to go lower in the first half of the week. Above and if that level is supported we see opportunities for the 3710, 3720 and potentially the 3730 regions. Its that 3720-30 level that we want to monitor this week and if attacked, it’s there we feel we may see an opportunity to short the market back into the 3685, 3660 and 3650 level initially.
We’re due a retracement on the bullish move and ideally, we want to see that move this week at some point.
We’re a little to high to go long here in the early sessions, especially with the 3660 level sticking out for a potential swing. So we’ll try and plot the path best we can and keep an eye on the hot spots and the red boxes as well as our trusted friend Excalibur to guide us through the week.
Key levels – 3690 - 3675
RED BOX TARGETS:
Break above 3690 for 3710, 3714 and 3722 in extension of the move
Break below 3670 for 3665, 3655, 3650 and 3643 in extension of the move
We’re going to keep it short this week and as usual, we’ll update traders through the week.
Please do support us by hitting the like button, leaving a comment, and giving us a follow. We’ve been doing this for a long time now providing traders with in-depth free analysis on Gold, so your likes and comments are very much appreciated.
As always, trade safe.
KOG

"XAUUSD Bullish Setup Toward 3800–3810"This chart shows the XAU/USD (Gold vs US Dollar) 1-hour analysis.
Price is currently trading around 3769 after a bullish move.
A support trend line is holding price momentum, suggesting buyers are still active above this level.
Immediate support is seen near 3753, while the trendline also aligns with this support zone.
If price respects the support trend line, a bullish continuation is expected.
The upside targets are marked at 3800 as the next key level, and 3810 as a potential new all-time high (ATH).
The projection indicates a possible short-term pullback to the trend line before resuming upward movement.
Overall, the setup suggests a bullish outlook, as long as price stays above the support and trend line.

Lingrid | GOLD Potential Pullback from 3700 Psychological LevelOANDA:XAUUSD faced rejection at the 3,700 resistance zone, signaling exhaustion in the recent bullish leg. The divergence at the highs supports a potential reversal, with price already slipping back toward the mid-range of the upward channel. If momentum continues lower, a breakdown under 3,635 could open the way toward 3,570 as the next key support. Sellers remain favored while price trades below 3,700, keeping the bias tilted downward.
⚠️ Risks:
A sudden risk-off move or geopolitical tension could revive safe-haven demand for gold.
Any dovish Fed shift or weaker US data may fuel a breakout above 3,700 instead.
Strong ETF inflows or central bank demand could limit downside pressure.
If this idea resonates with you or you have your own opinion, traders, hit the comments. I’m excited to read your thoughts!

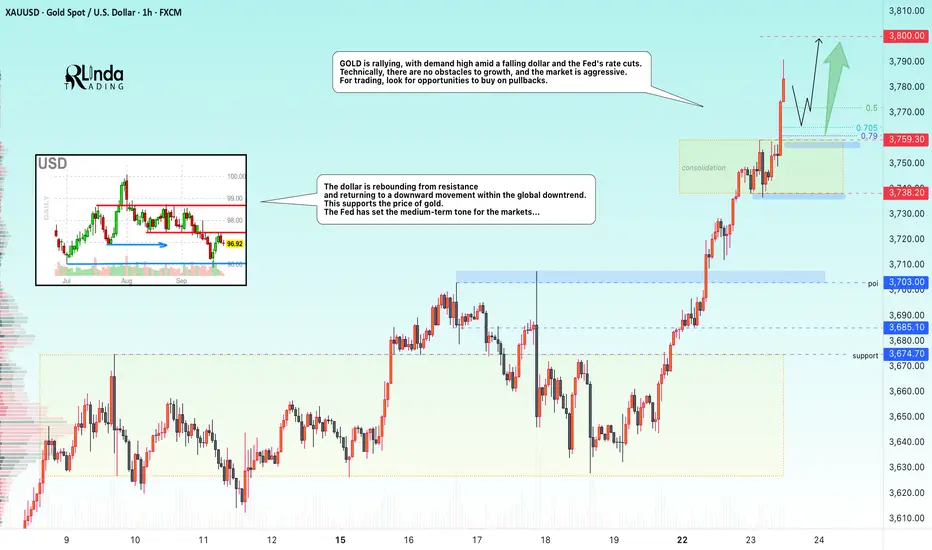
GOLD → Aggressive growth is not over. Powell's speech...FX:XAUUSD is rallying, with demand high amid a falling dollar and the Fed's rate cuts. Technically, there are no obstacles to growth, and the market is aggressive. For trading, look for buying opportunities on pullbacks.
Gold is rallying and hitting new highs as people realize what's going on (interest rates are falling). Powell's speech is coming up, and it may trigger a correction (profit-taking) amid growing risks.
Key factors: Powell's speech today, at which time the market is waiting for hints of further easing of Fed policy.
PMI data (US), weak figures will support the possibility of further rate cuts...
Demand for metal is supported by geopolitical tensions in the Middle East and Eastern Europe.
Resistance levels: 3800
Support levels: 3760
Many factors are supporting the rise in gold, and there are no compelling reasons to sell gold now. The ideal trading strategy is to wait for a pullback and retest of support levels with the formation of strong reversal points for buying.
Sincerely, R. Linda!
GOLD 1H CHART ROUTE MAP UPDATE & TRADING PLAN FOR THE WEEKHey Everyone,
Please see our updated 1h chart levels and targets for the coming week.
We are seeing price play between two weighted levels with a gap above at 3692 and a gap below at 3673. We will need to see ema5 cross and lock on either weighted level to determine the next range.
We will see levels tested side by side until one of the weighted levels break and lock to confirm direction for the next range.
We will keep the above in mind when taking buys from dips. Our updated levels and weighted levels will allow us to track the movement down and then catch bounces up.
We will continue to buy dips using our support levels taking 20 to 40 pips. As stated before each of our level structures give 20 to 40 pip bounces, which is enough for a nice entry and exit. If you back test the levels we shared every week for the past 24 months, you can see how effectively they were used to trade with or against short/mid term swings and trends.
The swing range give bigger bounces then our weighted levels that's the difference between weighted levels and swing ranges.
BULLISH TARGET
3692
EMA5 CROSS AND LOCK ABOVE 3692 WILL OPEN THE FOLLOWING BULLISH TARGETS
3717
EMA5 CROSS AND LOCK ABOVE 3717 WILL OPEN THE FOLLOWING BULLISH TARGET
3742
EMA5 CROSS AND LOCK ABOVE 3742 WILL OPEN THE FOLLOWING BULLISH TARGET
3768
BEARISH TARGETS
3673
EMA5 CROSS AND LOCK BELOW 3673 WILL OPEN THE FOLLOWING BEARISH TARGET
3650
EMA5 CROSS AND LOCK BELOW 3650 WILL OPEN THE SWING RANGE
3622
3592
EMA5 CROSS AND LOCK BELOW 3592 WILL OPEN THESECONDARY SWING RANGE
3556
3528
As always, we will keep you all updated with regular updates throughout the week and how we manage the active ideas and setups. Thank you all for your likes, comments and follows, we really appreciate it!
Mr Gold
GoldViewFX

Gold Bull Markets Long Term Overview and 2025 Market UpdateGold Bull Markets Long Term Overview and 2025 Market Update
________________________________________
• This cycle is different: record central-bank buying + renewed ETF inflows + lower real rates = powerful tailwind.
• Price: Gold notched fresh ATHs this month (up to $3,790.82). 2025 is shaping up as the strongest year since the late 1970s.
• Relative: Gold is crushing equities YTD (≈+40% vs S&P 500 ≈+13% total return).
• Setup: A 13-year “cup-and-handle” breakout in 2024 kick-started the move.
• Outlook: Base case from the Street: $3,700 by end-’25 and ~$4,000 by mid-’26; upside to $4,500 if flows accelerate.
________________________________________
🏆 Historic Gold Bull Markets — Timeline & Stats
1) 1968–1980 “Super Bull”
• Start/End: ~$35 → $850 (Jan 1980)
• Gain: ~2,330%
• Drivers: End of Bretton Woods, oil shocks, double-digit inflation, geopolitical stress.
• Drawdown: ~–45% (1974–1976) before the final blow-off run.
2) 1999–2011/12
• Start/Peak: ~$252 (1999) → ~$1,920 (2011–12)
• Gain: ~650%
• Drivers: Commodities supercycle, EM demand, USD weakness, GFC safe-haven bid.
3) 2016/2018–Present (The “CB-Led” Cycle)
• Start Zone: $1,050–$1,200 → New ATH $3,790 (Sep 2025)
• Gain: ~215–260% (depending on 2016 vs 2018 anchor)
• Drivers: Record central-bank accumulation, sticky inflation/low real rates, geopolitics; 2024 13-yr base breakout.
________________________________________
📊 At-A-Glance Comparison (Updated 2025)
Metric 1968–80 Super Bull 1999–2012 2016/18–2025 Current
🚀 Total Gain ~2,330% ~650% ~215–260% (so far)
⏲️ Duration 12 yrs 13 yrs 7–9 yrs (ongoing)
💔 Max Drawdown ~–45% (’74–’76) ~–30% (’08) ~–20% (2022)
🏦 Main Buyer Retail/Europe Funds/EM Central Banks (dominant)
🏛️ Pattern Secular parabolic Cyclical ramps 13-yr base → breakout (’24)
Notes: current cycle characteristics validated by WGC demand trends & technical breakout in Mar 2024.
________________________________________
📈 Top 10 Stats of the Current Bull (2025)
1. Price & ATHs: Spot $3,75–$3,79k; fresh ATH $3,790.82 on Sep 23, 2025.
2. 2025 YTD: Roughly +40–43% YTD (best since the late ’70s).
3. Central Banks: 1,045 t added in 2024 (3rd straight 1k+ year). H1’25 ≈ 415 t (still elevated).
4. ETF Flows: Strongest half-year inflows since 2020, aiding the surge.
5. Gold vs Equities: Gold ≈+40% vs S&P 500 ≈+13% total return YTD.
6. Jewelry Demand: Price strength is crimping tonnage (2024 down ~11%; Q2’25 –14% y/y), even as value hits records.
7. Gold–Silver Ratio: Now around ~85–88 (silver catching up as it pushes $43–$44).
8. Macro Link: Strong safe-haven bid + rate-cut hopes supporting new highs.
9. Technical: Confirmed cup-and-handle breakout (Mar ’24) underpinning trend.
10. Street Forecasts: DB lifts 2026 to $4,000; GS baseline $4,000 by mid-’26, upside $4,500 with bigger private-investor rotation.
________________________________________
🔄 What Makes This Bull Different (2025 Edition)
• 🏦 Central-Bank Dominance — Official sector is the anchor buyer (3rd straight 1k+ tonne year in 2024; 2025 tracking strong despite Q2 deceleration).
• ⚡ Faster Recoveries — Pullbacks have been shallower and shorter vs the 1970s analog.
• 📈 Coexisting With Risk Assets — Rare combo: gold ATHs with equities up YTD suggests a macro hedge bid alongside optimism in select risk assets.
• 📐 Structural Breakout — The 13-year base cleared in 2024 set multi-year targets.
________________________________________
🎯 Strategy Ideas (2025 & Beyond)
Core
• Buy/Hold on Dips: Stagger entries (DCA) into physical (allocated), ETFs (e.g., GLD/IAU), and quality miners/royalties.
• Prefer Physical/Allocated where counterparty risk matters; use ETFs for liquidity.
Satellite/Leverage
• Silver & GSR Mean-Reversion: With the GSR ~85–88, silver historically offers torque in up-legs. Pair with high-quality silver miners.
• Factor Tilt in Miners: Focus on low AISC, strong balance sheets, growing reserves, and jurisdictions with rule-of-law.
Risk-Management
• Define max drawdown tolerance per sleeve; pre-plan trims near parabolic extensions or if macro invalidates (e.g., real-yield spike).
________________________________________
🧪 Reality Check: What Could Invalidate the Bull?
• Real yields + USD rip higher (sustained), dampening non-yielding assets.
• Sharp halt in official-sector buying (e.g., policy shifts).
• Rapid growth re-acceleration reducing safe-haven & rate-cut expectations.
________________________________________
🧭 Quick Reference Tables
🧾 Summary: Historic vs Current
Feature 1968–80 1999–2012 2016/18–2025
Total Gain ~2,330% ~650% ~215–260%
Duration 12 yrs 13 yrs 7–9 yrs (ongoing)
Correction ~–45% ~–30% ~–20% (’22)
Main Buyer Retail/Europe Funds/EM Central Banks
Pattern Parabolic Cyclical Cup & Handle → Secular
🧩 “If-This-Then-That” Playbook
• If real yields fall & CB buying persists → Ride trend / add on consolidations.
• If USD + real yields jump → Trim beta, keep core hedge.
• If GSR stays >80 with silver momentum → Overweight silver sleeve for torque.
________________________________________
🧠 Outside-the-Box Adds
💼 Role in a Portfolio (example frameworks)
• Resilience sleeve (5–10%): Physical + broad ETF.
• Offense sleeve (2–5%): Quality miners/royalties; optional silver tilt.
• Tactical (0–3%): Trend-following overlay (breakouts/consolidations).
🧭 Decision Checkpoints (quarterly)
• Central-bank net purchases (WGC).
• ETF flows (Western markets).
• Real yields (10y TIPS), USD trend, and GSR.
________________________________________
🔚 Key Takeaways (Updated)
• Relentless official-sector demand + technical breakout are the twin pillars of this cycle.
• Macro mix (policy easing expectations, geopolitics, diversification from USD reserves) supports an extended run.
• Base case: Street sees $3.7k by end-’25 and ~$4k by mid-’26, with upside to $4.5k if private capital rotation accelerates. Manage risk; embrace volatility.

GOLD → Breakthrough of correction resistance. Uptrend FX:XAUUSD entered a correction phase after the Fed meeting and interest rate cut, but by the end of the week, the market managed to recover from the decline and return to the zone of interest, breaking through the resistance of the downtrend...
The dollar is correcting after the Fed meeting on interest rates. The index is testing resistance at 97.5-98.0, and a false breakout of this zone could trigger a fall in the index, which in turn would only support the forex and gold markets...
At this time, the metal is reducing its correlation with the DXY and breaking the resistance of the downward correction, which is provoking an impulse to 3685. Technically, Friday's trading session is closing quite positively, which generally indicates a high level of demand.
I would highlight several key levels: the previously broken resistance at 3674 (below this zone there is a hidden liquidity pool) and resistance at 3685 (trigger). A retest of the lower level is possible before the price continues its growth. The target within the current movement can be considered 3700 - 3710.
Support levels: 3674, 3668, 3660
Resistance levels: 3685, 3703, 3710
If, during the Asian/Pacific session, gold consolidates without a pullback and closes above 3685, the market may continue to rise towards the specified target. However, if the market lacks potential (after the weekend), then MM may test 3674 - 3668 before the price returns to growth towards the target of 3700.
Best regards, R. Linda!

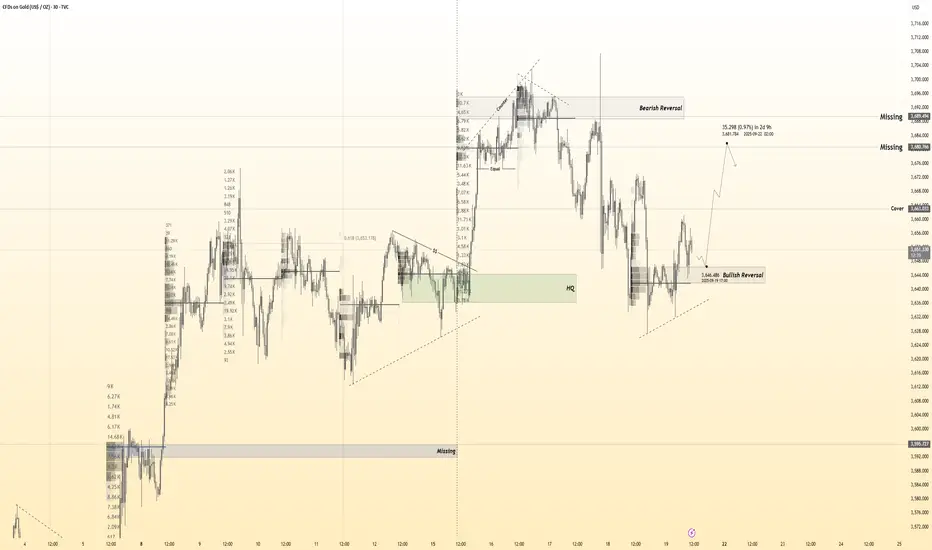
Gold 30Min Engaged ( Bullish Reversal Entry Detected )Time Frame: 30-Minute Warfare
Entry Protocol: Only after volume-verified breakout
🩸Bullish Movement from - 3647
➗ Hanzo Protocol: Volume-Tiered Entry Authority
➕ Zone Activated: Dynamic market pressure detected.
The level isn’t just price — it’s a memory of where they moved size.
Volume is rising beneath the surface — not noise, but preparation.
🔥 Tactical Note:
We wait for the energy signature — when volume betrays intention.
The trap gets set. The weak follow. We execute.
XAUUSD Breakout and Bullish Momentum👋Hello everyone, what do you think about OANDA:XAUUSD ?
Gold has just completed a Rounding Bottom pattern and successfully broken out of the resistance zone around 3,700 USD, turning it into a new support. Strong bullish momentum has emerged, and I expect the next push to target the 3,740 – 3,750 USD area. Short-term pullbacks are likely to serve only as stepping stones for buyers to strengthen their position and drive prices higher.
Do you agree with this outlook?💬 Share your thoughts below!
Wishing you successful trades!

GOLD → Rates have been cut. Will growth continue?FX:XAUUSD , following the Fed's decision on interest rates, caused a shock, updating the ATH to 3707, then updating the minimum to 3633. Since the opening of the European session, the market has been recovering, but there is a BUT...
The Fed's Dot Plot confirmed the forecast of two additional rate cuts before the end of the year, which provides long-term support for gold.
The USD remains under pressure after the Fed's decision, despite a short-term rebound. Trump's statements and the escalation of conflicts continue to fuel demand for safe havens.
After rising to a record high of $3707, a short-term correction is possible. If today's jobless claims come in better than expected, it will temporarily strengthen the USD. As for Powell, his emphasis on “meeting-to-meeting decisions” may limit appetite for risky assets.
Resistance levels: 3674.7, 3688.6
Support levels: 3654.5, 3633, 3626.8
Technically, since the opening of the European session, gold has spent its intraday ATR reserve. From the specified resistance level of 3675 (psychological level), a correction to 3660-3655 may form before continuing to grow to 3675-3688.
Best regards, R. Linda!

The Gold Price Is At A Crossroads, Caught In A Tug-Of-War.👋Hello everyone, let’s take a look at OANDA:XAUUSD !
Today, gold is struggling around the support level of 3635 USD. This is a hot point between the bulls and bears, with both sides looking for an opportunity to take control. Let’s check it out!
From a macro perspective, gold has recently shown a slight decline due to profit-taking after the Fed’s first rate cut, which met expectations last Wednesday. The market wasn’t surprised by this move, and gold had already reacted with a rise before shifting to profit-taking.
Most recently, gold experienced another decline yesterday, driven by news about US unemployment claims. The actual number came in at 231K, lower than the forecast of 241K and the previous 264K. This reflects a stronger labor market = stronger USD, putting pressure on gold.
From a technical standpoint: In the short term, as mentioned, gold is operating at support levels. Personally, I believe the bears still have the upper hand since there is no major news today. If the support zone is broken, it will open up significant opportunities for the bears.
What do you think? Will this support level hold, or will it break?

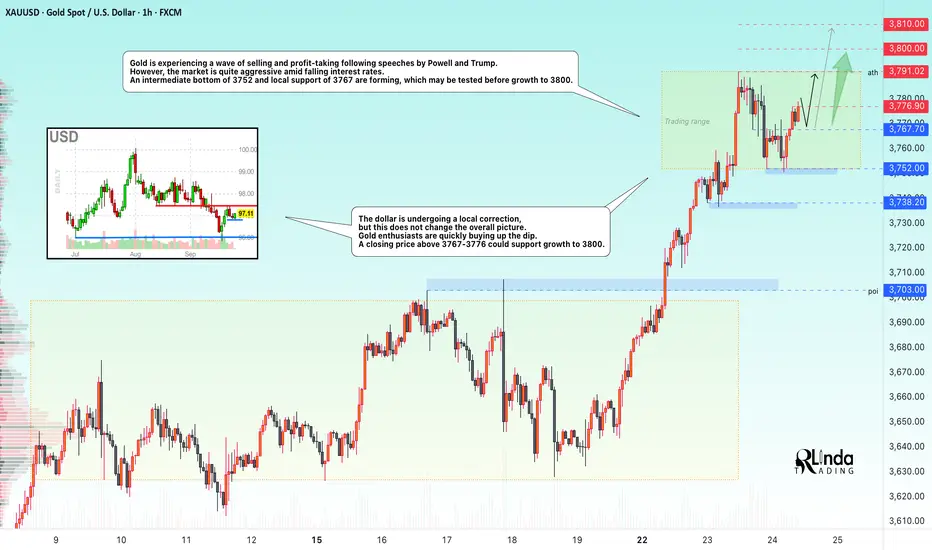
GOLD → Intermediate bottom. Consolidation before growth FX:XAUUSD is being sold off and declining amid profit-taking following speeches by Powell and Trump. However, the market is quite aggressive amid falling interest rates. After forming an interim bottom, the market quickly bought back the decline.
Gold is correcting after record growth, awaiting new signals from Fed representatives and PCE inflation data on Friday. The price remains close to historic highs, but the upward momentum has temporarily slowed, with consolidation forming at 3752-3791.
Key factors : Powell gave no clear hints about future rate cuts, noting the risks of rising inflation and a weakening labor market. The probability of a rate cut in October has risen to 92%, but the Fed's sentiment index is fluctuating somewhat...
The risk of a US government shutdown on October 1 and mixed PMI data are holding back the USD's strengthening.
Technically, gold remains in a bullish trend, but consolidation is possible in the short term. PCE data will be the deciding factor — weak figures will support the metal, while strong figures will trigger a correction.
Resistance levels: 3776.9, 3791, 3800
Support levels: 3767, 3752, 3738
The price is consolidating. Before reaching 3791-3800, there may be a retest of local support. Similarly, a retest of the ATH may also trigger a small pullback of 1/2 of the impulse before a breakout and growth to the specified targets.
Best regards, R. Linda!
Hellena | GOLD (4H): LONG to support area of 3800.Dear colleagues, the last forecast is canceled, but I recommended that trades should be set trades to breakeven because there is a high probability of wave “3” extension.
It looks like the upward impulse is still not over and I expect the final formation of wave “5” to the 3800 area. Yes - this target is quite close, but now it makes no sense to make a long forecast with a correction in wave “2” of higher order (red).
As soon as I get confirmation that the correction in wave “2” has started - I will make a forecast with more points.
Manage your capital correctly and competently! Only enter trades based on reliable patterns!

XAUUSD Hits New Highs 👋Hello everyone, what do you think about OANDA:XAUUSD ?
Yesterday, gold recorded a strong rally, surging to 3759 USD, an impressive gain of over 65 USD compared to the previous session, reaching our expected target.
In the new trading session, gold has reached a new record high, driven by growing expectations of further Fed rate cuts and increasing demand for safe-haven assets amid political instability.
Safe-haven flows are also being reinforced by prolonged geopolitical risks, including the Russia-Ukraine conflict, concerns over the economic impact of U.S. President Donald Trump’s tariffs, and strong gold purchases by central banks.
From a technical perspective, gold remains well above both the EMA 34 and EMA 89. Although the sharp increase has prompted some investors to take profits, I personally believe the uptrend is not over, as gold continues to be the top choice for preserving wealth. My target is 3800 USD in the near future.
And you, what do you think about the trend of XAUUSD?

GOLD 1H CHART ROUTE MAP UPDATEHey Everyone,
A Piptastic start to the week with our chart idea playing out exactly how we analysed.
We started today with our Bullish target 3692 HIT, followed with ema5 cross and lock opening 3717. This was also hit perfectly with a further cross and lock above 3717 also opening 3742. This target remains open.
We will need a test and cross and lock above this level for a continuation or failure to lock will see rejection Into lower Goldturns for support and bounce inline with our plans to buy dips
We will keep the above in mind when taking buys from dips. Our updated levels and weighted levels will allow us to track the movement down and then catch bounces up.
We will continue to buy dips using our support levels taking 20 to 40 pips. As stated before each of our level structures give 20 to 40 pip bounces, which is enough for a nice entry and exit. If you back test the levels we shared every week for the past 24 months, you can see how effectively they were used to trade with or against short/mid term swings and trends.
The swing range give bigger bounces then our weighted levels that's the difference between weighted levels and swing ranges.
BULLISH TARGET
3692 - DONE
EMA5 CROSS AND LOCK ABOVE 3692 WILL OPEN THE FOLLOWING BULLISH TARGETS
3717 - DONE
EMA5 CROSS AND LOCK ABOVE 3717 WILL OPEN THE FOLLOWING BULLISH TARGET
3742
EMA5 CROSS AND LOCK ABOVE 3742 WILL OPEN THE FOLLOWING BULLISH TARGET
3768
BEARISH TARGETS
3673
EMA5 CROSS AND LOCK BELOW 3673 WILL OPEN THE FOLLOWING BEARISH TARGET
3650
EMA5 CROSS AND LOCK BELOW 3650 WILL OPEN THE SWING RANGE
3622
3592
EMA5 CROSS AND LOCK BELOW 3592 WILL OPEN THESECONDARY SWING RANGE
3556
3528
As always, we will keep you all updated with regular updates throughout the week and how we manage the active ideas and setups. Thank you all for your likes, comments and follows, we really appreciate it!
Mr Gold
GoldViewFX

Turn Losses into Wins with This Secret Formula!👋Hello traders!
Have you ever looked at a chart, placed a trade, and wondered, “Exactly how much will I make (or lose) if the price moves?”
Don’t worry — today I’m going to share with you a simple, easy-to-understand formula. This formula is short, easy to remember, and applies to any currency pair.
🔑 First: The Profit Calculation Formula
👉 Pip x Lot x 10 = Profit (USD)
Pip: The number of pips the price moves.
Lot: The size of your trade (0.1, 0.5, 1.0, etc.).
10: A fixed value in USD for standard currency pairs.
This small equation will immediately tell you how much you will gain or lose.
💡 Example
Let’s say you buy EUR/USD with a 1 lot position.
The price moves 50 pips in your favor.
Using the formula: 50 (pips) x 1 (lot) x 10 = Profit of $500 .
Another example: You trade 0.5 lot on XAU/USD, and the price moves 30 pips.
30 x 0.5 x 10 = Profit of $150.
See how simple that is?
------------------------------------
From the formula Pip x Lot x 10 = Profit, we can “reverse” it to calculate the appropriate Lot size based on your capital and acceptable risk level. This is the standard money management approach that professional traders always apply.
🔑 Lot Size Calculation Formula
👉 Lot = (Capital x % Risk Allowed) / (Stop Loss Pips x 10)
Capital: Your current account balance (e.g., $1,000).
% Risk: Typically 1-2% of the account per trade.
Stop Loss Pips : The distance from entry to the stop-loss point.
10: A fixed value (pip value for 1 standard lot).
💡 Illustrative Example
Capital: $1,000
Risk: 2% = $20
Stop Loss: 50 pips
Using the formula:
Lot = (1,000 x 0.02) / (50 x 10)
--> Lot = 0.04
👉 So, you should enter with a 0.04 lot size
Remember: Trading isn’t about luck, it’s about capital management and discipline. By applying these two formulas, you’ll see a big difference in your trading results.
So, next time you trade, remember this magical formula:
✅ Pip x Lot x 10 = Profit
✅ Lot = (Capital x % Risk Allowed) / (Stop Loss Pips x 10)
Have you memorized it? Hit like if you’ve remembered everything and are looking forward to more useful posts from me🚀!
Good luck!
