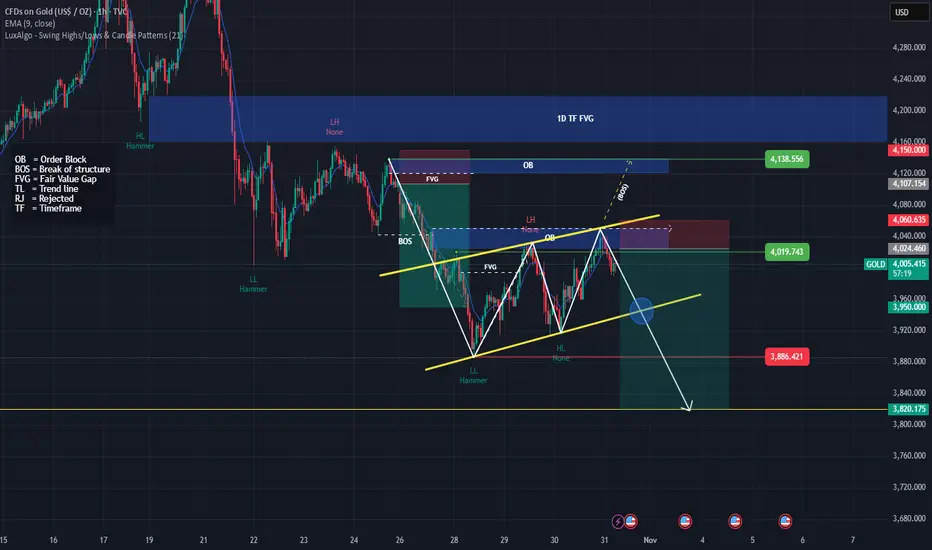
GOLD 30MIN NEWYORK PERSPECTIVE BACKUP CHART.LONDON /NEWYORK GOLD MARKET SESSION SHOWING ME SOME STRONG BULLISH DISPOSITION but the bullish confirmation hinges on break and close 4030 line chart close of my 4hr candle chart my preferred intraday time frame for deep analysis and trade directional bias in real time
if they break 4030, i will watch 15 min chart of the 4070-4055 zone for possible sell reaction price action, like I did in the yesterday sniper buy at 3885-3890 for reference which was posted for free.
the 4HR structure is my litmus test and guide in bullish continuation or bearish take profit.
if 4030 on timing 12;00 drops then i will hope that 4003-4006 demand keeps the bullish impetus so we can ride into 4150 wave ..
the FOMC RATE AND MEETING WILL BE VOLATILE .
GOLD IS 100% BULLISH AND IN THE HANDS OF CENTRAL BANKS.
GOODLUCK
#GOLD #XAUUSD #DOLLAR #DXY #US10Y
Trade ideas

GOLD Under Pressure! SELL!
My dear subscribers,
My technical analysis for GOLD is below:
The price is coiling around a solid key level - 4023.4
Bias - Bearish
Technical Indicators: Pivot Points High anticipates a potential price reversal.
Super trend shows a clear sell, giving a perfect indicators' convergence.
Goal - 3987.3
My Stop Loss - 4041.7
About Used Indicators:
By the very nature of the supertrend indicator, it offers firm support and resistance levels for traders to enter and exit trades. Additionally, it also provides signals for setting stop losses
Disclosure: I am part of Trade Nation's Influencer program and receive a monthly fee for using their TradingView charts in my analysis.
———————————
WISH YOU ALL LUCK

Gold Has Entered the Fifth Wave — A Drop Below 3800 Is PossibleGold continued its Wave-4 rebound today, but following a news catalyst, Wave-5 downward momentum began, and the market structure has become clearer. In such conditions, what traders need most is patience.
From the daily chart perspective, there still appears to be room for further downside. Based on my expectation, this decline may break below 3800. Of course, the market is always changing, and our outlook is based on probabilities — no one can guarantee the market will move exactly as expected. However, recent price action has been largely in line with our forecast, and I believe many of you have already secured profits from this move — that’s what matters.
Additionally, I will be traveling tomorrow and won’t be able to monitor the market in real time. So during your trades, please stay alert and prioritize risk control. Protect your capital first — profits will come naturally afterward. The market never lacks opportunities, so don’t sacrifice long-term stability for short-term gains.
Stay calm, stay disciplined, and trade safely!

GOLD HIGH PROBABILITY SETUPS SOON!!!🚨 XAUUSD HIGH PROBABILITY BUY SETUP 🚨
* Here We Can See Clearly The Next Potential Moves For GOLD Coming Hours/Days.
* Keep Your Eyes Close On Your Trading Positions.
* Happy PIP Hunting Traders.
FXKILLA.

Gold Buy Setup from 3980 – Targeting Upside ReversalDescription:
Gold has reached a key support zone near 3980, showing early signs of accumulation and a potential bullish reversal.
📈 I’m looking to buy from 3980, with confirmation from price action and trend momentum.
Targets: 4020 / 4050 / 4085
Stop loss below: 3965
Trading style: short-term to swing.
Always manage risk accordingly.
COINBASE:BTCUSD COMEX:GC1! COMEX_MINI:SIL1! OANDA:XAUEUR

600 PIPS ALREADY Price moved 600 pips already from our entry (4081-86) without any major retracement .

Gold bulls are strong; is 4100 still far away?
News:
Gold rallied after testing the 3915 area again, breaking through resistance levels at 3975-80 and 4030 throughout the day, closing with a large bullish candlestick and forming a bullish engulfing pattern.
This morning, it rose to around 4046 before falling back and breaking below the key support/resistance level of 4005-10.
Technology manifestation:
From the 1-hour chart, the current short-term resistance level to watch is 4035-4030, with a key resistance level at 4060-4055. If this area is broken, the gold price may reach 4100. The short-term support level to watch is 3960. The recommended strategy is to buy on dips, and to observe more and trade less in the middle, avoiding chasing the market and patiently waiting for key entry points.
I will provide specific operational strategies in the channel, so please pay attention.
Trading strategy:
Buy:3989-3986, SL: 3975, TP: 4010-4020-4030

Is Gold Setting Up for a Bearish Move?Gold has faced rejection from the 30-minute resistance area near 4,012, followed by a break of structure to the downside indicating renewed bearish momentum. The market structure suggests a potential short-term continuation toward the 3,968 support zone as sellers regain control.
Key Levels:
Sell Entry: 4,000
Take Profit: 3,968
Stop Loss: 4,012
Reasoning:
Technically, XAUUSD has rejected the resistance zone and confirmed a break of the structure, suggesting sellers are stepping in after a failed attempt to push higher. Lower highs and increasing bearish candles reflect momentum shifting in favor of the downside.
Fundamentally, gold remains under mild pressure as investors await upcoming U.S. economic data, while a slightly firm U.S. dollar limits bullish extension in the short term.
Disclaimer:
This analysis is for educational purposes only and not financial advice. Always manage risk and follow your own trading plan before executing any trade.

How Smart Money Moves Gold (XAUUSD)🟡 Gold never moves randomly — it moves with intention.
Every spike, every fake breakout, every sharp reversal… it’s all part of a bigger plan by smart money (institutions) to trap emotional traders and collect liquidity.
Let’s break it down 👇
⚡ 1️⃣ Liquidity Grab (The Trap Phase)
Before any real move, gold sweeps stop-losses above highs or below lows.
Retail traders think it’s a breakout — but it’s actually a liquidity hunt.
Smart money fills large positions here while emotions run high.
⚡ 2️⃣ Market Structure Shift (The Clue)
After collecting liquidity, watch for a BOS (Break of Structure) or CHoCH (Change of Character) — these reveal when the real move is starting.
⚡ 3️⃣ Smart Money Entry (The Real Move)
Once the trap is set, gold often makes a strong impulsive push.
This is where institutions enter — and where smart traders follow with confirmation, not emotion.
⚡ 4️⃣ Emotional Traders Lose, Logical Traders Win
The market doesn’t hate you — it simply feeds on emotional reactions.
Be patient, wait for liquidity sweep ➜ structure shift ➜ confirmation entry.
🧭 Pro Tip:
👉 Stop chasing candles.
👉 Study liquidity and market structure.
👉 Let the chart show who’s trapped — and then trade against them.
💬 Remember:
“The market rewards patience, not panic.”
💎 Gold (XAUUSD) moves on liquidity — not luck.
#TradeSmart #ThinkLikeInstitutions #XAUUSD

XAUUSD Best level to sell is this.Gold (XAUUSD) has turned bearish, at least on the short-term, as it broke below its 4H MA50 (blue trend-line) for the first time in a month and is headed for its 4H MA200 (orange trend-line).
Having made a Double Top at the start of the downtrend, the pattern that seems to be emerging is a Channel Down, with the last such formation seen in April - May.
So far the 4H RSI sequences between the two patterns are identical, so we expect a rebound now, which can give us the most optimal level to short again near the top of the Channel Down.
A break above 0.786 invalidates this, but as long as it holds, our Target will be the -0.236 Fibonacci extension at 3920 just like on May 15, which also hit its 1D MA50 (red trend-line).
-------------------------------------------------------------------------------
** Please LIKE 👍, FOLLOW ✅, SHARE 🙌 and COMMENT ✍ if you enjoy this idea! Also share your ideas and charts in the comments section below! This is best way to keep it relevant, support us, keep the content here free and allow the idea to reach as many people as possible. **
-------------------------------------------------------------------------------
💸💸💸💸💸💸
👇 👇 👇 👇 👇 👇

Gold failed breakout and rejected zone $4030 - $4050🧭 Chart Analysis (XAUUSD – 1H with structure context) Market Structure
That means momentum continues downward as long as price stays below 4030–4050.
🔑 Key Levels
Level Type Expectation
4050 Resistance / SL zone If broken, bears invalidated
4000 Minor resistance Retest zone after rejection
3920 Target 1 Previous swing low liquidity
3880–3850 Target 2 Measured move of the channel / full extension
3820 Extreme Final downside sweep before reversal possible
📉 Projection
If price closes below 3920 (cleanly on 4H or D1),
next leg likely extends to 3850 — the lower boundary of your yellow trend channel.
That level aligns with:
Previous liquidity grab zone from October 22 low.
Channel bottom support.
Fibonacci extension 1.272 from the 4050 swing high.
⚙️ Trading Setup Idea
Bias: Short (continue existing sell bias)
Sell zone: 4000–4020 (retests possible)
SL: 4060
TP1: 3920
TP2: 3886
TP3: 3850
TP4: 3820 (extended)
Risk–Reward ≈ 1:3.8
✅ Structure = Bearish
✅ Rejection = Confirmed
✅ Target = 3850 realistic if 3920 breaks
WE ARE SELLING If you missed the first sell then you can sell still at 4081-86 , sl at 4105 and tp at 4000 or below

GOLD LONDONGOLD LONDON TIME layer by layer on 15 min is a sniper strategy developed by shavyfxhub .
we combine EMA+SMA+TIME + STRUCTURE
on intraday hourly candle dont give sniper entry,our aim is sniper or nothing.
4000-3990-3985 will be watched
#gold

XAUUSDHello Traders! 👋
What are your thoughts on Gold?
Gold has reached a key support zone after a sharp two-day drop.
From this area, we expect a corrective rebound toward the broken structure.
This retest could complete a pullback phase before the next wave of decline resumes.
A short-term rally toward the resistance zone is likely.
If price shows rejection there, the next downside targets are expected to follow.
As long as price remains below the red resistance zone, the bearish bias remains intact.
Look for bearish confirmation signals on lower timeframes before entering short positions.
Don’t forget to like and share your thoughts in the comments! ❤️

XAUUSD – Contracting Triangle BreakdownGold has completed a 5-wave contracting triangle (labeled (1)–(5)), signaling a potential continuation of the prior downtrend. The breakout from the triangle’s lower boundary confirms momentum shift and continuation potential toward Fibonacci support zones.
📉 Bias: Bearish continuation
⚠️ Invalidation Level: Break above 4,130 (top of the triangle – would negate the bearish structure).
🎯 Profit Targets:
0.618 = 3,904
0.786 = 3,840
1.0 = 3,758 (main profit zone)
1.13–1.272 = 3,710–3,655 (extended zone for exhaustion)
The structure likely represents a Wave B triangle, with the current leg unfolding as Wave C to the downside. Breakdown volume and price action confirm the shift from consolidation to impulsive decline.
💡 Key Insight:
Triangles often act as continuation patterns before the final move in the trend direction. With the lower boundary broken, gold could accelerate toward the 1.0–1.272 Fibonacci extension zone before forming a meaningful base.
#Gold #XAUUSD #ElliottWave #TrianglePattern #TechnicalAnalysis #Commodities #Forex #TradingView

GOLD - DCL TargetsAfter today's monster drop I would like to set some targets for profit taking.
I'm short from 4236$ in this idea:
The first target was the 200 EMA at 4129$. If you are happy with the 120$ drop in 2 days you just take profits and find the next trade.
If you want a bit more you can wait for the DCL.
I think we still have 140-150$ minimum more to drop as the DCL is forming at or below the Fibonacci 38.2 level. So minimum 3974 will be tagged at the DCL. The Fibonacci 50.0 is also not off of the table at 3848$.
These kind of DCLs usually last for 5-6 days , so you can wait till next Tuesday or Wednesday before you close the short position. Don't forget 29th October FOMC, so I suggest to close Wednesday the latest . FOMC meetings can cause lots of volatility in the gold market...
I'm also watching the 6 RSI and the Slow Stochastic to get oversold.
These are the main parameters for me to take profit:
I will not hold the position during the Wednesday FOMC meeting, if we tag 3848$ before next Wednesday I will close immediately. Otherwise I wait for the RSi 6 and SlowSToch to get oversold at around 3974$.

Gold finally has a supply range! Time for bullish correction?I talked about everything but the obvious inverse head and shoulders/Quasimodo forming the right shoulder now. If everything goes right can we expect an arm to extend upwards here during the stochastic buy cycle?
Let me know what you think and be sure to share and care for others if you found this helpful.
Also talked about the "REAPER WARNING" as we have a reaper inversion range actively terrorizing price 🧩

Gold 1H - Intraday Trading Plan
🌐 MARKET CONTEXT
Price of gold (XAUUSD) recently reached multi-year highs above $4,000/oz, driven by safe-haven flows, weak U.S. dollar and expectations of monetary easing.
However, near-term headwinds are visible: optimism on U.S.–China trade negotiations, and some pull-back from record highs have switched sentiment from pure “buy the rally” to “buy the dip or maybe sell the bounce”.
There’s also focus on upcoming macro releases (e.g., U.S. Producer Price Index, Fed commentary) which could trigger swings in yields/dollar and thus gold.
Sentiment currently: Slightly risk-off supportive for safe-havens like gold, but with caution creeping in given profit-taking and potential dollar/rate reversal.
Session expectation: With London session opening soon and NY later, expect increased volatility around U.S. data and Fed-related news.
Macro bias: Mildly bullish, as long as the key support zones hold; but neutral/bearish risk increases if support breaks and dollar/yields strengthen.
📉 TECHNICAL ANALYSIS (SMC + LIQUIDITY STRUCTURE)
Structure: After the strong impulse up, price is in a corrective phase (range/flag) rather than clean uptrend. The prior strong high now acts as potential liquidity trap (smart money exhaustion).
Key zones to monitor:
Support zones where demand may appear: look for sweep of liquidity at previous lows or structural support.
Supply zones above where untested liquidity resides – places big players may unload.
Confirmation of SMC: Watch for signs of liquidity sweep (WSB/SSL), false breakout (fake BOS), or trap (smart money manipulating stop-hunts) in M15/H1.
For example: if price revisits a support zone and shows a wick below then closes back above → potential mitigation → buy scenario. Conversely, if price rallies to a supply zone then reverses sharply → possible trap → sell scenario.
🔑 KEY PRICE ZONES
$4,120–4,140 ▶️ Supply zone – near recent highs; potential profit-taking and stop-hunts above.
$4,000–3,980 ▶️ Important Support – psychological $4k level + prior swing area.
$3,935–3,905 ▶️ Strong Support – deeper structural demand zone + previous channel base.
$3,860–3,840 ▶️ Lower Support / liquidity sweep zone – if the major supports fail, this is next.
$4,200–4,230 ▶️ Extended Resistance – higher untested supply if momentum returns.
⚙️ TRADE SETUPS
✅ BUY SCENARIO – Demand Bounce
Entry: ~$4,020–4,018 zone
Stop-loss: ~$4,013
TP1: ~$4,120
TP2: ~$4,200
Logic: Price holds above key support, shows mitigation (wick below then back), CHoCH from bear-correction to bullish bias.
✅ BUY SCENARIO 2 – Deeper Support Entry
Entry: ~$3,920–3,918 zone
Stop-loss: ~$3,911
TP1: ~$4,020
TP2: ~$4,120 (trail)
Logic: If first support fails, look for deeper structural support and sweep of liquidity before large players ramp.
✅ SELL SCENARIO – Supply Rejection
Entry: ~$4,140–4,138 zone
Stop-loss: ~$4,147
TP1: ~$4,000
TP2: ~$3,920
Logic: Price rallies into supply, shows reversal (e.g., bullish candle followed by strong bearish candle) during NY session — high-risk, high-reward trap.
⚠️ SCALPING SELL – If sees quick spike above ~$4,140 (into ~$4,160) then rapid rejection → short-term sell targeting ~$4,060.
🧠 NOTES / SESSION PLAN
Focus trade entries during London ↔ early NY session, especially around macro events.
Be ready for spikes/whipsaws given current macro uncertainty.
Wait for confirmation on M5/M15 before entering: don’t jump purely on zone touches.
Avoid entering just before major data or Fed release; be cautious of fakeouts.
Risk-management: Use tight stop losses, keep trade size moderate given higher volatility.
🏁 CONCLUSION
The bias for XAUUSD remains mildly bullish, conditional on key support holding. The market is treading a line between safe-haven demand and profit-taking exhaustion. Primary focus is on the support band ~$4,000-$3,980 for long entries; conversely, the supply zone ~$4,120-$4,140 serves as a potential reversal/trap area. Enter with confirmation, manage risk tightly, and beprepared for sharp moves from macro triggers.
FOLLOW KHANG_TRADER for precision market insights ⚡

Methodology: Smart Money Concept (SMC) 📊 Technical Breakdown of the Analysis
1. Market Context
• The chart is XAU/USD on the 5M timeframe.
• A BOS (Break of Structure) to the upside was followed by a ChoCH (Change of Character) to the downside.
• This shows a possible liquidity trap where buyers were induced before price shifts bearish.
2. Liquidity Zone
• Below the marked lows there is Sell-Side Liquidity, where retail buy-side stop losses are resting.
• A Fake Out already occurred, sweeping liquidity.
3. Point of Interest (POI)
• A 5M Order Block (OB-5M) is marked inside the Resistance Zone.
• This is the key institutional area for a potential rejection.
• Planned Sell entry: 3,997.
4. Trade Management
• Stop Loss (SL): 4,013, above the resistance zone.
• Take Profit (TP): 3,951, aligned with liquidity targets.
• Risk/Reward (R/R): 1:2.88, solid for intraday setups.
5. Price Narrative
• Price is expected to retest the OB-5M rejection zone at 3,997.
• After that, the projection is a bearish move with a distribution phase.
• Final target: liquidity sweep around 3,951.
🚀 Motivational Note
“Patience is your edge: wait for price to reach your zone, trust the plan, and let risk management protect you. Consistency comes from discipline, not prediction.” ✨📉💪
GOOD LUCK TRADERS ;)

How about a big profit short trade in gold?
Hello everyone
The gold correction is still ongoing and we should wait for a good and beautiful correction.
If you want to make good profits from the market, just follow my page.
Don't forget to support me, friend!!!

Lingrid | GOLD Weekly Support Hold Long OpportunityOANDA:XAUUSD pulled back sharply from the resistance and printed a higher low right at the confluence of the uptrend and above previous week low 4,050. Structurally, the broader upward channel remains intact while price retested the downward trendline from above, keeping the higher-low sequence alive. If 4,000–4,050 support continues to hold, it favor a rebound toward 4,245 and, if momentum extends, a run at 4,400; a daily close back below 4,043 would defer the bounce. Broader momentum still skews bullish with successive higher lows, suggesting the recent drop is a corrective pullback within the trend rather than a top.
⚠️ Risks:
A decisive break below 4,000 that invalidates the uptrend confluence could extend losses toward 3,950–3,900.
Strong USD and higher real yields on hawkish Fed rhetoric/data may cap upside or accelerate downside.
Diminishing geopolitical risk or risk-on equity strength could sap haven demand for gold.
If this idea resonates with you or you have your own opinion, traders, hit the comments. I’m excited to read your thoughts!

3rd GOLD setup.After losing the 4k support I am waiting for the price to fall to the next white line which will be the next line of support. I left the Sl pretty close since the Gold looks really weak right now.
From the 3950 the price will bounce to the upper white line that will become the next resistance.
Let me know what you think. Any advice or comment means alot.

XAU/USD Short to Longs idea Yes — I still believe Gold remains bullish overall. The recent downside movement looks like a healthy correction before price continues its rally upward. I’m noticing price building liquidity, so I’ll wait for a breakout and a clean tap into one of my key POIs.
Currently, price is sitting in a 30min demand zone near a 2hr supply, where I expect a possible short-term reaction. After that, I’ll be waiting for the next solid buying opportunity — ideally from the 3hr demand around 3,860, or from a new demand that may form closer to current price this week.
Confluences for Buys:
- Price broke major structure to the upside and is now retracing
- Liquidity above (trendline + Asia highs) waiting to be taken
- 3hr demand around 3,860 could fuel the next rally
- Bullish candlestick momentum remains strong
- Higher time frames still show clear bullish structure
P.S.If price breaks below 3,850 with clear bearish structure, I’ll consider a short-term bearish phase. Until then, I’ll stay focused on long opportunities in line with the dominant trend. Have a great trading week!
