Exclusive analysis of gold's future market.
What recent news is influencing gold's performance? How should we assess the outlook for gold's bullish and bearish outlook?
Gold prices weakened again in U.S. trading on Monday (October 27), extending last week's decline. With the thaw in U.S.-China trade relations, investor demand for gold as a safe-haven asset has declined. Market focus has now shifted to the Federal Reserve's interest rate decision, with the agency expected to announce a rate cut later this week. This decline comes just as gold's nine-week winning streak ended, after the price briefly surpassed $4,300 per ounce, reaching a record high, driven by geopolitical risks and expectations of monetary easing. The latest decline stems from progress in trade negotiations. U.S. and Chinese officials reached a preliminary agreement during the ASEAN Meetings in Malaysia, with the framework expected to be finalized later this week when the two presidents meet in South Korea. The agreement is expected to extend the trade truce and pave the way for a broader trade agreement. This suggests the risk of renewed trade friction has significantly decreased. Improving sentiment has driven investors' renewed appetite for riskier assets, weakening safe-haven demand for gold.
This week marks a "super week" for gold, and the gold market will continue its surge. First, the 2025 Asia-Pacific Economic Cooperation (APEC) Leaders' Informal Meeting will take place. US President Trump will also travel to Southeast Asia, where he will meet with leaders from various countries. Furthermore, amid the US government shutdown, a series of central bank interest rate decisions will be announced this week, including those from the Federal Reserve, the Bank of Japan, the European Central Bank, and the Bank of Canada. The US will also release a series of economic data, including the September core PCE price index, a key indicator for the Fed's interest rate adjustments, and third-quarter real GDP data. Expectations of a Fed rate cut at its October 29th meeting have limited further declines in gold prices. Last week's weaker-than-expected US Consumer Price Index (CPI) data reinforced market bets on a 25 basis point (0.25 percentage point) rate cut by the Fed. Traders are also watching for further easing signals this year. Generally speaking, rate cuts reduce the opportunity cost of holding gold and weaken the US dollar, making dollar-denominated gold more attractive to overseas buyers.
Gold Market Analysis on October 28th:
Gold Technical Analysis: Gold broke through the 4,000 mark as expected. We've been emphasizing short selling numerous times today, but did you miss out? Gold successfully broke through the 4,000 mark in the US market, and the US Treasury and spot gold markets showed clear signs of rotation. The US Treasury yield index re-entered the 4% mark, reflecting a subtle adjustment in market expectations for a Fed rate cut this week and a temporary outflow of safe-haven funds. The US dollar index fell slightly by 0.14% on the day, while spot gold remained under downward pressure. Based on the current 4-hour chart, gold still has room to fall. Focus is on the upward pressure at 4,010. A break above this level will open up further upward potential. I personally believe the upward trend will not break in the short term. Having already broken through the 4,000 mark, gold is poised to test the 3,945 level. If it fails to break through this level, it is likely to trade in a range-bound manner in the short term. Trading strategies suggest that rebounds from the upper resistance level could be opportunities for short selling.
After breaking through the neckline of the 1-hour double top, gold has been fluctuating weakly below it. The 1-hour moving average continues to diverge downward, indicating bearish momentum. A break below 4004 in the US trading session provided support, but this support has now become resistance. Therefore, any resistance below 4004 in the US trading session presents an opportunity to buy on rallies. Overall, today's short-term trading strategy for gold suggests shorting on rebounds, supplemented by buying on pullbacks. Focus on resistance at 4160-4185 in the upper short term, and support at 4010-4005 in the lower short term. It's crucial to keep pace with the market. Maintain control of your positions and stop-loss orders, set strict stop-loss orders, and avoid holding onto positions. Specific trading points are based on real-time intraday data. Welcome to experience and share real-time market trends.
Gold Trading Strategy Reference for October 28th
Short Strategy:
When gold rebounds to around 4004-4010, short (buy short) a 20% position in batches, targeting around 3960-3950. A breakout targets the 3945 level.
Long Strategy:
When gold pulls back to around 3945-3950, long (buy long) a 20% position in batches, targeting around 3980-4000. A breakout targets the 4010 level.
Trade ideas

The price of gold is rising strongly!A close above (b) will confirm gold's price readiness to rise after creating a HH and HL.
N.B!
- XAUUSD price might not follow the drawn lines . Actual price movements may likely differ from the forecast.

GOLD (XAUUSD): Short Trade Before the FED
I see an intraday pullback trade on Gold ahead of
FOMC & FED Interest Rate Decision today.
The price will likely retrace from the underlined resistance,
following a confirmed bearish imbalance and a formation
of a double top pattern.
Expect a bearish movement at least to 3988 level.
❤️Please, support my work with like, thank you!❤️
I am part of Trade Nation's Influencer program and receive a monthly fee for using their TradingView charts in my analysis.

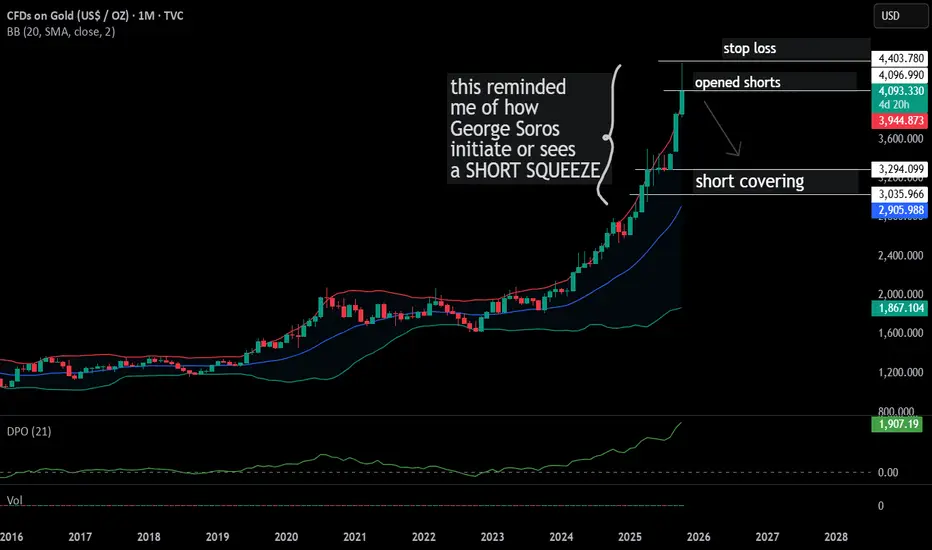
GOLD $4091 | a Short Position basic rule is when one sees a parabolic move
it's time to sell on the way up instead of aping in
difficult to contain fomo however
just have to pull t he trigger after a week of confirmation or red candle
the bounce should be opportunity to size up
and STOPS ha s to be higher
as you can get wicked ouot
GOLD | Bearish Bias Holds Below $3,944 Amid Trade OptimismGOLD – MARKET OVERVIEW | Trades Below $4,000 as Risk Appetite Rises
Gold continues to slide, as optimism over a potential U.S.–China trade deal and improving global outlook weakens demand for safe-haven assets.
The metal is now down nearly 10% from its all-time high of $4,377 (Oct 20), with the recent rally losing steam as traders take profits amid signs of progress in trade negotiations between the world’s two largest economies.
Technical Overview
Gold dropped nearly $150, exactly as projected in our previous outlook.
The price remains under bearish pressure while below 3,944, targeting 3,893, and a break below that could extend the decline toward 3,855 → 3,818.
However, a 1H close above 3,944 would indicate a potential reversal, opening the way for a retest of 3,970 → 4,011.
Key Technical Levels
Pivot Zone: 3,932 – 3,944
Support: 3,893 · 3,855 · 3,819
Resistance: 3,970 · 4,011 · 4,053
Outlook:
Gold stays bearish below 3,944, with downside potential toward 3,855 if trade optimism persists.
Only a confirmed 1H close above 3,944 would shift bias back to short-term bullish toward 4,011.

Gold 1H – Bullish Rebound After Strong Correction🟡 XAUUSD – Intraday Trading Plan | by Ryan_TitanTrader
📈 Market Context
Gold is attempting to rebound near $4,320 after a sharp correction earlier this week, as traders weigh the recent pullback in U.S. Treasury yields and renewed expectations of a dovish Federal Reserve tone.
Markets are now positioning ahead of key U.S. housing and manufacturing data, which could shape short-term sentiment for both the dollar and real yields.
• Softer economic numbers may reinforce the case for policy easing in early 2026, supporting gold’s safe-haven appeal.
• Conversely, stronger data could momentarily pressure XAUUSD, yet the broader uptrend remains intact amid central-bank accumulation and geopolitical tension.
Expect a liquidity-driven environment, with price potentially sweeping lower before reclaiming bullish momentum.
🔎 Technical Analysis (1H / SMC Style)
• Structure: Overall bias remains bullish following consecutive Breaks of Structure (BOS) and a confirmed Change of Character (ChoCH) indicating corrective retracement.
• Discount Zone: The $4,270–$4,272 demand area sits within the discount zone of the recent range (swing low to 4454 high), ideal for re-accumulation.
• Liquidity Sweep: Recent wicks near $4,300 suggest liquidity has been collected, potentially setting up for another bullish push.
• Premium Zone: Upside liquidity clusters near $4,454–$4,452, aligning with a premium supply area where short-term selling may appear.
🔴 Sell Setup
• Entry: 4454 – 4452
• Stop-Loss: 4463
• Take-Profit Targets: 4400 → 4330
🟢 Buy Setup
• Entry: 4270 – 4272
• Stop-Loss: 4260
• Take-Profit Targets: 4340 → 4380 → 4450 +
⚠️ Risk Management Notes
• Wait for M15 BOS/ChoCH confirmation before triggering entries.
• Avoid entries during high-volatility windows around U.S. data releases.
• Secure partial profits near intermediate liquidity zones, trail stops after BOS confirmation.
✅ Summary
Gold maintains a bullish re-accumulation structure following a healthy correction.
A retest into the discount zone around $4,270 offers potential long entries targeting the premium zone near $4,450+.
Only a decisive break below $4,260 would invalidate the intraday bullish scenario.
FOLLOW RYAN_TITANTRADER for more SMC trading insights ⚡

GOLD (XAUUSD): Another Pullback Trade
Gold is testing a major daily resistance that we spotted earlier again today.
It looks like the price may retrace from that one more time.
A bearish breakout of a support line of a rising channel is my
intraday confirmation.
Goal - 3989
❤️Please, support my work with like, thank you!❤️
I am part of Trade Nation's Influencer program and receive a monthly fee for using their TradingView charts in my analysis.

Gold on side Swings on Fed aftermathAs discussed throughout yesterday's session: 'My position: I am Buying Gold aggressively throughout yesterday's session all along especially when #3,952.80 benchmark got invalidated to the upside. Gap to the downside on Asian market opening delivered excellent chances to Buy more as I closed all orders with #4,000.80 Take Profit. Keep in mind that I might Sell #4,024.80 now (aggressive Scalp to the downside) only to Buy more. #4,052.80 benchmark and #4,100.80 extension are my Targets.'
If you followed Trading plan I announced above, you would be in excellent Intra-day Profits. I have Sold Gold from #4,027.80 High's multiple times and re-Bought Gold from #4,004.80 especially delivering excellent results and altered all my Trading activity (no need to gamble on Fed Rate decision aftermath). My Profit is excellent and will sit out today's session as it will be full of side-Swings where I will continue comfortable Trading throughout tomorrow's session.

XAUUSD - Bears are taking over Gold remains under bearish pressure as it trades below key moving averages and fails to reclaim the 61.8% retracement zone. A confirmed 4H close below $3,920 would strengthen the case for a continuation toward the Fibonacci extension targets listed below.
🎯 Fibonacci Extension Targets (Bearish)
Using the latest swing high to swing low:
Target 1 (38.2%) → $3,832
Target 2 (61.8%) → $3,808
Target 3 (100%) → $3,776
Bias: Bearish continuation
Confluences:
Trend Structure: Price is forming lower highs and lower lows after rejecting from the previous swing high, confirming a bearish market structure.
EMA Ribbon / Dynamic Resistance: The price is trading below the EMA ribbon, which is now acting as a strong dynamic resistance zone.
Fibonacci Retracement: Price rejected from the 61.8% retracement level of the previous downswing — a key bearish retracement zone.
Momentum Indicators: Bearish momentum increasing as candles close below the midline of the ribbon with low buying pressure.
Volume/Confirmation: Decreasing bullish volume on retracement, followed by renewed selling pressure.

Gold: Last Chance to Exit
The last forecast rode the upside nicely. Now we’re getting local setups. Near term, I expect a return to $4,115–$4,186, with a preferred target at $4,160. The decline reads as a zigzag (with a triangle in the middle), so I’m looking for a rebound into that range. More soon.

XAUUSD – CPI Cools, USD Weakens, and Gold Regains MomentumMarket Overview:
Gold has regained bullish traction after the latest US CPI report showed softer inflation data, leading to a weaker USD and renewed buying across metals.
CPI figures came in below market expectations (Core CPI 0.2% vs 0.3%, CPI m/m 0.3% vs 0.4%, CPI y/y 3.0% vs 3.1%), signalling lower inflation pressure and reinforcing bets that the Fed will stay dovish heading into November.
As a result, gold bounced strongly from the 4,050–4,058 support zone, reclaiming key structure levels and stabilising above 4,100 USD/oz.
Market sentiment remains risk-sensitive, but the short-term tone favours further upside correction, as long as gold holds above the trendline and liquidity support zones highlighted on the chart.
Technical Outlook (H2):
The market structure suggests gold has completed its correction phase and is attempting to form a new bullish leg.
Price action shows a clean rejection at the 4,050 liquidity base, and the next immediate objectives are the 4,211 neckline and 4,260–4,342 supply zones.
Key Technical Levels:
Support / Buy Zone: 4,058 – 4,002
Liquidity Sweep Zone: 3,930 – 3,940
Resistance / Neckline: 4,211
Sell Zone Reaction Fibo: 4,260 – 4,342
Trading Plan – MMFLOW View
🔹 BUY Zone #1 (Continuation Play)
Entry: 4,058 – 4,050
Stop Loss: 4,035
Take Profit: 4,155 → 4,211 → 4,260
🔹 BUY Zone #2 (Liquidity Sweep Scenario)
Entry: 4,002 – 3,930
Stop Loss: 3,915
Take Profit: 4,058 → 4,155 → 4,211
Ideal setup if price retests liquidity before CPI-induced recovery continues.
🔹 SELL Zone(Reaction Trade)
Entry: 4,260 – 4,342
Stop Loss: 4,355
Take Profit: 4,211 → 4,100 → 4,058
Weekly Bias & Summary:
With CPI cooling and the USD losing momentum, gold’s structure points to a recovery phase, possibly extending into Wave III of the medium-term cycle.
However, the 4,211 neckline remains the key pivot — a breakout above this zone could trigger momentum extension toward 4,260–4,340, while a rejection may result in another range-bound pullback.
🟡 MMFLOW Bias: Bullish while above 4,050 — dips remain opportunities to buy.
Macro tone favours risk-on rotation, supporting gold’s upside into next week.
📊 Do you think gold will break 4,211 for the next bullish leg, or is another correction incoming before the real move?
👉 Follow MMFLOW TRADING for daily institutional updates and Smart Money Flow structure.

GOLD DAILY CHART ROUTE MAP UPDATEHey everyone,
Check out our updated Daily Chart Route Map, now featuring updated levels for tracking Golds movement.
We’ve refined our proprietary Goldturn Channel, our unique method for constructing ascending channels. Price action recently broke out above the channel, with a body close above 4325, leaving a long-term gap open near 4444.
Currently, we’re observing rejection at 4325, and our channel top is now acting as support. The market is range-bound between 4325 (resistance) and 4183 (channel top as support). A decisive break above or below either of these levels will help define the next directional move, keeping in mind the open gap overhead at 4444.
On the downside, 3961 remains the pivotal swing zone, aligning with the channel midline, should we see a confirmed break below 4183.
As always, we will keep you all updated with regular updates throughout the week and how we manage the active ideas and setups. Thank you all for your likes, comments and follows, we really appreciate it!
Mr Gold
GoldViewFX

GOLD | Rebounds Above $4,000 Ahead of Fed DecisionGOLD – MARKET OVERVIEW | Rebounds Above $4,000 Ahead of Fed Decision 🪙
Gold futures climbed back above $4,000, rebounding in early trade ahead of the Federal Reserve’s rate decision later today.
The metal gained around 1%, supported by expectations that the Fed will cut rates by 25 basis points, a move that typically boosts demand for non-yielding assets like gold.
Markets have already priced in the rate cut, leaving investors focused on Chair Powell’s comments for clues on whether another cut could follow in December.
Technical Outlook
Gold remains in a bullish momentum as long as the price trades above 4,011, targeting 4,053 initially.
A 1H or 15Min close above 4,053 would confirm further upside toward 4,104.
However, if the price reverses and stabilizes below 3,982, it would shift the bias to bearish, opening the way toward 3,930 → 3,893.
Key Technical Levels
Pivot Zone: 4,011 – 4,016
Resistance: 4,053 · 4,104 · 4,148
Support: 3,982 · 3,930 · 3,893
Outlook:
Gold stays bullish while above 4,011, with potential to extend gains toward 4,104 if the Fed delivers a dovish tone.
But if Powell’s remarks turn unexpectedly hawkish and price stabilizes below 3,982, a deeper pullback toward 3,930–3,893 could follow.

Correction over - new Annual High's in sightTechnical analysis: The Price-action hit the Daily chart’s Support belt and got rejected as expected near #3,888.80 - #3,892.80 and is currently pulling back on full-bodied Daily chart's candle. In my personal belief, decline was only be temporary as it was delivered in previous Bull runs however caution is required as the Weekly catalysts are still about to be reported (Fed or not, I continue Buying preserving my Bullish stance). Technically the newly formed Ascending Channel on Hourly 1 chart still has a Lower High’s to give around #4,027.80 mark before I re-evaluate the trend and continue soaring regarding the Short-term. As I mentioned throughout my remarks, Gold is Neutral now, turning Bullish as long as Gold closes the week above the #3,888.80 configuration which is far away currently. Selling sequence is limited or near exhaustion, however Gold not only succeeded in breaking the Resistance (#3,952.80 mark) with ease and almost tested second Resistance belt, but was also comfortably Trading above it. Needless to mention on the other side, Ascending Channel is intact due to the sharp Intra-day recovery on DX and uncertainty on all market classes. This outweighs the decline on Bond Yields market.
My position: I am Buying Gold aggressively throughout yesterday's session all along especially when #3,952.80 benchmark got invalidated to the upside. Gap to the downside on Asian market opening delivered excellent chances to Buy more as I closed all orders with #4,000.80 Take Profit. Keep in mind that I might Sell #4,024.80 now (aggressive Scalp to the downside) only to Buy more. #4,052.80 benchmark and #4,100.80 extension are my Targets.

Interest Rate Decision Imminent!Key Events:
Federal Reserve Meeting: The Fed will announce its interest rate decision, with the market widely expecting a 25 basis point cut. A dovish signal from the Fed (such as hinting at further rate cuts) could boost gold prices; a cautious stance could put downward pressure on prices.
US-China Trade Situation: High-level officials from both countries have reached an agreement on a framework for a trade deal, and Trump will meet with Chinese officials today. Easing trade tensions have reduced safe-haven demand for gold, leading to a recent decline in prices.
Market Sentiment Shift: Risk appetite has increased, with major global stock indices (such as the S&P 500 and Nasdaq) hitting record highs, causing funds to flow from safe-haven assets like gold to risk assets.
Economic Data and Background:
US Economic Indicators: ADP weekly employment data showed modest growth in private sector employment (14,000 new jobs per week), but the consumer confidence index (94.6) slightly exceeded expectations. These data eased concerns about a recession, further suppressing gold prices.
Fund Flows: Gold ETF holdings decreased (e.g., SPDR holdings remained flat, iShares silver holdings declined significantly), indicating that speculative funds continued to reduce their long positions in gold, suggesting strong short-term bearish sentiment.
Long-Term Supporting Factors: Global central bank gold purchasing trends, geopolitical risks, and the Fed's interest rate cut cycle continue to support gold in the medium to long term. The London Bullion Market Association (LBMA) predicts that gold prices may rise to $4,980 in the next 12 months.
I. Price Movement Review:
Gold prices fell for three consecutive days, reaching a low of $3,886.51 on October 28, breaking below the key psychological level of $4,000, with a cumulative drop of over 10%. Technical selling and long position liquidation were the main reasons.
II. Key Technical Levels:
Support Levels:
Short-term: 3920-3900 (tested in Asian trading).
Strong Support: 3885-3880 (yesterday's low coincides with the 60-day moving average; a break below this level could lead to a test of $3,819). Resistance Levels:
Short-term: 3970-4000 (a break above could lead to 4030 USD).
Strong Resistance: 4086 (Second resistance level on the 4-hour chart).
III. Optimal Trading Strategy
Trend Judgment:
Short-term: Gold prices are suppressed by fundamentals (trade optimism + risk appetite), but the Fed decision may trigger a rebound. If gold prices stabilize above 4000, the trend will turn bullish; if they remain below 4000, a short-term top will form.
Medium-to-Long-Term: Pullbacks are considered healthy technical corrections, and central bank gold purchases and interest rate cuts support the long-term bullish logic.
Specific Trading Recommendations:
Long Strategy:
Entry Point: Light long position at 3950-3957 USD, or add to the position on dips at 3920-3900 USD.
Stop Loss: 3945 USD (if broken) or 3880 USD (below key support).
Target: 4000 USD (hold until 4030 USD if it breaks through).
Short Selling Strategy:
Entry Point: Sell short on a rebound to the $3970-$4000 range.
Stop Loss: Above $4005.
Target: $3920-$3900.
If the Fed is more dovish than expected, consider going long with a target of $4030; if hawkish, target $3880.
Risk Warning: Fed Chair Powell's speech and the outcome of the US-China meeting may trigger significant volatility. Avoid being heavily invested and affected by the volatility!

Gold weekly chart with both buy and sell entriesLast week both buy and sell levels hit for over 1000 pips each.
This will probably be my last chart for awhile as i dont think theres much intrest in this
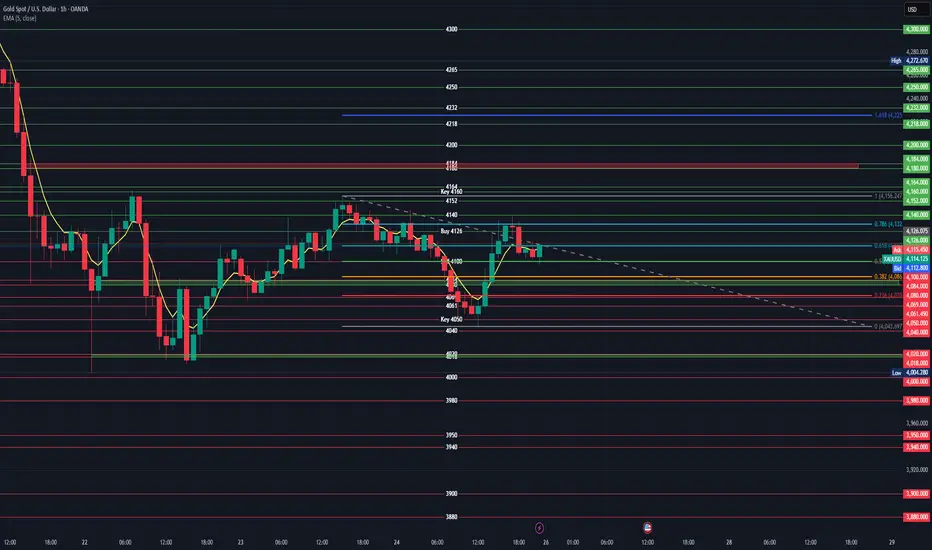
### XAUUSD 4-Hour Chart Analysis
#### **Key Levels Identified**
The chart shows critical **support/resistance zones** based on Fibonacci retracements, historical price action, and labeled key levels. Below is a breakdown of actionable buy/sell levels:
---
### **1. Buy Levels (Long Entry)**
These levels represent potential support where price may reverse upward:
- **Primary Buy Zone**: `4,126` (labeled "Buy 4126" on the chart)
- **Why?** This level aligns with the **0.236 Fibonacci retracement** of the recent swing high (4,164) to swing low (4,004). Historically, price has bounced here.
- **Entry Trigger**: Wait for bullish reversal signals (e.g., bullish engulfing candle, RSI divergence, or price closing above the 5-period EMA).
- **Stop Loss**: `4,095` (below the "Sell 4100" resistance level).
- **Take Profit**: Target `4,160` (Key 4160 resistance), then `4,180` and `4,184`.
- **Secondary Buy Zone**: `4,110–4,115` (near the 0.618 Fibonacci retracement at `4,113.253`)
- **Why?** The price is consolidating here after a dip. A hold above `4,100` (Sell 4100 level) suggests bullish momentum.
- **Stop Loss**: `4,095` (as above).
- **Take Profit**: Same as primary zone (`4,160` and beyond).
---
### **2. Sell Levels (Short Entry)**
These levels represent potential resistance where price may reverse downward:
- **Primary Sell Zone**: `4,132` (0.786 Fibonacci retracement of the swing high/low)
- **Why?** This level is a strong resistance zone where the price often reverses after a rally.
- **Entry Trigger**: Wait for bearish reversal signals (e.g., bearish pin bar, RSI divergence, or price rejecting the level).
- **Stop Loss**: `4,135` (above the resistance level).
- **Take Profit**: Target `4,099` (0.5 Fib), then `4,086` (0.382 Fib), and `4,050` (Key 4050 support).
- **Secondary Sell Zone**: `4,160` (labeled "Key 4160")
- **Why?** This is the **major swing high** (4,164) and a key psychological resistance level. A rejection here confirms a bearish trend.
- **Entry Trigger**: Price must break above `4,160` and then fail to hold (e.g., a bearish candlestick pattern at the level).
- **Stop Loss**: `4,165` (above the resistance level).
- **Take Profit**: Same as primary sell zone (`4,099` and below).
---
### **Critical Context**
- **Current Price**: `4,111.797` (EMA 5 close). This is **above support (`4,100`)** and **below resistance (`4,132`)**.
- **Trend**: Short-term downward momentum after the 4,164 high, but price is recovering from a low. Wait for confirmation of reversal.
- **Fibonacci Retracement**:
- `0.786` (4,132) and `0.618` (4,113) act as key resistance/support.
- `0.5` (4,099) and `0.382` (4,086) are stronger support levels.
- **Risk Management**:
- Always use a stop loss to limit downside risk.
- Target levels should align with the broader trend (e.g., if the trend is bearish, prioritize sell setups).
---
### **Summary of Actionable Levels**
| **Trade Type** | **Entry Level** | **Stop Loss** | **Take Profit** | **Confirmation Signal** |
|----------------|-----------------|---------------|-----------------|-------------------------|
| **Buy** | 4,126 (primary)4,110–4,115 (secondary) | 4,095 | 4,160 → 4,180 → 4,184 | Bullish reversal candle, RSI divergence |
| **Sell** | 4,132 (primary)4,160 (secondary) | 4,135 → 4,165 | 4,099 → 4,086 → 4,050 | Bearish reversal candle, RSI divergence |
> **Note**: Always validate entries with additional indicators (e.g., RSI, volume) and avoid trading during low-volume periods. The 4-hour timeframe favors medium-term trades (1–3 days), so patience is key.
Gold price recovers - resistance zone 4000⭐️GOLDEN INFORMATION:
Gold (XAU/USD) bounces from an Asian session low near $3,916, edging away from a three-week trough hit on Monday. The metal’s pullback from record highs appears to pause, though gains remain limited as traders await the Fed’s policy decision, with a rate cut widely expected on Wednesday.
⭐️Personal comments NOVA:
Gold prices are recovering, as the market is looking forward to today's FED interest rate cut, regaining the 4000 mark.
⭐️SET UP GOLD PRICE:
🔥SELL GOLD zone: 4050 - 4052 SL 4057
TP1: $4040
TP2: $4030
TP3: $4020
🔥BUY GOLD zone: 3886 - 3884 SL 3879
TP1: $3900
TP2: $3910
TP3: $3925
⭐️Technical analysis:
Based on technical indicators EMA 34, EMA89 and support resistance areas to set up a reasonable BUY order.
⭐️NOTE:
Note: Nova wishes traders to manage their capital well
- take the number of lots that match your capital
- Takeprofit equal to 4-6% of capital account
- Stoplose equal to 2-3% of capital account

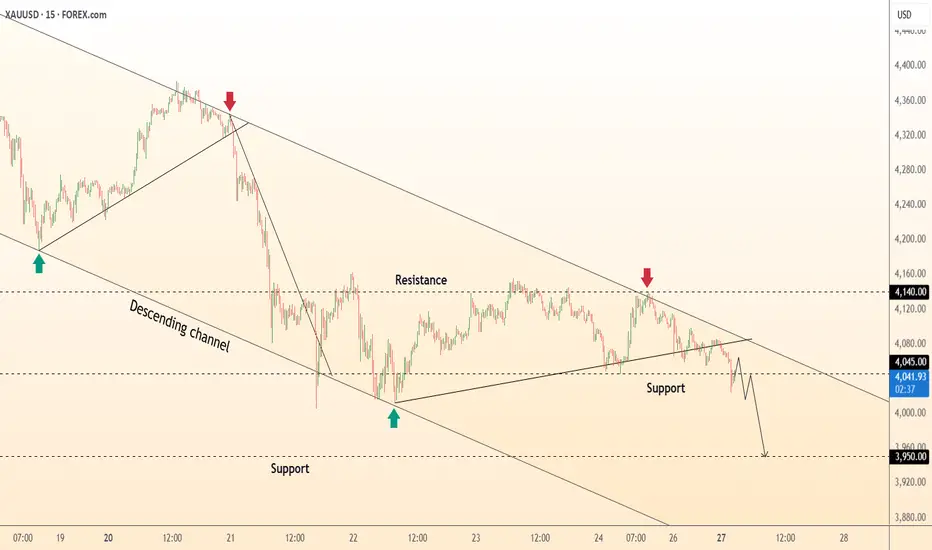
DeGRAM | GOLD is declining in the channel📊 Technical Analysis
● XAU/USD remains confined within a descending channel, forming consistent lower highs and lows, reinforcing bearish control.
● Price recently rejected the 4,140 resistance and is targeting the 3,950 support zone, confirming short-term continuation within the channel structure.
💡 Fundamental Analysis
● Gold faces pressure from a stronger USD and rising Treasury yields, as traders scale back expectations of early Fed rate cuts.
✨ Summary
● Short bias below 4,140; targets 4,000–3,950. Technical rejection and macro strength in USD sustain bearish momentum.
-------------------
Share your opinion in the comments and support the idea with a like. Thanks for your support!
GOLD 4H CHART ROUTE MAP UPDATE & TRADING PLAN FOR THE WEEKHey Everyone,
Please see our updated 4h chart levels and targets for the coming week.
We are seeing price play between two weighted levels with a gap above at 4333 and a gap below at 4225. We will need to see ema5 cross and lock on either weighted level to determine the next range.
We will see levels tested side by side until one of the weighted levels break and lock to confirm direction for the next range.
We will keep the above in mind when taking buys from dips. Our updated levels and weighted levels will allow us to track the movement down and then catch bounces up.
We will continue to buy dips using our support levels taking 20 to 40 pips. As stated before each of our level structures give 20 to 40 pip bounces, which is enough for a nice entry and exit. If you back test the levels we shared every week for the past 24 months, you can see how effectively they were used to trade with or against short/mid term swings and trends.
The swing range give bigger bounces then our weighted levels that's the difference between weighted levels and swing ranges.
BULLISH TARGET
4333
EMA5 CROSS AND LOCK ABOVE 4333 WILL OPEN THE FOLLOWING BULLISH TARGETS
4422
EMA5 CROSS AND LOCK ABOVE 4422 WILL OPEN THE FOLLOWING BULLISH TARGET
4494
EMA5 CROSS AND LOCK ABOVE 4494 WILL OPEN THE FOLLOWING BULLISH TARGET
4572
BEARISH TARGETS
4225
EMA5 CROSS AND LOCK BELOW 4225 WILL OPEN THE FOLLOWING BEARISH TARGET
3985
EMA5 CROSS AND LOCK BELOW 4122 WILL OPEN THE SWING RANGE
3985
3857
EMA5 CROSS AND LOCK BELOW 3857 WILL OPEN THE SECONDARY SWING RANGE
3741
3632
As always, we will keep you all updated with regular updates throughout the week and how we manage the active ideas and setups. Thank you all for your likes, comments and follows, we really appreciate it!
Mr Gold
GoldViewFX

GOLD | Consolidating Near Pivot, Awaiting Breakout GOLD | Consolidating Near Pivot, Awaiting Breakout
Gold is currently consolidating around the pivot zone at 3,982, as traders await fresh direction following recent volatility.
Momentum remains neutral-to-bearish, but a breakout from this range will define the next move, with volatility expected to rise ahead of upcoming U.S. data and Fed commentary.
Key Levels:
Pivot Line: 3,982
Resistance: 4,011 · 4,031 · 4,053
Support: 3,960 · 3,922 · 3,893
Trading Plan:
Sell Setup: Shorts valid below 3,982, targeting 3,960, and below it will get / 3,922 / 3,893.
Buy Setup: Longs valid only above 3,982, targeting 4,011 / 4,053.
Premium Takeaway
Gold is consolidating between 3,960–3,982, waiting for a decisive breakout.
A 15-minute close below 3,960 would confirm bearish continuation toward 3,922–3,893, while a close above 3,982 shifts bias to bullish, targeting 4,011–4,053

Price Action: Long Term, Mid Term, Short Term Trend Explained
In this article, I will teach you the basics of market trend analysis.
We will discuss Long Term, Mid Term and Short Term trends.
I will show you how to identify and apply them properly.
Please, note that we will execute the trend analysis strictly on a daily time frame.
For the trend identification, we will rely on classics price action analysis rules.
We will say that the trend is bullish if the price forms at least 2 consequent bullish impulses with a retracement leg between them, so that the price would set at least 2 higher highs and a higher low between them.
We will say that the trend is bearish if the price forms at least 2 consequent bearish impulses with a retracement leg between them, so that the price would set at least 2 lower lows and a lower high between them.
If none of these conditions are met, we will say that the market is consolidating .
Long Term Trend
Long term trend is based on the analysis of a price action over 1 year.
To identify a long-term trend, start by analyzing the price action over a period of one year from the current trading day.
Analyze highs and lows.
According to the rules, the long term trend on USDCAD is consolidation.
Mid-Term Trend
Mid-term trend is based on the analysis of a price action over the last 5 months.
To identify a mid-term trend, start by analyzing the price action over a period of 5 months from the current trading day.
Analyze highs and lows.
According to our rules, the mid term trend on the pair is bearish.
Short Term Trend
Short term trend is based on the analysis of a price action over the last 2 months.
To identify a short-term trend, start by analyzing the price action over a period of 2 months from the current trading day.
Analyze highs and lows.
According to our rules, the short term trend on the pair is bearish.
According to our trend analysis,
long term trend is a consolidation,
mid-term trend is bearish,
short term trend is bearish.
Combining these 3 trends, we can derive that the pair is trading
in a huge range . After the price reached a resistance of the range, the price started to trade both in a short term and midterm bearish trends.
We can anticipate a bearish continuation till the price reaches a support of a long term range.
That is how you execute a trend analysis with price action.
❤️Please, support my work with like, thank you!❤️
I am part of Trade Nation's Influencer program and receive a monthly fee for using their TradingView charts in my analysis.

XAUUSD BEARISH REVERSAL SETUP FROM SUPPLY ZONE🔍 Key Observations:
1. Market Structure Shift:
A Change of Character (CHoCH) has occurred near the upper boundary of the ascending channel.
This indicates a potential shift from bullish to bearish momentum.
2. Liquidity & Supply Zone:
The red zone near $4,044 – $4,018 acts as a supply zone or bearish order block.
Price has reacted from this level, rejecting higher prices.
3. Entry & Targets:
Entry: Around $4,011 – $4,018 (current zone)
Stop Loss: Above the recent high near $4,044
First Target (TP1): $3,977 – local liquidity zone
Second Target (TP2): $3,930 – $3,915 major demand area / imbalance fill zone
4. Channel Breakdown Potential:
If the price closes below the lower trendline of the ascending channel, a strong bearish continuation toward the lower targets is expected.
5. Smart Money Concept (SMC) View:
The chart aligns with liquidity grab above highs, followed by CHoCH, suggesting smart money selling pressure.
A retracement to premium zones has already happened, and distribution is likely underway.
📉 Bearish Outlook Summary:
Bias: Bearish
Entry Zone: 4,011 – 4,018
Stop Loss: 4,044
Target 1: 3,977
Target 2: 3,930 – 3,915
Invalidation: Break and close above 4,045 would negate bearish setup.

Gold is Ready For Bull From SupportHello Traders
In This Chart GOLD HOURLY Forex Forecast By FOREX PLANET
today Gold analysis 👆
🟢This Chart includes_ (GOLD market update)
🟢What is The Next Opportunity on GOLD Market
🟢how to Enter to the Valid Entry With Assurance Profit
This CHART is For Trader's that Want to Improve Their Technical Analysis Skills and Their Trading By Understanding How To Analyze The Market Using Multiple Timeframes and Understanding The Bigger Picture on the Charts
