GOLD Will make new HighAfter a sharp decline, price enters a sideways consolidation — this is often where smart money (composite operators) begin to accumulate positions before the next bullish move.
Wyckoff Accumulation Phases (Simplified)
Selling Climax (SC):
A sharp decline followed by high volume and a rebound — sellers are exhausted.
Automatic Rally (AR):
Price bounces back sharply, defining the upper range of the accumulation zone.
Secondary Test (ST):
Price retests or slightly breaks below the SC but with lower volume.
Spring (optional):
A final shakeout where price dips below support to trap late sellers.
Sign of Strength (SOS):
Breakout above resistance on higher volume and strong candles.
Last Point of Support (LPS):
Retest of broken resistance — this confirms the bullish reversal.
Trade ideas

Gold Price Targets $4,005 Amid Uptrend SupportGold price is trading near $3,984, maintaining support above the ascending trendline. The chart suggests a potential bullish move toward the $4,005 target if the uptrend holds, with key support around $3,963.

Excellent Profits on Bull runAs discussed throughout my yesterday's session commentary' : I spot more and more Sellers trapped in attempt to re-Sell Gold, remember that Gold is on undisputed Buying trend and total Bullish domination. I maintain however my #4,100.80 first Target as I am Buying from #4,022.80 last night / Asian session opening as behind us is just on of the many 'Sellers trap' week believing Gold would dip towards #3,900.80 benchmark. I remain solid with my thesis that Gold delivered correction, formed Ultimate Bottom on #4,000.80 benchmark and will continue soaring from this point as #4,000.80 will remain floor for #5,100.80 benchmark test in extension.'
I have closed my #4,022.80 Buying orders on #4,082.80 extension. As Gold formed Support structure on #4,076.80, I have aggressively Bought Gold many times there (cca. #16 re-Buy orders) and all closed near #4,100.80 benchmark. As I spotted that Gold is not delivering any reversal signs, I have added two #25 Lots Buying orders on #4,107.80 with #4,127.80 Target which was hit over-night. I am Highly satisfied with my Profit and will not Trade today's session, with my capital ready for end of the week phase and remember / being Seller on this market will hurt your capital and you are swimming against the tide.
XAU Empire | Bullish FlowXAU Empire | Bullish Flow
The market maintains a bullish structure after confirming a break of structure (BOS). Price is currently retracing into a short-term demand zone near 4,100, showing healthy correction within trend. This zone is acting as accumulation before potential continuation.
Momentum supports a move toward 4,316 – 4,386, aligning with unfilled imbalance and previous supply area. Institutional flow remains on the buy side as long as price holds above 4,080.
---
Market Bias: Bullish
Short-Term Range: 4,100 – 4,386
Key Focus: Retracement for continuation

My predictions and analysis of gold todayMy predictions and analysis of gold today were consistent with the day's market conditions:
1-Accurate judgment on support levels: The key support level at 4100 remained solid, and gold prices rebounded after hitting the bottom at this level, verifying the effectiveness of this support.
2-Consistency between oscillation/breakout forecasts and actual trends: Gold made multiple attempts to break through the 4145 resistance level but pulled back under pressure, with the high-level narrow-range oscillation in line with expectations. It was also clearly indicated that a breakout from the narrow range was likely during the U.S. session.
3-Effective trend and strategy guidance: The trading strategy provided in the morning aligned with gold's price movement, and the core strategy of prioritizing buying on pullbacks was emphasized, which fit the actual market rhythm.
4-Risk reminder: It was advised that one should not blindly chase the upward trend to avoid losses.

GOLD Is Going Up! Long!
Take a look at our analysis for GOLD.
Time Frame: 4h
Current Trend: Bullish
Sentiment: Oversold (based on 7-period RSI)
Forecast: Bullish
The price is testing a key support 4,087.79.
Current market trend & oversold RSI makes me think that buyers will push the price. I will anticipate a bullish movement at least to 4,161.33 level.
P.S
We determine oversold/overbought condition with RSI indicator.
When it drops below 30 - the market is considered to be oversold.
When it bounces above 70 - the market is considered to be overbought.
Like and subscribe and comment my ideas if you enjoy them!

Gold on upswing as expectedAs discussed throughout my Friday's session commentary: 'My position: I have Traded Scalp orders mostly throughout yesterday’s session Buying #4,005.80 on multiple occasions towards #4,015.80 and #3,992.80 aggressively towards #4,000.80 benchmark. I have Bought #3,964.80 as well as I maintain Buying every dips strategy. I have accumulated enough Profits this week and will not Trade today, comfortably taking early weekend break.'
Update: I spot more and more Sellers trapped in attempt to re-Sell Gold, remember that Gold is on undisputed Buying trend and total Bullish domination. I maintain however my #4,100.80 first Target as I am Buying from #4,022.80 last night / Asian session opening as behind us is just on of the many 'Sellers trap' week believing Gold would dip towards #3,900.80 benchmark. I remain solid with my thesis that Gold delivered correction, formed Ultimate Bottom on #4,000.80 benchmark and will continue soaring from this point as #4,000.80 will remain floor for #5,100.80 benchmark test in extension.

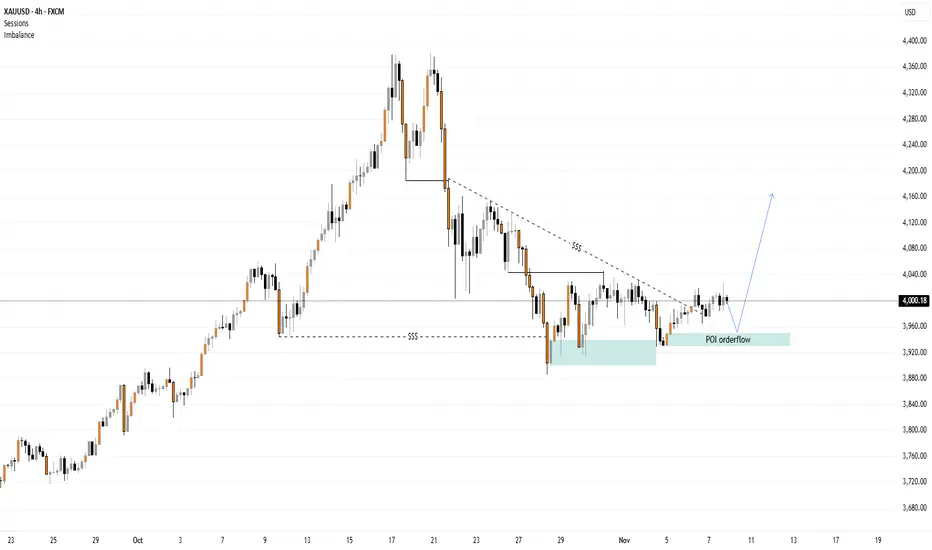
Gold Analysis H4 - Bullish orderflowAfter gold broke below the 3944.48 level, the market initially showed signs of further downside movement, potentially aiming to sweep more liquidity resting beneath that zone. However, the nature of the breakout suggests that it could itself be a liquidity grab rather than the start of a genuine bearish continuation.
The candle that broke this level was quickly rejected, indicating that selling pressure may have been absorbed by strong buy orders. This kind of price reaction often signals the presence of institutional accumulation or smart money activity.
As a result, the order flow now appears to be shifting, potentially preparing for a bullish move. If momentum continues to build, price may aim to sweep the liquidity resting above the trendline before deciding on the next directional move.
XAUUSD Eyes 4000$ Breakout as Accumulation Phase Near Completion🔍 Market Context
After a week of sideways consolidation within a broad range, gold (XAU/USD) is showing the first signs of structural recovery.
The market is gradually carving a potential short-term bottom, hinting that the corrective phase may be ending — and a breakout from the range could be imminent.
Despite the lack of new macro catalysts, sentiment remains underpinned by renewed safe-haven flows and expectations that the Fed will maintain its easing stance through early 2026.
Traders are now watching closely whether the 4,000$ handle will finally give way — a key inflection zone that could trigger aggressive momentum buying if reclaimed.
📊 Technical Structure (H1–H4)
Gold is currently trading above the intraday demand zone 3,969$–3,982$, maintaining a short-term bullish structure while compressing under resistance.
The descending trendline and Fibo confluence near 4,019$–4,048$ act as the next critical reaction area for breakout confirmation.
Key Technical Zones:
• 💎 Demand Zone: 3,969$ – 3,982$ (liquidity base + ascending trendline confluence)
• 🎯 Primary Resistance: 4,019$ – 4,048$ (trendline + Fibo 1.272/1.618)
• ⚙️ Bullish Target: 4,046$ → 4,052$ → 4,090$ (extended range liquidity)
• ⚠️ Invalidation: Below 3,960$ → risk of a deeper correction toward 3,940$.
🎯 MMFLOW Outlook
Smart money appears to be absorbing liquidity within the 3,970$ zone, suggesting accumulation before expansion.
If gold can break and sustain above 4,000$, the bias flips decisively bullish — opening the door for a range expansion toward 4,050$+.
This could mark the beginning of a new impulse phase following weeks of compression.
⚜️ MMFLOW Insight:
“When volatility sleeps, liquidity quietly builds the next trend.”

THE KOG REPORT - UpdateEnd of day update from us here at KOG:
The move from yesterday worked well giving a nice capture early session with price hitting the resistance and then the lower red box. Earlier today, although we got a long indication we only managed to get scalps for it before closing at BE.
We then activated on the boxes and subsequently completed all the red box targets in one swoop.
Now, we have support here at the 3930 level while resistance is at 3970-75 which gives us the levels that need to hold. It's looks like we may break on the box so we'll stick with the original plan from the KOG report on Sunday.
Price: 3994
RED BOXES:
Break above 4001 for 4010, 4016 and 4030 in extension of the move
Break below 3985 for 3979, 3970 and 3958 in extension of the move
As always, trade safe.
KOG

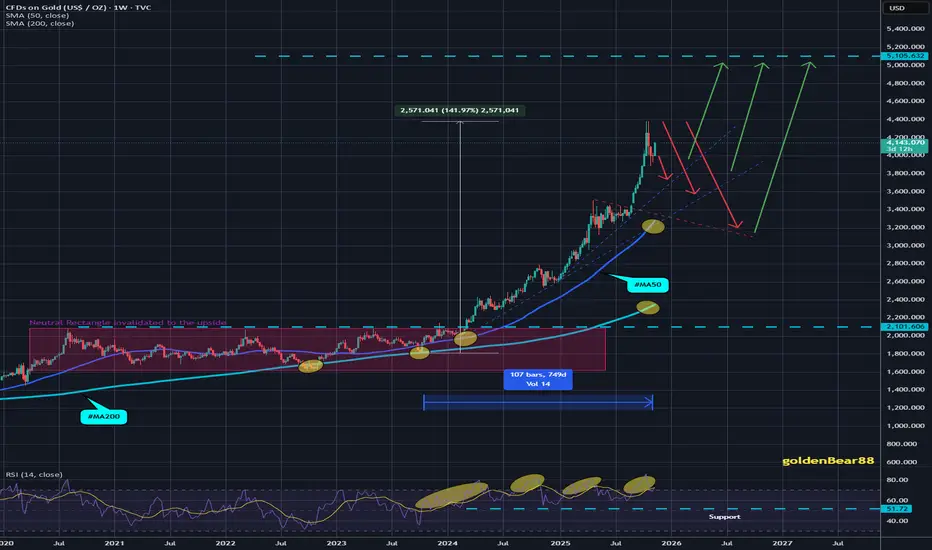
Gold Traders Beware | Sell the Trap, Buy the Expansion💥 GOLD: Smart Money is setting the trap! 💰 Expect a dip to 🟩 3800 before the $5,100 breakout. Don’t chase — position smart. 🚀
Gold has been unstoppable — printing higher highs and leaving emotional traders behind.
But now… the Smart Money trap is loading ⚠️
Price has tapped into the 🟥 4160–4220 premium zone , where liquidity is stacked and institutions quietly prepare their next move. Before the massive bullish rally to $5,100+ , expect one last shakeou t — a dip engineered to flush retail longs and reload institutional buys near 🟩 3880–3800.
The crowd will panic. The pros will accumulate. Stay patient, trade smart. 🧠✨
📊 Smart Money Breakdown:
🧠 Institutional Playbook:
Liquidity resting above recent highs 🧲
🟥 4160–4220 = Smart Money Distribution Zone
🟩 3880–3800 = Discount Reaccumulation Zone
Expect a fake-out drop → explosive bullish reversal
💡 Trade Plan:
🔻 Sell Zone: 🟥 4,161 – 4,219
🎯 Targets: 🟩 3,880 – 3,800 (ideal long re-entry area)
🚀 Ultimate Target: $5,100+ (once discount OB holds)
🟨 Price Action Confluences:
Liquidity sweep above structure highs 🩸
Fair Value Gap + Order Block alignment ⚙️
Higher-timeframe BOS still intact 💪
Elliott-style wave 2 correction before next expansion 🌊
🧭 Bias Overview:
🟥 Short-term: Controlled bearish correction
🟩 Mid-term: Explosive bullish continuation → $5,100+
💭 Mindset: Trade the trap — not the emotion .
⚠️ Disclaimer:
This content is for educational and informational purposes only.
It does not constitute financial advice.
Always apply your own analysis and risk management before trading. 💡
🔥 Follow for Smart Money + Price Action setups the big banks don’t share!
💬 Comment below — are you selling the trap or waiting to buy the dip?
⚡ Let’s ride the Gold move together — with precision, not emotion.
#Gold #XAUUSD #SmartMoneyConcepts #PriceAction #LiquiditySweep #OrderBlock #SwingTrading #Commodities #GoldAnalysis #FVG #TradingView #InstitutionalTrading #MarketStructure #GoldForecast #Forex

GOLD near Resistance ? What's next??#GOLD.. after a perfect move according to our last idea regarding gold and now market just reached near to our expected resistance area.
That is around 4115-22
Keep close and don't be lazy here.
Good luck
trade wisely

Gold Key Levels (4000-4400)These are the Gold key levels which I’ll be using for trading.
Here’s how I trade these levels:
- Close above a level → Buy setup
When a candle closes clearly above a level, it confirms bullish momentum and I look to enter long immediately after the close.
- Close below a level → Sell setup
A confirmed candle close below support signals bearish strength, and I enter short right after the close.
- Rejection from a level → Opposite trade
If price shows a strong rejection from a level, I trade in the opposite direction - rejection from resistance = sell setup, rejection from support = buy setup.
These levels works well for both day trading (using 1H candles) and scalping (using 15M or lower timeframes). It keeps trading simple, just reactions to market behaviour.

XAUUSD | Educational Sell Setup on Gold – Watching for Reversal Gold is currently approaching a major resistance area around 4165 – 4185, a level that has repeatedly acted as a short-term supply zone in recent sessions.
This region remains crucial for determining the next directional move — whether price confirms rejection or breaks through toward higher targets.
We are closely monitoring this zone for bearish reversal confirmation, preferably a bearish engulfing candle or any strong rejection structure on the 4H or 1H timeframe.
Once a clear reversal candle forms, short positions may be considered with strict money and risk management.
📊 Trade Overview
Type: Educational Sell Setup
Entry Zone: 4165 – 4185 (confirmation required)
Stop Loss: 4195 (4H candle close above)
Setup Context: Price testing resistance; potential corrective move expected upon rejection.
🎯 Target Map (Risk–Reward Structure) (SL: 4195)
Entry Risk ($) TP1 (1:1) TP2 (1:2) TP3 (1:3) TP4 (1:4) TP5 (Extended) R:R Ratio
4165 30 4135 4105 4075 4045 — 1 : 4
4175 20 4155 4135 4115 4095 4045 1 : 6.5
4185 10 4175 4165 4155 4145 4045 1 : 14
Each position is managed independently.
Partial profits are taken at each milestone (1:1, 1:2, 1:3, 1:4), and stop-loss is moved to break-even after TP1 is reached.
Remaining exposure may target the extended level at $4045 if bearish momentum continues.
⚙️ Trade Management Rules
1:1 (First Target): Partial profit + move SL to entry.
1:2 and 1:3: Gradually reduce exposure while protecting capital.
1:4: Full closure unless strong momentum remains.
Extended TP5 (1:6.5–1:14): Optional trailing continuation only under sustained bearish structure.
📈 Technical Notes
The 4165–4185 range is a confirmed supply area on the 4H structure.
4H close above 4195 invalidates this setup and shifts bias toward 4205 → 4285.
Rejection within this resistance zone keeps the short bias valid toward 4045 as an extended target.
⚠️ Disclaimer:
This analysis is for educational and informational purposes only and does not constitute financial advice.
All entries, targets, and risk parameters are provided for learning purposes within structured trading frameworks.

XAUUSD: Daily OTE & CRT Setup - Targeting the DrawdownTimeframe: Daily (1D) Chart Analysis: Smart Money Concepts (SMC) / ICT
Gold (XAUUSD) is setting up a high-probability move as it consolidates beneath the recent Daily OTE High. The daily candle is painting a potential CRT Manipulation phase before a distribution down to clear liquidity.
The Setup: Targeting the CRT Drawdown
Current Range (CRT): Price is currently held within the range of the last major daily candle, suggesting Accumulation/Distribution is in progress.
OTE High Resistance: The overhead resistance at $3,991.82 (OTE High) is critical. A potential short-term sweep above this level (the Manipulation phase of CRT) could occur to grab liquidity before the main move.
The Liquidity Target: The projected path indicates a clear run to the Daily OTE Major Low at $3,929.78. This level is a major magnet for liquidity and represents an excellent area for the next Accumulation phase and a potential long entry.
🎯 Trade Plan:
Bearish Bias: Favor a move down toward the $3,929.78 zone.
High-Probability Entry: Wait for price to enter the lower OTE zone at $3,929.78 and look for a lower-timeframe Market Structure Shift (MSS) or bullish Displacement for a long entry confirmation.
The path of least resistance is lower to mitigate the recent Daily high and collect the sell-side liquidity.
Greetings,
MrYounity

Gold Rallies 2700 pips ! Is a Correction Coming?🔥 Hello Traders!
Gold chart updated. As per our previous analysis, we expected an upward move, and the price followed it perfectly. Now it has reached supply zones, and a price correction is likely.
💰 Profit from this analysis: 2700 pips
📌 Follow me for more updates!

GOLD LOCAL BEARISH BIAS|SHORT|
✅XAUUSD is reacting from a premium supply zone after a buy-side liquidity sweep. A retracement toward inefficiency below 3980$ remains probable as smart money seeks to rebalance price delivery. Time Frame 2H.
SHORT🔥
✅Like and subscribe to never miss a new idea!✅

GOLD BIG FALLPreferably suitable for scalping and accurate as long as you watch carefully the price action with the drawn areas.
With your likes and comments, you give me enough energy to provide the best analysis on an ongoing basis.
And if you needed any analysis that was not on the page, you can ask me with a comment or a personal message.
Enjoy Trading ;)

Bullish ReversalGold failed to break into the lows, now I see a bullish reversal to test the neckline of the M-Pattern or the Double top before going back into the bearish mode

GOLD BUY TO 4,019....Used the 5min charts on this setup we have a price rejections off the measure zone at my poi after my inducements am looking forward to see price arrive at 4,019 while maintaining my stops at 3,990.....

$XAU Hit boost button if you liked the plan.
TVC:XAU | $ TVC:GOLD Clean +3.3R move smooth and stress-free trade! 💪📈

GOLD I Weekly CLS I Model 2 - Target 50% I Eventually ATH...Hi friends, new range created. As always we are looking for the manipulation in to the key level around the range. Don't forget confirmation switch from manipulation phase to the distribution phase to make the setup valid. Stay patient and enter only after change in order flow. If price reaches 50% of the range take partial or full close.
📌 HTF - Higher Timeframe view
🧩 Complete proces and Strategy explained 👇 Click Below
🎯 Why your market approach also should be mechanical ?
NO Fixed Mechanical Trading Logic - You are guessing random patterns
NO Defined trading plan - Every trade different logic
NO Same logic in each trade - Not possible to backtest
NO Backtests on at least 300 trades - Not knowing Statistics
➡️ No Statistics ➡️ No Edge ➡️ Mindset ProblemS
🧠 Core of mindset problems
If you don't know your statistics on large enough data sample. You don't know your probabilities of win rate once the losing streak happen and it happens to every strategy. You will start doubting, hesitating to take next trade because you don't know statistics of your losses. In the end you will be doubting strategy and then jump to different one. You will be in the endless loop for years, looking for new better strategy. 👊 Your ultimate goal as a trader is not to be a generalist who knows 10 000 patterns. But rather create one system with narrowed criteria of each element of the trade to remove subjective and emotional decisions as much as possible and stick to this system no matter what. Practice it 10 000 times become a MASTER.
✨ Trading Mastery is reflection of your life
Have a longterm plan, No Alcohol & Drugs, Ignore others, Focus on your journey , Backtest regularly, Review your weeks, Journal mistakes, Exercise, Sleep well, Read books, Walks in nature (no phone) , Meditate, Reduce social media time, Spend time with family, Live Life.
Trading is hard, but not impossible. I believe in you 💪
David Perk aka Dave Fx Hunter

The gold price trend is clear; opportunities lie in the timing!At the start of the week, the gold price chose a clear upward direction, breaking through key resistance levels at 4030 and 4050, reaching a high near 4095. From the overall trend structure, the bullish momentum remains strong, and the short-term trend is still robust. However, the upside potential is gradually being limited. The biggest mistake in trend trading is chasing emotions. I personally prefer to focus on resistance signals in the 4100-4120 area. If signs of resistance appear, consider shorting at higher levels. If the price retraces to the 4050-4030 area and stabilizes, that would be a more stable entry point for long positions. After the breakout, the pace accelerates. The key now lies in entry points and execution. Avoid chasing highs and blindly shorting; steadily follow the rhythm and wait for market confirmation. True stability lies not in prediction, but in the unity of execution and rhythm.
