Smart Liquidity IndicatorSmart Liquidity 📊 Indicator Guide
## Introduction
The Smart Liquidity Indicator is an advanced technical analysis tool designed to provide accurate signals about market liquidity levels. This indicator aims to help traders make informed decisions based on liquidity analysis and supply and demand levels.
**Note**: This tool is designed to assist your strategy in making the right decisions.
## Key Features
- **Entry and Exit Signals**: Provides precise signals to determine the best times to enter and exit trades.
- **Integration with Volume Profile**: Integrates with the volume profile to offer a comprehensive view of market movement.
- **Customizable Settings**: Allows users to adjust the indicator settings to suit different trading strategies.
## Tools and Concepts in the Script
- **SuperTrend**:
- A trend analysis tool that helps identify the overall market direction.
- Used to determine entry and exit points based on trend changes.
- **Volume Profile**:
- Displays high and low liquidity levels on the chart.
- Helps identify supply and demand zones.
- **Supply and Demand Zones**:
- Highlights areas where price is likely to reverse.
- Used to determine entry and exit points.
- **Candle Signals**:
- Relies on analyzing candlestick patterns to provide additional signals.
- **Oscillators**:
- Used to identify overbought and oversold conditions.
- Helps avoid trades when the market reaches extreme conditions.
- **Trend Lines**:
- Shows primary and secondary market trends.
- Used to identify potential reversal points.
## Visual Representation
- **Interactive Design**:
- The dashboard is designed to be user-friendly and interactive.
- Displays data in an organized manner for easy reading.
- **Dynamic Colors**:
- Uses dynamic colors to represent different market conditions.
- For example, green indicates an uptrend, while red indicates a downtrend.
- **Clear Visual Indicators**:
- Includes visual indicators such as arrows and circles to highlight entry and exit signals.
- High and low liquidity levels are displayed using distinct horizontal lines.
- **Customizable Display**:
- Users can customize colors, text sizes, and line styles through the settings.
- Includes options to show or hide specific elements as needed.
- **Real-Time Updates**:
- Data displayed on the dashboard updates instantly with market changes.
- Ensures that the information is always accurate and up-to-date.
- **Ease of Navigation**:
- The dashboard is designed for easy navigation between different sections.
- Displays the most important data upfront for a seamless user experience.
## How to Use
1. **Add the Indicator to the Chart**:
- Open the TradingView platform.
- Go to the Indicators section.
- Search for "Smart Liquidity 📊" and add it to the chart.
2. **Customize the Settings**:
- Click on the settings icon next to the indicator name.
- Adjust the settings according to your needs.
3. **Spot Opportunities and Exit at the Right Time**:
- Monitor high liquidity levels to identify supply and demand zones.
- Use entry signals to determine the best times to enter trades.
- Rely on exit signals to minimize risks and exit at the right time.
- Analyze the overall market trend and ensure signals align with your strategy.
**Note**: It is recommended to use the indicator in stable markets and perform backtesting to ensure its accuracy and suitability for your trading approach.
## Practical Examples
### Example 1: Identifying High Liquidity Zones
- Enable the "🔥 Show Volume Profile" option in the settings.
- Monitor areas with high liquidity (High Volume Nodes).
- Use these areas as potential support or resistance levels.
### Example 2: Using SuperTrend to Confirm Trend
- Enable the "📈 Use Trend Filter" option.
- If the trend is upward (SuperTrend line is green), look for buying opportunities.
- If the trend is downward (SuperTrend line is red), look for selling opportunities.
### Example 3: Combining Supply and Demand Zones with Volume Profile
- Enable the "📦 Show Order Blocks" and "🔥 Show Volume Profile" options.
- Identify supply and demand zones that coincide with high liquidity levels.
- Use these zones as entry or exit points.
## Acknowledgment
We extend our heartfelt thanks to the TradingView team for their continuous efforts in developing the platform and providing advanced analytical tools to users. Your ongoing support and the addition of new features to Pine Script make it possible to deliver innovative tools that meet the needs of traders worldwide.
We would like to emphasize that the "Smart Liquidity Indicator" is available for free and can be used by everyone to enhance their trading strategies. We hope this tool contributes to improving user experience and achieving their goals in financial markets.
---
**Disclaimer**: This indicator is a technical analysis tool and does not guarantee profits. Trading involves risks and may lead to capital loss.
Trade ideas

Gold price analysis June 11✏️ XAUUSD Analysis — 06/11
Today's gold trading range is being established within 100 prices, limited by the resistance zone of 4031 and the support zone of 3931.
The main trend is still up, so the strategy of prioritizing BUY following the market momentum will be more suitable in this period.
The Keylevel zone of 4031 continues to play an important role — if the buying force is strong enough to break this zone, the next target will be 4150.
On the other hand, it is necessary to observe the price reaction around the trendline and the support zone of yesterday's Asian session to determine whether the buying force is still maintained or not.
📈 Trading Plan
BUY around 3984
BUY when there is a price rejection signal at support 3931
BUY DCA when price breaks 4031
🎯 Target: 4150
⚠️ Risk: when price breaks the trendline and closes the candle below 3930

DeGRAM | GOLD is testing the resistance line📊 Technical Analysis
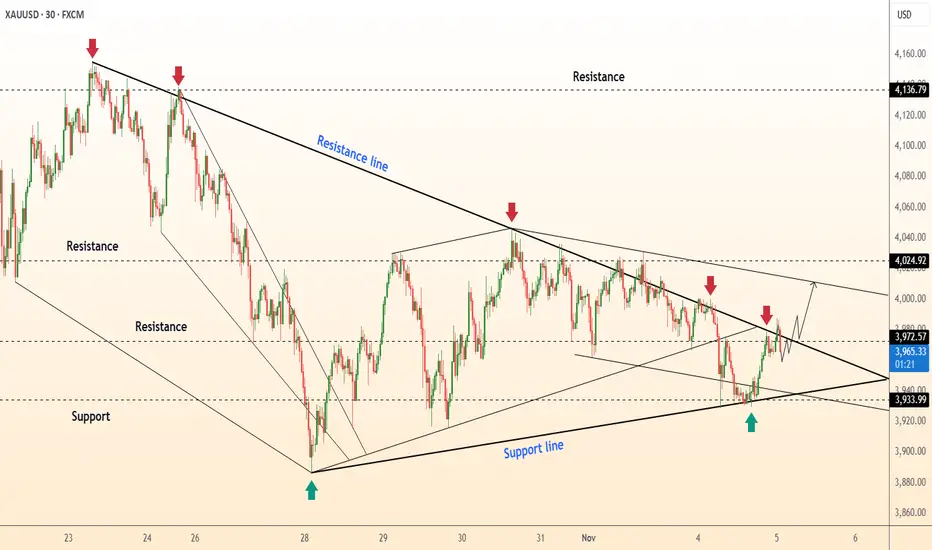
● XAU/USD has been respecting the support line at $3,933.99 and is approaching the resistance line near $4,024.92. The market has shown upward momentum after recent bounces from support, suggesting a possible breakout to higher levels.
● The price action is currently inside a rising channel, and a breakout above the resistance could lead to a move towards the next key resistance level.
💡 Fundamental Analysis
● A weaker USD and strong safe-haven demand could provide additional bullish support for gold in the near term.
✨ Summary
● Key levels to watch: Support at $3,933.99, resistance at $4,024.92. A breakout above $4,024.92 could target $4,046.60 for the next move.
-------------------
Share your opinion in the comments and support the idea with a like. Thanks for your support!
XAUUSD ONE MORE LEG DOWNSIDE🟡 Technical Overview: Gold (XAU/USD) 1-Hour Chart
This 1-Hour chart for Gold (XAU/USD) exhibits a clear shift from a short-term upward trend into a strong bearish impulse, followed by a minor corrective bounce.
The price action was characterized by an ascending channel/uptrend (marked by the blue parallel lines) which defined the market's structure. Crucially, the chart shows a decisive breakdown from the lower trendline of this channel, which occurred around the $3,980 level.
Following the breakdown, the price experienced an aggressive sell-off, dropping to a swing low around the $3,920 zone. This area, marked by a Horizontal Support Level (HS), successfully halted the immediate decline and initiated a modest corrective bounce.
📉 Analysis and Projection
The overall bias has shifted to bearish in the short term, due to the confirmed break of the prior uptrend structure. The current price action is interpreted as a bearish flag or consolidation phase following the sharp impulse move down.
Resistance (Key Bearish Zone): The most significant resistance is the prior uptrend's lower trendline, now acting as a ceiling for the price. This line intersects near the $3,980 - $3,990 area. A strong rejection from this zone would confirm the breakdown and the continuation of the downtrend. The $4,000 psychological level also sits just above this zone, providing further strong overhead resistance.
Support (Key Bullish Zone): The immediate support is the $3,920 Horizontal Support (HS). This level successfully stemmed the aggressive selling and is the critical line that buyers must defend.
Projection: The path of least resistance is to the downside. The high-probability scenario projects a move down from the current consolidation, breaking the $3,920 support. The next significant downside target would be the lower horizontal line marked on the chart, around $3,880 - $3,900, which would fill the most recent move's potential extension.
Alternative Scenario: A confirmed move and hourly close above the $4,000 psychological and former trendline resistance would invalidate the short-term bearish bias, suggesting a potential re-test of the recent swing high.
The technical indications strongly favor a continuation of the bearish move, with the $3,980 - $4,000 zone serving as the critical pivot for the next move.

GOLD LONDON MARKET OPEN.
TECHNICAL OUTLOOK
GOLD,yesterday we posted buy floor at 3965-3955 ,this reaction was expected to be on the floor of the ascending trendline and 3966 holding 100pips buy in the early hours of market open.
should gold need mre discount the next zone will 3936--3930 for demand .
the retest of the current low 3887-38890 will be watched .
layer by layer .
FUNDAMENTAL OUTLOOK
Gold's reclassification as a Basel III Tier 1 asset marks a significant upgrade in how regulators and banks view gold within global financial systems.
Why Gold is Reclassified as Basel III Tier 1
Tier 1 Status Definition: Under Basel III, Tier 1 assets are the highest quality capital assets that banks can use to meet their core capital requirements. These assets carry a 0% risk weight, reflecting their safety, liquidity, and reliability as capital.
Gold’s Historical Status: Gold has already been recognized as a Tier 1 asset for capital adequacy since the Basel I Accords in 1988, due to its status as a safe store of value with very low default risk.
New Recognition (2025): Starting July 1, 2025, physical gold held by banks can be counted at 100% of its market value in regulatory capital calculations, instead of being subject to significant haircuts or lower classifications (e.g., previously it was treated as a Tier 3 asset with a 50% deduction).
High-Quality Liquid Asset (HQLA) Label: This reclassification means gold is now officially recognized as a High-Quality Liquid Asset under Basel III, allowing it to qualify as part of banks’ liquidity coverage ratios (LCR), an important step for liquidity and capital management.
Regulatory Shift: This reflects changing perceptions that gold is not just a commodity but a true monetary asset. It is increasingly accepted as a reliable reserve asset by central banks and financial institutions worldwide.
Central Bank Adoption: This move aligns with continued aggressive gold buying by central banks, recognizing gold’s importance for capital reserves, systemic stability, and as an inflation hedge.
Significance
Banks can fully count gold toward core capital reserves.
Reduces capital burden, improving bank balance sheets and financial resilience.
Endorses gold as a strategic, monetary asset, not just a commodity investment.
Encourages institutional demand for physical gold and gold-related financial products.
Summary
Gold was reclassified as a Basel III Tier 1 asset starting July 1, 2025, reflecting its highest quality capital standing with 0% risk weighting and full market value recognition. This elevates gold’s status to a High-Quality Liquid Asset (HQLA) for regulatory purposes, facilitating banks’ liquidity coverage and capital adequacy. The change signals a major regulatory and market shift, acknowledging gold as a core reserve and strategic financial asset in modern banking systems.
#GOLD #XAUUSD

GOLD (XAUUSD) - 4H - Down Trend - SELL SET UPCurrent Market Direction
Right now, Gold is in a downtrend on 4H:
Lower highs
Lower lows
Weak bullish momentum
Price is pressing against the support zone ~3925–3940
There is no buy signal yet — Support is weakening, not bouncing.
So we do NOT buy now.
The smart move is to wait for price to pull back to a resistance zone, then sell.
Key Levels on the Chart
Level / Purpose
4025 – 4045 / Strong resistance (Sell Here)
3925 – 3940 / Current support (weak, likely to break)
3855 – 3870 / Next major demand / Take Profit area
Best Trade Setup (High Probability)
We sell after pullback into previous broken support → now resistance.
Trade Plan Summary
SELL LIMIT: 4025 – 4045
STOP LOSS: 4080
TAKE PROFIT 1: 3930
TAKE PROFIT 2: 3870
Why Not Buy Now?
Stochastic oversold does not mean reversal — just means momentum is extended.
Price is not bouncing, it is sliding sideways → bearish continuation.
Buyers are weak, sellers control structure.
Buying here = catching falling knife.
Selling pullback = professional entry.

XAUUSD 2-Hour Breakout Trading Strategy (Long Position) XAUUSD 2-Hour Breakout Trading Strategy (Long Position)
Go long on XAUUSD via breakout entry around the current price of 4051 USD once it breaks above 4051 USD. Set the stop-loss (SL) at 4023 USD.
- First target (TP1): Around 4130 USD – close half the position and trail the stop-loss (TSL).
- Second target (TP2): Around 4230 USD – close half the remaining position and trail the stop-loss.
- Third target (TP3): Around 4330 USD – close half the remaining position and trail the stop-loss.
- Let the residual position run with the trailing stop-loss in place.

Gold: Focus on Selling, Watch Resistance at 3960–3975Gold bounced after pulling back to the 3948–3921 support zone yesterday, but was capped by the 4H MA5 and fell back toward support again. On the 30-minute chart, the price action currently shows signs of a potential rebound, with the MA60 serving as the key upside resistance in today's session.
As mentioned during yesterday’s live updates, if the 3948–3921 support area breaks, the next major level to watch will be the 3800 psychological mark along with support from the daily MA60. At that stage, trading strategies should be adjusted based on real-time market behavior and sentiment.
Overall, the short-term bias remains bearish, favoring trend-following sell setups. For medium- to longer-term traders, gradual long positioning can be considered. However, volatility remains elevated in this phase, so risk control is essential—manage position size carefully and avoid emotional trading.

XAUUSD LONG SETUP INTRADAY ( NOV 06, 2025 )If you have doubt on our trades you can test in demo.
OANDA:XAUUSD LONG SETUP
EP: 3993.469
TP: 4017.410
SL: 3981.518
Trade Ideas:
Idea is clearly shown on chart + we have some secret psychologies and tools behind this.
Trade Signal:
I provide trade signals here so follow my account and you can check my previous analysis. So don't miss trade opportunity so follow must.

GOLD Short From Resistance!
HI,Traders !
#GOLD made a retest
Of the horizontal resistance
Of 4020.10 from where we
Are already seeing a local
Bearish reaction so a further
Move down is to be expected !
Comment and subscribe to help us grow !

XAUUSD – PRIORITIZE BUYING, TARGET 4040XAUUSD – PRIORITIZE BUYING, TARGET 4040 🎯
🌤 1. Overview
Hello everyone 💬
My perspective on gold today is still to prioritize buying, as there hasn't been a clear deep decline.
The price is currently consolidating in a narrow range, needing more time to build momentum before breaking out.
I will wait to buy again at the OB area – where there is high liquidity, this is a zone likely to see strong price reactions.
The best scenario today: the price may sell off slightly at FVG, then drop to OB to trigger the buy setup.
💹 2. Technical Analysis (ICT Perspective)
💜 Price Structure: Gold still maintains a short-term uptrend, the main trend hasn't been broken.
💎 Liquidity: Liquidity is concentrated below the 3940 area – a potential buying OB.
💫 FVG: The 3975–3980 area is a zone where a slight bearish reaction may occur.
⚙️ Order Block (OB): 3938–3945 is a crucial support zone, with the potential for a strong price rebound from here.
📈 Main Target: 4040 – a high liquidity zone, coinciding with a large frame FVG.
🎯 3. Reference Trading Scenarios
💢 Short SELL (scalping)
Entry: 3980 | SL: 3988
TP: 3972 – 3960 – 3940
💖 Main BUY (priority)
Entry: 3940 | SL: 3932
TP: 3952 – 3968 – 3990 – 4012 – 4035
✨ 4. Important Notes
🔹 Observe price reactions at FVG and OB before taking action.
🔹 If the price exceeds 3988, the bearish scenario is temporarily invalidated.
🔹 The main direction is still to buy according to the Smart Money trend – only consider short selling when confirmed.
🌷 5. Conclusion & Interaction with LanaM2
Gold is still following the Smart Money Flow trajectory,
patiently waiting for the price to reach a favorable zone to act 💪
This is not an investment recommendation, just a personal perspective based on the ICT method.
If you find it useful, please 💛 like – 💬 comment – 🔔 follow LanaM2
to stay updated with the latest gold insights every day.

Gold Accumulates on Support, 3,952 USD is the Gateway for a New🔍 Market Context
Gold is oscillating within a symmetrical triangle pattern , reflecting price compression and waiting for a breakout signal.
Buyers still maintain a short-term bullish structure, but the series of lower highs indicates increasing selling pressure.
The 3,959–3,964 USD zone is currently the “balance point” — if this area is breached, the downtrend could extend to the lower liquidity zone around 3,929–3,921 USD .
💎 Key Technical Zones
• Resistance Zone: 4,020 – 4,040 USD → the main resistance area of the triangle, where strong reactions are likely.
• Support Zone: 3,959 – 3,964 USD → the support area maintaining the bullish structure.
• Liquidity Zone: 3,929 – 3,921 USD → low liquidity area, potential to attract price stop sweeps before reversing.
🎯 Trading Scenarios
1️⃣ BUY Setup – Prioritize when price holds above support
• Entry: 3,959 – 3,964 USD
• Stop Loss: 3,940 USD
• Take Profit:
– TP1: 3,985
– TP2: 4,020
– TP3: 4,040
– TP4: 4,096
✳️ “Buy the discount” – Buy at the trendline convergence support area when confirmation signals appear (rejection or bullish ChoCH).
2️⃣ SELL Setup – Scenario if support breaks
• Entry: 3,950 – 3,955 USD (after candle closes below support zone)
• Stop Loss: 3,970 USD
• Take Profit:
– TP1: 3,935
– TP2: 3,925
– TP3: 3,912
✳️ “Sell the breakdown” – Sell when support is clearly breached, targeting the lowest liquidity zone (3,921 USD).
💬 Summary
Gold is in a phase of accumulation before major volatility .
If it holds above the 3,952 USD zone → prioritize BUY following the bullish structure .
If it breaks below 3,952 USD → SELL following the breakout towards the Liquidity Zone.
The scenario will be clearly confirmed when the current symmetrical triangle is broken.
💡 Today's Tagline:
“Liquidity defines direction — follow where the money hides.”
⏰ Timeframe: 1H
📅 Updated: 11/04/2025
✍️ Analysis by: Captain Vincent

Right now, I've discovered another market opportunity.We publicly pointed out that we should pay close attention to the resistance in the 4100-4120 range. After encountering resistance, a pullback was expected. The market trend was largely in line with our expectations, with the lowest point reaching around 4074. We were very satisfied with the substantial profit we achieved.
There was indeed some upward movement during the day. This week, we need to focus on the news: Although the market continued its strong performance at the beginning of the week, it was easy to create the illusion that a "sharp rise was about to happen". However, the government shutdown is now in its final countdown, so we need to be wary of potential risks. Once the shutdown ends, the market may see a significant pullback. Since relevant news has already released signals, we should remain rational about the recent rise and not blindly follow the trend. There is always something fishy going on, so it is better to be cautious. For more detailed instructions, please refer to the notification at the bottom.
From a technical perspective, gold has repeatedly faced resistance near 4110 after breaking through 4100. It is severely overbought in the short term and shows signs of a potential top. I personally do not recommend continuing to buy at this high level to avoid a sharp drop, which is a common market shakeout pattern. Therefore, my strategy remains to prioritize short-term shorting. From the current structure, 4100 has not truly stabilized. Do not blindly and aggressively chase the upward trend. Focus on short-term adjustments and seize opportunities to trade within the time frame. Short positions can be initiated in the 4100-4120 range, with a target of 10-40 USD. The key support level to watch is 4050-4030, which can be considered as a range for buying on dips and medium- to long-term positions. It is best to remain on the sidelines and not participate in positions in the middle range. The 4100-4120 range remains a key focus for short-term bears. Market trends don't only rise or only fall. If you grasp the opportunities well, every phase can be a chance. Generally speaking, don't blindly chase the rise when you're bullish. Flexibly manage the rhythm of primarily long positions and secondarily short positions, and follow the trend to achieve steady success.

GOLDGold price faced rejection near the 4,000 resistance zone and is now showing bearish pressure. Price broke below the short-term channel and is heading toward the first support around 3,960. If this level fails to hold, the next key support lies near 3,925, where buyers may look to re-enter. Overall sentiment: short-term bearish below 4,000
"Thank you for your support! If you found this idea valuable or learned something new, please consider liking and leaving a comment. I’d really appreciate hearing your feedback and thoughts."

GOLD Local Short! Sell!
Hello,Traders!
GOLD tapped into a premium supply zone, engineering liquidity above equal highs before showing bearish displacement. Expect a continuation move toward the downside imbalance. Time Frame 5H.
Sell!
Comment and subscribe to help us grow!
Check out other forecasts below too!
Disclosure: I am part of Trade Nation's Influencer program and receive a monthly fee for using their TradingView charts in my analysis.

XAUUSD 1H: Order Block and Liquidity Targets for Potential LongKey Observations:
Break of Structure (BOS): Price has recently broken below a previous low, labeled BOS (Break of Structure). This indicates a shift to a bearish market structure in the short term, often leading traders to look for a retracement before a continuation of the downtrend.
Order Block (OB): A crucial area is highlighted and labeled OB (Order Block). This is a zone where significant institutional selling or buying pressure is believed to have entered the market previously. In this context, the OB is a potential resistance/supply zone that the price may retest.
Liquidity ($$$): Two levels above the current price are marked with $$$. These represent liquidity pools, which are areas where stop-loss orders from short sellers or buy-stop orders from breakout traders are likely resting. Institutional traders often target these zones to fuel their own trades.
The first $$$ (around 3,990) is an immediate target or a minor swing high.
The second $$$ (around 4,010-4,015) is a higher target, representing a more significant swing high.
Proposed Trade Scenario: The solid black line and the dotted arrow show the projected price path:
A retracement (pullback) into the Order Block (OB) zone (around 3,960 - 3,975).
A reversal within or near the OB, leading to a rally (buy/long).
The price targets are the liquidity ($$$) levels.
Current Price Action: The price is currently around 3,937.83, which is below the main Order Block, suggesting the price has already reacted to the BOS and is deep into a decline. The anticipated setup is a counter-trend move (a bullish reaction after a bearish move) or a re-accumulation phase before a larger move.

XAUUSD Rangebound Currently XAUUSD Rangebound from 3980-4025 -zone. This Accumulation zone is more volatile as it ready for Implusive Repture.
What are my conditions For This setup?
- I'm expecting then buy trade once any candle closes above 3995 area & expecting the reversal move towards 4028- 4047 target .
Although I already took buy .
✳️Secondly if H4-H1 candle closes below 3980 our buying will be compromised & Market will fall to lower liquidity 3940-3925 zone .

WE ARE BUYING A buy at 3975-70,sl 3955 an update by 6am UTC on whether to hold or close of invalidity

Daily double bottom on daily formed !Bullish momentum is rising again, showing that buyers are not yet ready to give up control
Gold Price has bounced from a key support zone around 3,900 and is now showing signs of recovery. The chart outlines three upside targets based on the breakout from a descending channel
First target near 4,050
Second target near 4,150
Final target around 4,250+

Sell XAUUSDXAUUSD liquidity trade towards 3940. A head and shoulders pattern can be used as reference for the sells on the 15-minute chart. With ADP stat release favoring the USD, XAUUSD price could see sharp bears from here

Gold Breaks Out from Accumulation, Eyes Wave 3 Expansion🔍 Market Context
Gold kicked off the new week with strong upside momentum, perfectly aligning with MMFLOW’s previous outlook — calling for a Wave 3 impulse from the accumulation base around 3,940$ – 3,970$.
The market’s reaction in early Asia confirmed a bullish structural shift, as gold continues to gain traction amid stable yields and cautious sentiment around the US Dollar.
Macro catalysts remain balanced, but liquidity behavior suggests smart money is loading into the breakout phase, positioning early for a potential run toward the 4,100$ handle this week.
If momentum sustains, this move could mark the official mid-term reversal that MMFLOW anticipated — setting up a broader recovery phase into year-end.
📊 Technical Outlook (H4 Structure)
Gold continues to follow its Elliott Wave recovery path, now developing Wave (3) within the medium-term bullish cycle.
Key Technical Zones:
• 💎 Support: 3,942$ – 3,982$ (accumulation base & breakout retest)
• 🎯 Target 1: 4,072$ – 4,133$ (Wave 3 completion zone)
• ⚙️ Target 2 / Extended: 4,189$ – 4,201$ (Fibo 1.618 extension)
• ⚠️ Invalidation: Below 3,940$ → loss of short-term momentum, return to neutral structure.
The breakout above 4,000$ reinforces bullish sentiment, while higher highs and sustained volume through 4,072$ would confirm a new impulsive phase with room to expand further.
🎯 MMFLOW TRADING View
This breakout isn’t random — it’s a smart-money-led accumulation exit after weeks of liquidity sweeps.
The narrative remains consistent: “Buy the dips inside strength.”
As long as gold stays above 3,970$, the probability of retesting 4,100$+ remains high, and a move toward 4,200$ before year-end cannot be ruled out.
⚜️ MMFLOW Insight:
“When the crowd hesitates, liquidity has already chosen direction.”

Gold prices are consolidating on November 7th, awaiting the non-Gold has completed its technical adjustment after a period of consolidation on the hourly chart. Short-term moving averages are starting to turn upwards, and the price is gradually rising above them, suggesting potential for further rebound in the short term. The key resistance level to watch is around 4020-30. On the 4-hour chart, short-term moving averages are largely flat and converging, indicating a potential breakout. The non-farm payroll data is unlikely to be released tonight. On the hourly chart, the price is gradually trending upwards along the short-term moving averages; monitor the short-term correction.
Trading Recommendation: Focus on the 4020-30 resistance zone and begin gradually establishing short positions.
Gold Rejection at Resistance with Potential Bearish PullbackAnalysis:
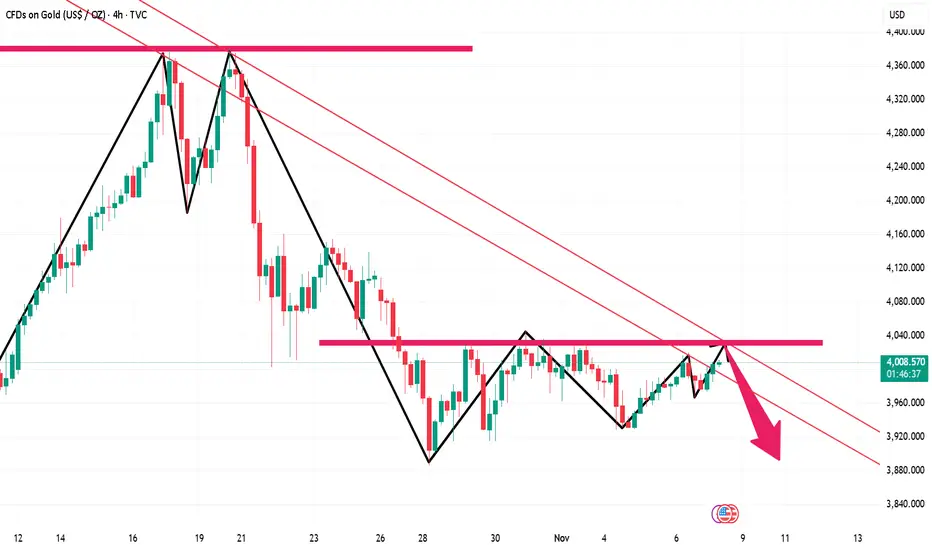
The chart shows XAUUSD approaching a strong horizontal resistance zone around 4015–4020, a level where price has previously been rejected multiple times (highlighted in yellow). The market recently broke out of a falling channel, showing short-term bullish momentum, but now price is stalling again at this key resistance.
The grey zone above suggests a supply area, and the white arrow indicates a projected bearish move. As long as gold stays below this resistance, the probability of a downward correction increases.
A potential bearish target appears around 3900–3920 (previous support zone), where buyers may re-enter.
Key Points:
Strong multi-touch resistance at 4015–4020
Price showing early rejection signs
Bearish correction likely if price fails to break above resistance
Downside targets: 3920, possibly 3900
