Wait for the big correction down on gold to finishHi traders,
Last week gold failed to go up and started making a complex pullback (WXY) now, where wave X was a Triangle. After that it dropped and made a corrective upmove.
So next week we could see another downmove to finish the bigger correction down.
And then the next impulsive wave up.
Let's see what price does and react.
Trade idea: Wait for a rejection with an impulse wave up from the Weekly FVG. After a small correction down on a lower timeframe and a change in orderflow to bullish you could trade longs.
This shared post is only my point of view on what could be the next move in this pair based on my technical analysis.
But I react and trade on what I see in the chart, not what I've predicted or expect.
Don't be emotional, just trade your plan!
Eduwave
Trade ideas

I think cycle the end This is only idea history base idea i dont know this is correct or not but this is very high rate poor person how to buy yellow metal uff heavy rate in markets this is danger for human life gold is not safe for womans snatching problums in humans life sorry for my poor language
LiamTrading – Gold compressed at the triangle peak; watch for...LiamTrading – Gold compressed at the triangle peak; watch for a break at 4020 (H2)
After a week of accumulation, the price is pressing into the triangle peak between the descending trendline (from late October) and the ascending trendline (from 11/5). The advantage will lean towards an increase if 4020 is broken and sustained.
Technical Analysis (priority H2, Volume Profile – Trendline – S/R – Fibonacci)
Trendline & Structure
The descending trendline is blocking the recovery waves; the ascending trendline supports the adjustment waves.
Closing the H2 candle above the confluence zone ~4020 will confirm a clear upward movement.
Support / Resistance (S/R)
Main support: 3970–3972 (swing low & “Key level Support”).
Decision zone: 4014–4020 (break–retest zone).
Resistance: 4045 (medium-term), 4050 (supply for scalp orders), upper band 4105–4110.
Volume Profile (recent session / composite)
POC magnet: 4015–4017 → likely to have profit-taking/fluctuations; staying above POC turns this area into a launchpad.
LVN: around 4020 → beautiful break-and-go; failing to hold often pulls back to 4015/4010.
Fibonacci Extension (H2 swing)
1.618 coincides with 4045–4050 → first upward target.
2.272/2.618 creates a liquidity zone 4095–4110 → area may weaken/strong profit-taking.
Today's Trading Scenarios
Scenario 1 – Buy on breakout
Entry: 4020–4022 after closing above trendline + retest holding 4018–4020
SL: 4014
TP: 4045 → 4070 → 4100–4110
Management: Take partial profit at 4045; move SL to break-even when reaching +1R. Staying above 4020 turns POC 4015–4017 into support.
Scenario 1b – Buy on pullback (before breakout, cautious volume)
Entry: 3998–4002 (“400x”) when there is an upward reaction at the ascending trendline
SL: 3988
TP: 4017 → 4045
Note: H2 closes below 3988 → cancel the order.
Scenario 2 – Sell scalp at resistance
Entry: 4048–4052 (confluence of Fibo 1.618 + supply zone)
SL: 4056
TP: 4040 → 4030 → 4020
Note: This is counter-trend. Ignore if H2 closes strongly above 4052.
Summary
The upward bias is confirmed when breaking–holding 4020, opening targets 4045 → 4070 → 4100+. Before that signal, trade within the range respecting POC 4015–4017 and ceiling 4045/4050. Risk per order 0.5–1%, move SL to BE when reaching +1R.

XAUUSD:H1:BUYHello traders,
Gold has formed a clear consolidation range. Price is currently reacting to the lower boundary of this range, where a bullish reversal is possible. As long as this zone holds, my bias remains bullish, expecting an upward continuation in line with the current market structure.
This is a personal market outlook.

Gold & Silver Outlook | Central Bank Buying & Correction (5 Nov)🟡 GOLD & SILVER MARKET ANALYSIS - November 05, 2025
Central Bank Buying:
Global central banks remain in accumulation mode after adding 1,000+ tonnes in 2024.
* China: 2,298t | India: 879t | Russia: 2,335t
* Emerging markets’ gold purchases +30% YoY, driven by de-dollarization and inflation hedging as USD reserves fall below 58%.
Silver Demand & Deficit:
* Industrial use hits 680M oz (+11% YoY) — a record.
* Solar PV: 232M oz | EVs: 90M oz
* Deficit: 215M oz — extending into 2025 as mine output stays flat.
📈 Outlook: Range $47–$55/oz, with potential breakout as green tech ramps.
ETF & Market Sentiment :
* Gold ETFs (GLD): +$3.6B inflows in Oct, but -$2.1B outflows in Nov on profit-taking.
* Silver ETFs: Mixed flows, cautious sentiment.
* Gold RSI: ~68 → short-term pullback risk.
* Forecast: Inflows could rebound in Q1 if Fed resumes easing.
Futures & Positioning :
* CME Gold OI: 528,789 contracts (+WoW)
* Implied Vol (Dec): 21.1% | Call/Put Bias: 60/40 (bullish skew)
* Silver Vol: ~25% — traders shifting to policy-driven long bets.
Macro Drivers :
* Fed: 25bps cut + hawkish tone (CPI 2.6%)
* U.S.–China Truce: Reduces tariffs, softens safe-haven demand.
* BRICS: Advancing gold-backed settlement systems.
* Dollar Share: Falls to 58% of global reserves.
Performance & Forecast :
* Gold: $3,941/oz | -1.5% today | +50% YTD
* Silver: $48/oz | -1.0% today | +66% YTD
📊 Projection: Gold eyes $4,400 | Silver targets $57 by mid-2026.
🕐 Astro Window (UK Time): 1:00 PM–4:30 PM bullish spike expected.
Bias : Short-term correction likely → overall bearish bias until supports retest.
Check chart for buying/selling levels.

Nov 5, 2025 - XAUUSD GOLD Analysis and Potential Opportunity📊 Analysis:
Yesterday formed a solid bearish candle, confirming that downward momentum remains dominant.
The key support lies between 3908–3915 — if this zone breaks, bearish momentum will strengthen further.
During the Asian session, watch the 3927–3930.5 area closely.
If this level holds, a short-term rebound toward 3960–3965 is possible. I’ll be watching that zone for potential short entries from resistance.
If price breaks above 3965, it would signal that bearish pressure is fading — only then will I look for buy setups on pullbacks into support.
For now, the overall bias remains bearish, though small intraday bounces can occur before any continuation.
🔍 Key Levels to Watch:
• 4000 – Psychological level
• 3994 – Resistance
• 3971–3980 – Resistance zone
• 3960–3965 – Major resistance
• 3947 – Support
• 3927–3930.5 – Support zone
• 3908–3915 – Key support
• 3900 – Psychological level
📈 Intraday Strategy:
SELL: If price breaks below 3927 → target 3922, with further downside toward 3915, 3908, 3905
BUY: If price holds above 3944 → target 3947, with further upside toward 3950, 3953, 3960
(⚠️ short-term rebound setup only — not a trend reversal signal)

XAUUSD📊 GOLD (XAUUSD) – H4 Bearish Flag Breakout + Daily Bearish Structure
On the H4 timeframe, gold formed a bearish flag between 3,890 and 4,050.
As expected, the flag pushed slightly to the upside, then broke to the downside at 4,006.
Price retested the flag and is now moving lower again — confirming bearish continuation.
On the daily timeframe, we are in a clear downtrend:
Swing high: 4,420
Swing low: 4,400
Lower high: 4,154
New lower low: 3,886
Latest lower high: 4,046
This structure confirms that sellers remain in control.
✅ What I’m waiting for:
1️⃣ A rejection at 3,875 = sell opportunity (H1/H4)
2️⃣ A break and daily close below 3,900 → momentum continuation
📌 Best zone to sell: 3,875
Because at that level:
liquidity below the previous low is cleared
a new lower low forms on daily
bearish trend continues cleanly
Bias stays bearish until we break and close below 3,875.
Lonterm it's looking for 3500

GOLDPreferably suitable for scalping and accurate as long as you watch carefully the price action with the drawn areas.
With your likes and comments, you give me enough energy to provide the best analysis on an ongoing basis.
And if you needed any analysis that was not on the page, you can ask me with a comment or a personal message.
Enjoy Trading ;)

XAU/USD – Range Trading Within Key Supply and Demand ZonesGold (XAU/USD) is currently consolidating in a tight horizontal range between $3,920 – $4,060, showing a clear balance between buyers and sellers on the 1-hour chart. After several failed attempts to break above resistance, momentum appears to be losing strength, hinting at a potential short-term pullback.
The current setup shows price trading near the upper boundary of the range, aligning with a visible supply zone. This offers a risk-reward opportunity for short-term traders anticipating a rejection from resistance.
Key levels to watch:
Resistance zone: $4,050 – $4,060 (range high / supply area)
Support zone: $3,920 – $3,940 (range low / demand area)
Mid-level: $3,990 (balance line)
Trading plan:
If price remains capped below $4,060 and forms a bearish rejection candle, short positions could target $3,940, with stops above $4,065.
However, a confirmed breakout and close above $4,065 may invalidate the short setup, opening the door for a bullish extension toward $4,100 – $4,120.
Technical summary:
Structure: Sideways consolidation within major range
Bias: Bearish while below $4,060
Tools used: Support & resistance, supply-demand zones, price action
Gold continues to trade indecisively within its range — a breakout from either boundary will define the next major move. Traders should stay patient and wait for confirmation before engaging.
Follow for more professional gold analysis and refined intraday trade setups every day.

Can gold prices go long amid a narrow stalemate?#XAUUSD TVC:GOLD OANDA:XAUUSD
Gold prices continued to fluctuate narrowly throughout the evening⚖️, with the hourly and 2-hour moving averages converging in the 4010-4005 range, as both bulls and bears awaited a clear directional decision from the market.📊
However, from a technical perspective, gold prices have failed to break below the 4-hour moving average support at 3995 and the daily MA5 at 3985📈. These are crucial short-term support levels🚀, and the fact that gold prices haven't broken them confirms strong buying support below💪. This suggests that any short-term decline should be viewed as a technical correction rather than a market reversal.🤔
Therefore, although the short-term direction is not yet clear, considering the support formed by the 4-hour moving average and the daily MA5, I remain bullish and await a breakout from the consolidation pattern in gold prices🐂.
There may not be much clear information tonight, so let's take a look at the performance of gold prices in the Asian session👀. In summary, the current trend is still in an upward channel. As long as the 3995-3985 level holds, I will maintain a bullish view. On the upside, pay attention to the short-term resistance at 4020-4030🤩.

Parallel Channel Observation H1XAUUSD GOLD Update H1 Timeframe 🙌
- This Analysis is based on educational purposes using Technical aspect Parallel Channel 🔋
- Parallel Channel indications for a good bullish opportunities point from 📈
Targets would be at 4026 - 4047 - 4082.00 ✅️
Note : if Channel breaks this idea will be in Invalid ❗️
All you need to stick with one Mentor with Discipline Consistency and Focus Mindset 💯
#XAUUSD

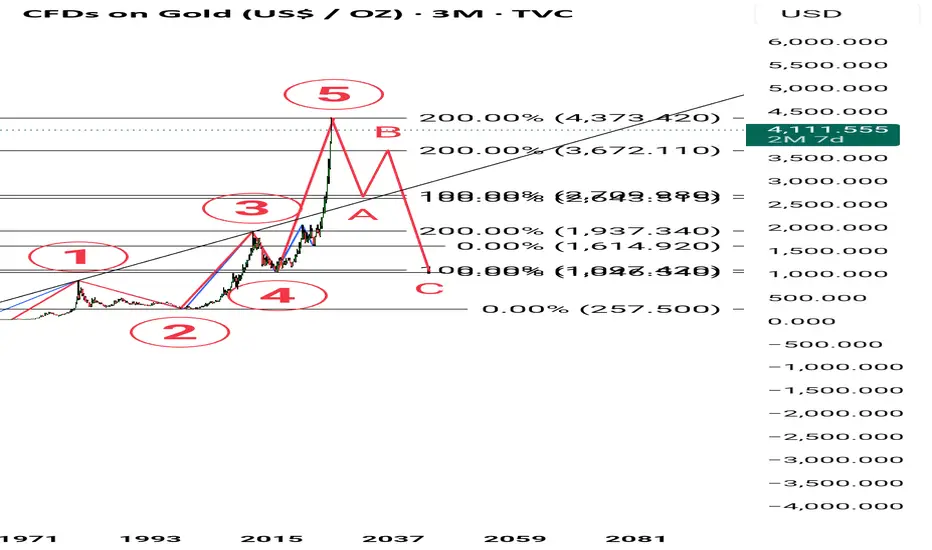
Gold Weekly Summary and Forecast 11/1/2025Gold closed the month with a green bar which signals the bullish run is not over yet. From monthly TF, I am expecting the price to test 78.6% Fibo level and rise up to previous ATH at 4380 at least for the month of Nov.
Weekly candle is not showing bullish continuation yet, as it's still printing a red candle. From daily, the hanging red candle is also suggesting a drop is coming. Therefore, I am expecting a initial drop to 3940 and rise from there at the later stage of next week.
let's see what the market will provide.

BULL CONTINUATIONHere you go again, guys!
500 pips target. At 200 pips, close half/all or hold some till TP🤝

Gold in consolidation, what to look out forActually, I'm expecting prices to fall again, but if the chart suggests otherwise...
The price is still moving sideways and consolidating the latest slide.
Support in the USD 3,930 range is holding and the price is rising again within the range. However, volume is lacking.
The falling resistance line has now been broken. Could this be a turning point? We're not there yet, but the picture is brightening somewhat.
A breakout above USD 4,050 would be bullish,
while a break below USD 3,930 would be bearish.

XAUUSD GOLDGold price on the 4H chart is forming a bullish breakout pattern from a descending wedge, trading near the 3,997 zone. A confirmed breakout above the trendline could trigger upward momentum toward the 4,120–4,160 target area, while holding above the 3,960 support will keep the bullish outlook valid.
"Thank you for your support! If you found this idea valuable or learned something new, please consider liking and leaving a comment. I’d really appreciate hearing your feedback and thoughts."

GOLDPreferably suitable for scalping and accurate as long as you watch carefully the price action with the drawn areas.
With your likes and comments, you give me enough energy to provide the best analysis on an ongoing basis.
And if you needed any analysis that was not on the page, you can ask me with a comment or a personal message.
Enjoy Trading ;)

Gold 8H Forecast- Price will continue to sell off🔥 GOLD (XAU/USD) – 8H Forecast 🔥
Alright fam, let’s break this one down nice and clean 👇
🧠 Bias : Short-term bearish → Long-term bullish
Gold’s cooking a classic pullback setup right now — we’re in a mid-range squeeze after that massive rally and rejection from the external BSL (Buy-Side Liquidity) at the top.
📉 Technical Breakdown
Price broke structure at the top and started forming lower highs under that descending trendline.
We’ve already taken external SSL (Sell-Side Liquidity) below recent lows, showing signs of a cleanup phase.
The current compression looks like a bearish continuation pattern that could push into the 8H demand zone around $3,750 – $3,800.
That zone also aligns perfectly with the 200 EMA, making it a juicy liquidity magnet before any major reversal.
🎯 Potential Play
Short-term:
Watch for a breakdown below current structure → ride it down to that $3,750 demand area.
Ideal short confirmation = rejection at the $3,950 – $4,000 supply zone.
Medium to Long-term:
Once price taps that HTF demand, expect bulls to step back in hard.
A clean rebound from there could launch us toward $4,300 – $4,500, following the red arrow projection. 🚀
⚙️ Risk Management
Avoid early longs until the sweep and reaction from demand confirm a shift.
Keep stops tight above the 8H swing high if shorting.
Wait for structure + volume confirmation before flipping bias long.
🧩 Summary
Gold’s chilling mid-range after a big rally — expect one more dip into demand before the next bullish leg ignites. HTF structure remains intact, but we’re not done with the correction yet. Patience pays here.

Instruments for Global Trading1. Overview of Global Trading Instruments
Global trading instruments are financial assets that can be traded across international markets. They represent ownership, debt obligations, or rights to future cash flows. Their purpose is to provide liquidity, facilitate capital allocation, and enable risk management. From traditional stocks to complex derivatives and cryptocurrencies, these instruments reflect the diversity and innovation in global finance.
International investors utilize these instruments to gain exposure to various regions, sectors, and asset classes, often balancing returns against risk. For instance, a U.S. investor may hold Japanese equities, European bonds, and oil futures simultaneously to diversify globally.
2. Equities (Stocks)
Equities are one of the most popular global trading instruments. They represent ownership in a company, giving shareholders rights to profits through dividends and capital appreciation.
Types of Equities:
Common Shares: Provide voting rights and dividends.
Preferred Shares: Offer fixed dividends but usually no voting rights.
Depository Receipts: Instruments like ADRs (American Depository Receipts) and GDRs (Global Depository Receipts) allow investors to trade shares of foreign companies on domestic exchanges.
Global Equity Markets:
Leading equity markets include the New York Stock Exchange (NYSE), NASDAQ, London Stock Exchange (LSE), Tokyo Stock Exchange (TSE), and Euronext. Emerging markets such as India’s NSE and BSE, China’s Shanghai Stock Exchange, and Brazil’s B3 also play major roles.
Importance:
Equities enable companies to raise capital globally while offering investors growth potential. Through ETFs and index funds, investors can access diversified global equity portfolios.
3. Fixed Income Securities (Bonds)
Bonds are debt instruments that allow entities—governments, corporations, or institutions—to raise funds by borrowing from investors. Bondholders receive periodic interest payments (coupons) and principal repayment at maturity.
Types of Bonds:
Government Bonds: Issued by national governments (e.g., U.S. Treasuries, UK Gilts, Indian Government Securities).
Corporate Bonds: Issued by companies to finance operations or expansions.
Municipal Bonds: Issued by local governments.
Sovereign and Eurobonds: Traded internationally, often denominated in a foreign currency.
Global Bond Markets:
The bond market is much larger than the stock market in total value. Major trading hubs include the U.S. Treasury market, European government bond markets, and Asian bond markets such as Japan’s JGBs.
Role in Global Finance:
Bonds provide stability and predictable returns, making them essential for conservative investors and institutional portfolios. Global bond ETFs also allow diversification across regions and credit qualities.
4. Derivatives
Derivatives are financial instruments whose value is derived from underlying assets such as stocks, bonds, currencies, interest rates, or commodities. They are used for hedging, speculation, and arbitrage in global markets.
Types of Derivatives:
Futures: Standardized contracts to buy or sell assets at a future date and price.
Options: Provide the right, but not the obligation, to buy (call) or sell (put) an asset.
Swaps: Agreements to exchange cash flows, such as interest rate swaps or currency swaps.
Forwards: Customized contracts similar to futures but traded over-the-counter (OTC).
Global Derivatives Exchanges:
Major exchanges include the Chicago Mercantile Exchange (CME), Intercontinental Exchange (ICE), Eurex, and Singapore Exchange (SGX).
Significance:
Derivatives enhance liquidity and help manage risk. For instance, a European importer can hedge against currency fluctuations through forex futures. Similarly, investors hedge equity portfolios using index options or volatility derivatives.
5. Foreign Exchange (Forex)
The foreign exchange market is the largest and most liquid financial market in the world, with a daily trading volume exceeding $7 trillion. It involves the exchange of one currency for another, allowing international trade and investment to function smoothly.
Major Currency Pairs:
Major pairs: EUR/USD, USD/JPY, GBP/USD, USD/CHF
Minor pairs: EUR/GBP, AUD/NZD, etc.
Exotic pairs: USD/INR, USD/TRY, etc.
Participants:
Central banks, commercial banks, hedge funds, corporations, and retail traders participate in forex trading.
Instruments in Forex Trading:
Spot Transactions: Immediate exchange of currencies.
Forward Contracts: Agreements to exchange currencies at a future date.
Currency Swaps and Options: For managing exposure and speculation.
Importance:
Forex trading facilitates global commerce, cross-border investments, and monetary policy execution. It also allows investors to profit from exchange rate fluctuations.
6. Commodities
Commodities are tangible goods such as metals, energy resources, and agricultural products traded globally. Commodity markets are crucial for price discovery and risk management.
Types of Commodities:
Energy: Crude oil, natural gas, coal.
Metals: Gold, silver, copper, aluminum.
Agricultural: Wheat, coffee, sugar, soybeans.
Commodity Exchanges:
Global trading platforms include Chicago Board of Trade (CBOT), New York Mercantile Exchange (NYMEX), London Metal Exchange (LME), and Multi Commodity Exchange (MCX) in India.
Investment Methods:
Investors can trade commodities through futures contracts, ETFs, or commodity-focused mutual funds. For example, gold ETFs allow exposure without physical ownership.
Global Impact:
Commodity prices influence inflation, trade balances, and economic policies. For instance, oil price fluctuations affect energy-importing nations differently from exporters.
7. Exchange-Traded Funds (ETFs) and Mutual Funds
ETFs and mutual funds pool investor money to invest in diversified portfolios of stocks, bonds, or commodities.
ETFs: Traded on exchanges like stocks, ETFs offer liquidity and real-time pricing.
Mutual Funds: Professionally managed funds priced once daily based on net asset value (NAV).
Global ETFs track indices such as the MSCI World Index or S&P 500, giving investors exposure to multiple countries and sectors with low costs. They are among the most accessible tools for global diversification.
8. Cryptocurrencies and Digital Assets
In recent years, cryptocurrencies have emerged as a new class of global trading instruments. Digital assets like Bitcoin, Ethereum, and stablecoins operate on decentralized blockchain networks and trade 24/7 across international platforms.
Advantages: Transparency, borderless transactions, and diversification.
Risks: High volatility, regulatory uncertainty, and cybersecurity concerns.
Global Platforms: Binance, Coinbase, and Kraken facilitate crypto trading.
Institutional interest is growing, with the development of Bitcoin ETFs and central bank digital currencies (CBDCs).
9. Hybrid and Alternative Instruments
The global market also includes hybrid instruments that combine features of equity and debt, such as convertible bonds and preference shares. Additionally, real estate investment trusts (REITs) and private equity funds provide access to alternative assets beyond traditional markets.
These instruments allow investors to tailor portfolios for income, growth, or inflation protection.
10. Conclusion
Global trading instruments form the backbone of the international financial ecosystem. From stocks and bonds to currencies and commodities, they enable investors to diversify, manage risk, and seek profit across borders. The ongoing integration of financial markets, technological advancement, and innovation in products—such as ETFs and digital assets—continue to expand the range and accessibility of these instruments.
For global investors, understanding how each instrument functions, interacts, and responds to economic trends is essential. The right mix of instruments, aligned with market conditions and individual risk tolerance, helps build a balanced and resilient global portfolio—one that can thrive in the ever-evolving world of international finance.
SELLStructure Summary
Downtrend channel / wedge: Price is moving inside a narrowing structure — lower highs and lower lows.
You’ve projected one more drop to sweep the lower liquidity zones before a major bullish breakout.
The final arrow up represents a macro reversal, likely toward prior highs once the wedge breaks.
🔍 Technical Interpretation
This projection aligns with a liquidity grab / fakeout setup:
Bearish continuation phase → gold dips into deeper supports (e.g. 4030–4000 area).
Liquidity sweep below wedge → where big buyers accumulate.
Bullish reversal breakout → price explodes upward, breaking above the wedge resistance line.
📉 Short-Term Bias (Next 12–24 hrs)
Expect another leg down while staying below 4075 resistance.
Possible drop targets:
4050 (minor)
4035–4005 (major demand zone — likely bounce area).
📈 Mid-Term Bias (Next 1–3 days)
If the wedge pattern completes and you get a bullish engulfing or strong impulsive candle off the lower blue support zone → that’s your reversal confirmation.
Then the upside target would be roughly:
4120,
4150,
or even 4200+ if momentum holds.
⚙️ Trade Plan Idea (based on your diagram)
Bias Entry Zone Confirmation Targets Stop Loss
Sell (short-term) 4070–4075 Rejection candle / failure to break wedge top 4035–4005 Above 4085
Buy (swing) 4035–4005 Bullish engulfing / break above wedge 4120 → 4150 → 4200 Below 4000
✅ In summary:
Your chart structure is spot-on — it looks like gold may dip one more time to trap late sellers, then reverse hard upward once that wedge pattern plays out.

Gold is building strength in an ascending triangleHey traders! 👋
After a solid rebound from the $3,940–$3,950 support zone, Gold (XAUUSD) continues to hold a bullish structure.
Price is consolidating within an ascending triangle, showing strong buyer interest around $4,000–$4,020.
🎯 Targets:
• TP1 — $4,100
• TP2 — $4,130
As long as price stays above the support line, structure remains bullish — expecting continuation toward $4,130.
Trade with patience, follow your plan, and let profits run ✨

XAUUSD – Ascending Diagonal Structure Forming a Bullish BreakoutXAUUSD – Ascending Diagonal Structure Forming a Bullish Breakout Setup
Price action is currently developing an Ascending Diagonal (a contracting rising wedge structure), typically seen as a wave 1 or wave 5 pattern in Elliott Wave terms. In this case, the internal wave count (A)-(B)-(C)-(D)-(E) suggests the diagonal is completing, and we may now be transitioning into the impulsive breakout phase.
Key Technical Notes:
Each swing leg is overlapping, fitting the characteristics of a diagonal
Wave (D) respected the 0.618 retracement and bounced cleanly
Price is holding above the lower boundary trendline
Momentum on RSI is recovering from a bullish divergence
This combination indicates that the correction within the diagonal is likely complete, and the market is preparing to resolve upward.
Breakout Confirmation Levels:
Break above 3,997–4,010 → triggers bullish continuation
Holding above 3,963 keeps the diagonal valid
A close below 3,948 invalidates the bullish wave structure
Upside Targets After Breakout:
4,035
4,060
4,090+ (diagonal measured projection)
Bias: Bullish while price stays above 3,963
Structure Type: Ascending Ending/Leading Diagonal
Expectation: Impulse wave breakout to the upside

Gold is Ready For Bull From SupportHello Traders
In This Chart GOLD HOURLY Forex Forecast By FOREX PLANET
today Gold analysis 👆
🟢This Chart includes_ (GOLD market update)
🟢What is The Next Opportunity on GOLD Market
🟢how to Enter to the Valid Entry With Assurance Profit
This CHART is For Trader's that Want to Improve Their Technical Analysis Skills and Their Trading By Understanding How To Analyze The Market Using Multiple Timeframes and Understanding The Bigger Picture on the Charts

BUY SETUP – Smart Money Style (GOLD / USD – 30m)Analysis:
Price has formed a clean bullish structure after rejecting the demand zone (gray area). Multiple rejections confirm strong buyer presence around $3975–$3988, indicating liquidity absorption below the previous low.
Trade Plan:
Entry: Within the reaccumulation zone near $4026
Stop Loss: Below the demand base at $3975
Take Profit: Toward the upper liquidity and supply zone at $4097
Risk/Reward: ~1:3
Concept:
This setup aligns with Smart Money and FU (Failed Breakout) principles — price swept liquidity below the prior structure, tapped into unmitigated demand, and is now targeting the next high. A clean break and hold above $4053 would confirm momentum continuation to the upside.
