Shutdown Deal in Focus | Gold Prices Pause Before Key VoteGOLD | Overview
Gold steady ahead of U.S. House vote on government reopening.
Gold prices remained steady on Wednesday as investors awaited a U.S. House of Representatives vote on a deal to reopen the federal government, an outcome that could restore economic data visibility and shape expectations for future Federal Reserve rate cuts.
Technically:
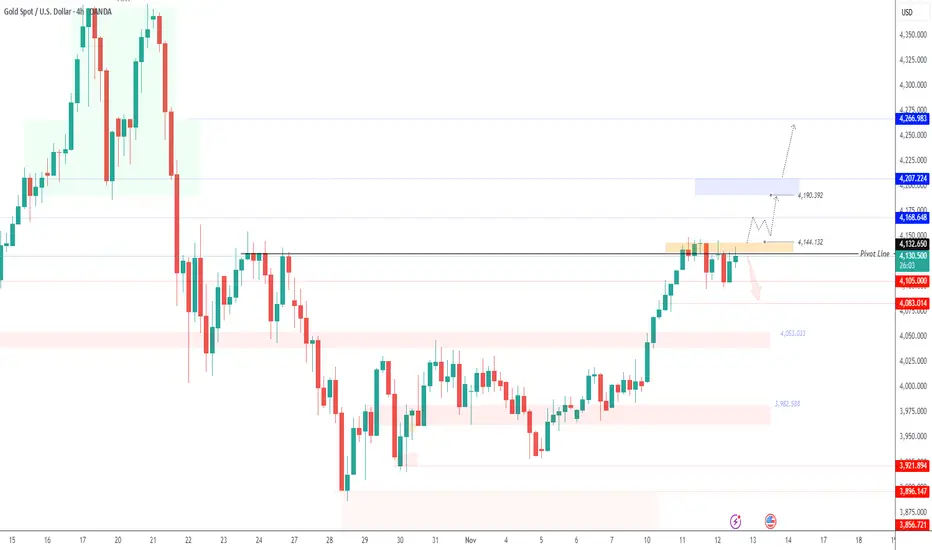
Gold maintains a bearish bias while trading below the 4132–4144 pivot zone, with downside potential toward 4104, and a break below this level could extend losses to 4083 and 4053.
However, a 1H close above 4145 would shift sentiment to bullish, targeting 4168 and 4190, with further extension possible toward 4207.
Pivot Zone: 4132 – 4144
Resistance: 4168 · 4190 · 4207
Support: 4104 · 4083 · 4053
Trade ideas
XAU/USD: Bullish Climb to 4225?FX:XAUUSD is positioning for a bullish climb on the 1-hour chart , with price respecting an upward trendline as dynamic support, bouncing from a key support zone that could fuel an upside extension toward multiple resistance levels if buyers sustain momentum. This setup offers a strategic entry amid recent volatility, with potential for breakout if volume picks up.
Entry between 4075-4105 (entry possible at current levels with strict risk management). Targets at 4180 (first) and 4225 (second), yielding a risk-reward ratio greater than 1:3 overall .Set a stop loss on a close below 4063 to limit downside exposure. 🌟 Monitor for confirmation via a strong bullish candle above entry with increasing volume, leveraging gold's safe-haven status.
Fundamentally , today's US economic data, including MBA Mortgage Applications at 13:00 UTC and Fed's Waller speech at 16:00 UTC, could sway USD strength and thus gold prices—hawkish Fed tones might cap upside, while softer data supports bulls. Recent analysis notes gold slipping below $4140 on a double top, signaling short-term pullbacks but with rebound potential testing pivotal resistance. 💡
📝 Trade Setup:
🎯 Entry Zone: 4075 – 4105 (entry possible at current levels with strict risk management)
💰 Targets:
1️⃣ 4180 – initial resistance zone
2️⃣ 4225 – secondary target / take-profit zone
❌ Stop Loss: Close below 4063
📈 Risk-to-Reward: Greater than 1:3 overall, depending on execution and scale-out strategy
What's your take on this gold move? Comment below!💡

Gold Ends Its Pullback, New Bullish Wave Targets to 4,268?Hey Realistic Traders!
"XAUUSD Correction Wave is Over, Could This Be the Next Big Move?"
Let’s dive into the technical analysis to see what the chart is really telling us.
Technical Analysis
On the daily chart, XAUUSD has rebounded once again around the EMA200, with multiple bounces confirming the strength of its broader bullish trend. Afterward, Gold consolidated within a symmetrical triangle pattern, a formation that often appears as a corrective phase within an uptrend where selling pressure gradually weakens. A breakout from this pattern typically marks the beginning of a new bullish wave.
The recent breakout was accompanied by strong momentum. A bullish Marubozu candlestick highlighted renewed buying interest, while the MACD golden cross added confirmation to the bullish bias. Together, these signals reinforce the case for a continuation of the prevailing uptrend.
In this scenario, the first upside target is located near 4,163 , aligning with a historical resistance area, where a short-term pullback may occur. If bullish momentum continues, XAUUSD could extend higher toward the second target near 4,267, just below its all-time high.
This bullish outlook remains valid as long as the price stays above 3,916. A move below that level would invalidate the setup and shift the outlook back to neutral.
Beyond technicals, Gold’s bullish outlook is also supported by a broader macro trend, as many central banks continue to reduce their U.S. dollar exposure and increase gold allocations in their reserves, adding further strength to the long-term bullish narrative.
Support the channel by engaging with the content, using the rocket button, and sharing your opinions in the comments below.
Disclaimer: "Please note that this analysis is solely for educational purposes and should not be considered a recommendation to take a long or short position on Gold."

GOLD at Cut n Reverse Area? What's next??#GOLD... market just reached at today ultimate region.
That is around 4042-43 to 4050-52
Keep close and only slbuy above that region.
NOTE: we will go for cut n reverse below that region on confirmation .
Good luck
Trade wisely

THE KOG REPORT THE KOG REPORT:
In last week’s KOG Report we wanted to stick to a similar plan from the week prior, looking for price to attempt either the high to short it again, or, for price to attempt to break the lower box and then give us the opportunity to long again. We had to switch to intra-day trading during the week due to the ranging and as usual, the indicators worked well giving us some good trades and we near enough got what we wanted from the KOG report analysis and the red box targets published.
So, what can we expect in the week ahead?
Potential for this range to continue during the first half of the week with the immediate resistance above at 4006-10 which will need to break in order to target the 4030 level which is what we’re looking for. For this to happen, support 3990 needs to hold us up and if we can push upside it’s that 4030 level we want to keep an eye on. Rejection there can again lead to another swoop of the lower regions but, we need to keep in mind that red box below. That is the key level of defence for the early part of the week and will need to break!
The indicators are suggesting lower at the moment but we need more confirmation and we also need to see if they fill the void left over above from Friday.
In our opinion, another choppy week ahead, more ranging and whipsawing while we accumulate and await that clear confirmation of direction. Until then, it’s level to level and intra-day Red box trading for us.
RED BOXES:
BREAK above 4004 for 4010, 4014 and 4030 in extension of the move
BREAK below 3990 for 3985, 3979, 3970 and 3965 in extension of the move
Many of you have asked what the “Bubbles/circles” are on the chart! These are the hot spots we have been sharing with you that work well as RIPs! We share the monthly results and daily hot spots and I’m sure our traders will agree, they are powerful!
Please do support us by hitting the like button, leaving a comment, and giving us a follow. We’ve been doing this for a long time now providing traders with in-depth free analysis on Gold, so your likes and comments are very much appreciated.
As always, trade safe.
KOG

Once again, perfectly capturing gold trading opportunitiesIn yesterday's gold strategy, we emphasized the rebound correction at the 4000 level and the short position at 4080, and the market action has fully materialized! Congratulations to those who followed our advice.Gold is currently dominated by bears, and the overall structure remains weak. Short-term support levels to watch are the 4040-4030 area and strong support around 4000. Resistance remains concentrated in the 4080-4100 area. If the price rebounds to this area and fails to break through, short positions can still be considered. In short, the core logic for today remains unchanged: a weak, downward-trending market. Trading should focus on the aforementioned support and resistance levels, patiently waiting and positioning. The slower pace of the market movement means a longer trading cycle, thus requiring more patience in executing each trade. Until the trend changes, our overall strategy remains to primarily short at higher levels during rebounds, supplemented by buying on dips, proceeding steadily and following the trend.

Bullish Gold - Testing $4200 very soonWe brokes previous sell zones, and now they're our new demand zones.
The resistance levels upcoming are very weak, and I expect gold to pass through them easily.
Overall very bullish

Gold Key Levels (3900-4200)These are the Gold key levels which I’ll be using for trading.
Here’s how I trade these levels:
- Close above a level → Buy setup
When a candle closes clearly above a level, it confirms bullish momentum and I look to enter long immediately after the close.
- Close below a level → Sell setup
A confirmed candle close below support signals bearish strength, and I enter short right after the close.
- Rejection from a level → Opposite trade
If price shows a strong rejection from a level, I trade in the opposite direction - rejection from resistance = sell setup, rejection from support = buy setup.
These levels works well for both day trading (using 1H candles) and scalping (using 15M or lower timeframes). It keeps trading simple, just reactions to market behaviour.

An Exciting Monday!
Gold continued its upward climb in late Asian trading on Monday (November 10th), currently trading around $4080, a surge of over $80 on the day. Concerns about uncertainty surrounding the US economic outlook provided upward momentum for gold. Traders increased their bets on a Federal Reserve rate cut after weak US private employment data and a pessimistic University of Michigan (UoM) consumer sentiment survey. Lower interest rates could reduce the opportunity cost of holding gold, thus supporting the non-yielding precious metal. On the other hand, signs that the US government shutdown may be ending could weaken safe-haven assets like gold. US senators will vote on Monday on an agreement that could end the longest government shutdown in history. Furthermore, easing trade tensions between the world's two largest economies—the US and China—could also weigh on gold prices in the short term. Traders will be closely watching the US October Consumer Price Index (CPI) inflation data to be released later on Thursday. The market expects the overall CPI to rise 0.2% month-on-month in October, while the core CPI is expected to rise 0.3% year-on-year. Friday's US retail sales data (commonly known as "the terror data") will be the focus.
Traders are awaiting updates on when the unprecedented US government shutdown will end, while economic concerns continue to intensify.
Bloomberg reported on Monday that the US Senate took a crucial step towards reopening the government after a group of moderate Democrats broke partisan lines and voted to end the record-breaking shutdown. On Sunday evening local time, the Senate passed a procedural motion by a vote of 60 to 40, advancing the bill. The US Senate is in recess until Monday, and a final vote has not yet been scheduled. Despite overall market optimism, investors remain cautious because the revised bill still needs to be passed by the House of Representatives and sent to President Trump for his signature, a process that could take several days. Coupled with the consequences of the record-breaking government shutdown and growing concerns about the US economy, these factors continue to support gold, a traditional store of value. Looking ahead, gold price movements will likely depend on news regarding the US government shutdown and the release of previously missed economic data. In the meantime, market sentiment and expectations of a Federal Reserve rate cut will continue to provide some driving factors for gold trading.
Gold Technical Analysis: From a daily chart perspective, since the decline and correction at the end of October, market sentiment has stabilized considerably. Entering November, the market has been undergoing continuous consolidation, but the downside potential hasn't expanded. During the Asian session today, gold oscillated higher, currently reaching a high above 4079. The short-term price is now above the 5-day and 10-day moving averages, so early this week, gold may test the 20-day moving average at 4100 due to sentiment-driven factors. The hourly chart shows a renewed hold above the upward trendline support, indicating a break in the short-term stalemate and bullish dominance, suggesting further upward movement. The upside target is likely to be around 4100. During the European session, a pullback to 4050 could present a buying opportunity.
The technical picture clearly shows a bullish trend. The daily chart shows a clear bottoming pattern, and the consecutive positive days confirm the possibility of further gains. The breakout above the Bollinger Middle Band resistance this week further strengthens the bullish momentum, with a further target of 4300. Therefore, the upside potential appears significant. The 4-hour chart shows an upward breakout. Today, a pullback to the 4050 level is a key support level to watch. If gold finds support in this area, then continue to buy. Gold is expected to continue its upward trend in the short term, with key resistance around 4100. However, the main trend for gold is likely to be a volatile upward rebound, so patiently wait for pullback opportunities. Key resistance levels to watch in the short term are 4095-4100, and key support levels are 4050-4045. Traders must follow the trend closely. Manage your position size and stop-loss orders carefully, strictly set stop-loss orders, and never hold losing positions.
Short position strategy: Sell gold in batches around 4095-4100 with 20% of your position, targeting 4080-4070, with a further target of 4050 if it breaks through.
Long position strategy: Buy gold in batches around 4050-4055 with 20% of your position, targeting 4080-4090, with a further target of 4100 if it breaks through.

Gold Retracement ideaXAUUSD after a huge 3500 B/O, is it finally time for a pull back? Short positions can be taken targeting lower fib levels with proper risk management. Break of ATH invalidates any further pull backs. This is only market speculation and should not be considered as financial advise

GOLD XAUUSD GOLD ,newyork session rejected the sell at 4038-4040 floor ,a previous broken supply roof now a demand floor and on technical could retest 4100 coming week.
13th November during newyork session rejected the 4243-4244 zone ,the technical analysis hinged on daily double top structure break of neckline and buyers return to retest a broken neckline at 4243-4044 and dropped to 4146-4150 zone during the newyork session ,on 4hrs using the line chart we have a strong psychological horizontal structure and another break and retest to close newyork session on another 200pips buy trigger.
break and close 4146-4150 was another bearish correction into 4036-4040.
break and close will challenge another key low at 3889-3885.5 strong psychological demand floor on 4hr TF.
GOOD LUCK AND SEE YOU AT THE TOP.

Gold buy NY open buy setup Gold has broken the 200 EMA with a huge FVG .
How to trade it ......
#1 wait for price to hit 4100 ita the closest psychological number
#2 look for pin bar or engulfing candle to close above 4100 with high volume
Note : if price close below the FVG with full bear candle do not jump in the buy wait for price to close back above 4100 and look for the same confirmation above 👆


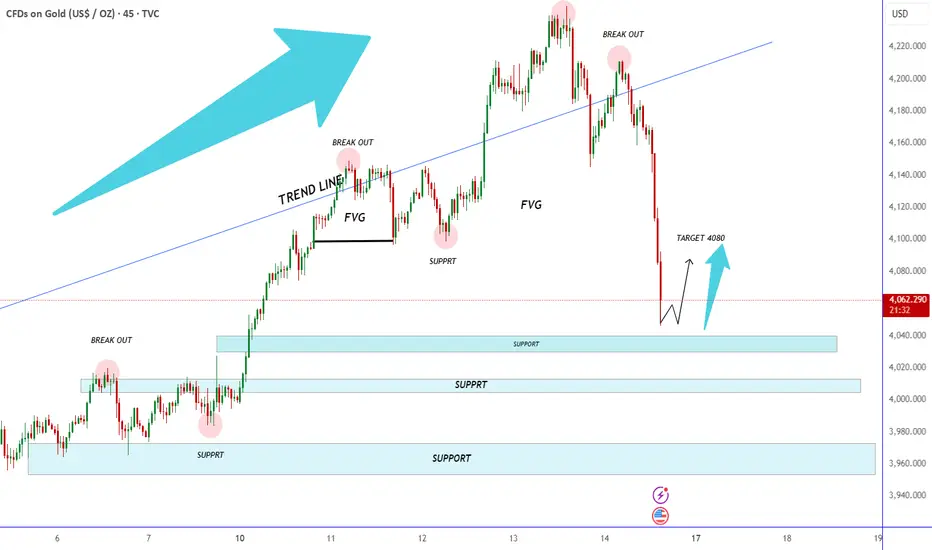
“XAUUSD Pullback to Support with 4080 Target”“Gold Price Analysis: After a sharp drop into major support, price is expected to react from the trendline zone with a potential bounce toward the 4080 target. Chart highlights breakouts, FVGs, trendline structure, and key support levels.”
The system is engineered for you to lose!Hey @TradingView Community
I want to be real with you.
Most traders don’t lose because they are bad at trading.
They lose because the whole system is built to make them lose.
Your broker wants you to believe they are helping you.
But in reality, they make money when you lose money (The B-Book Module).
Yes of course not all the brokers, but the majority.
It’s like a casino. The house always wins.
They want you to take big risks.
They want you to use crazy leverage so they can collect faster when your trade goes wrong.
And when it does, you blame yourself instead of the system.
You keep trying harder, but the game is not made for you to win.
Here is what I want you to know:
You don’t need to trade more.
You don’t need to chase every candle.
You need a system that is built to protect you, not your broker.
So in short, you have to have a proven trading system in place and a trading plan to follow every single time you take a trade.
That is what we created, a clear trading system that helps you focus on a few strong trades every week.
No guessing, no stress, no gambling.
And don't forget WTW 4 Golden rules!
1) Do not jump in
2) Do not over risk/trade
3) Do not trade without Stop Loss
4) Never ever add to a losing position!
Take with care,
Alain M(Coach)
WTW Team
FX:XAUUSD NYSE:DOW NASDAQ:NDX SP:SPX

HOW MANY BUYER TRAPS BEFORE NEW ATH GOLD ?📈 Analysis of Gold Trading Plan (SMC/Order Flow)
🔍 Current Market Context
Structure: The market has shown a strong bullish trend, marked by a Break of Structure (BOS) and a Liquidity Done Sweep around the $4,145 price level.
Liquidity:
The market performed a "First Sweep Here" (initial liquidity grab) after the rally, signaling a readiness for a correction.
The main liquidity target for the upward move (Big Boy Liquidity) is set above the $4,240 level.
Recent Price Action: After hitting the peak and the initial sweep, the price experienced a sharp decline, creating a correction zone.
🎯 Proposed Trading Plan
The plan focuses on two main scenarios: a Short-term Sell (SELL SCALP) and a Primary Buy (BUY GOLD).
1. Primary Buy Scenario (BUY GOLD)
This is the main scenario to continue the bullish trend (Long).
Entry Zone: BUY GOLD 4126 - 4124.
This zone is likely a critical Order Block or an unmitigated Demand Zone, positioned just below the previous liquidity sweep and acting as a strong support/Displaced/Fair Value Gap (FVG) area.
Stop Loss (SL): SL 4120.
This stop-loss level protects the long position, placed just below the key entry zone to avoid being shaken out by minor liquidity grabs.
The indicated Stoploss Buyer area (around $4,145 - $4,150) suggests the price drop might aim to sweep prior buyers' liquidity before bouncing from the $4,124 - $4,126 zone.
Take Profit (TP): The ultimate target is the Liquidity Limit Big Boy (above $4,240).
2. Short-term Sell Scenario (SELL SCALP)
This is a short-term trading opportunity (Scalping) during the corrective move.
Entry Zone: SELL SCALP 4208 - 4210.
This area likely represents a Supply Zone or a bearish Order Block following the sharp drop, where hidden selling pressure resides.
Stop Loss (SL): SL 4212.
This is a very tight stop loss, placed just above the entry zone.
Take Profit (TP): The target is the BUY GOLD 4126 - 4124 area (the primary buy entry zone).
⚠️ Key Considerations
Timeline: This plan requires the price to move according to the predicted scenario (drop to the buy zone before rallying).
Confirmation: Traders should wait for structural confirmation on a lower timeframe (e.g., a Change of Character - CHoCH or a bullish BOS) at the 4126 - 4124 buy zone before entering the trade to improve the probability of success.
Risk Management: Using the suggested Stop Loss (SL) is mandatory for capital protection.

What's the outlook for gold next week? Strategy Update
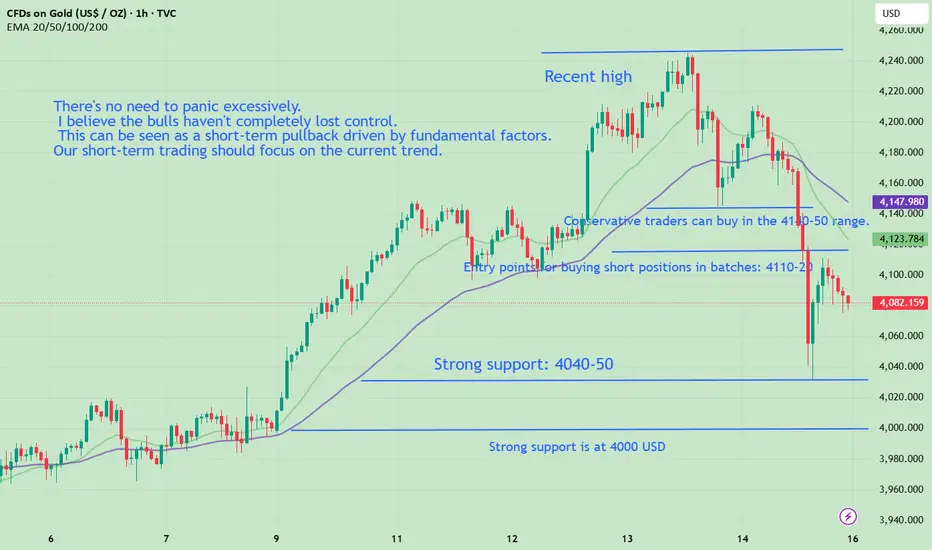
After Friday's sharp drop, gold may rebound at the beginning of the week, followed by a test of its strength. From a technical analysis perspective, the daily chart closed bearish, indicating significant downward pressure and strong short-term upward momentum. Monday's market is likely to remain bearish. Gold's rebound to around $4110-$4120 is a key resistance zone from the previous period and near the high of Thursday morning's rebound, making it highly likely to encounter resistance. Aggressive traders could consider a small short position, while more conservative traders should wait for a rebound to the $4140-$4150 range before entering short positions, as this is the upper edge of the previous consolidation range. Based on the current trend, key support is between $4050 and $40, with strong support at $4000. The previous low is at $3990. If this support level holds, the market may continue to consolidate. A break below this support level could weaken bullish sentiment.
Despite Friday's significant market volatility, our trading went very smoothly. I focus on short-term trading and clear market analysis. In short-term trading, there are no markets that rise or fall forever, only optimal entry points at specific moments. Finding the rhythm and following the trend is the essence of trading. On Friday, after the Asian market opened, we shorted at 4209 and then sold at 4190. Many friends questioned this, but I want to say, don't regret selling too early. We set profit targets and risk controls for every trade. Once the profit target was reached, we sold. After all, technical analysis becomes ineffective in the face of news. We should be grateful that we maintained four profitable short-term trades during this major market move, including both long and short positions, instead of missing the entire downtrend. You can check the historical recommendations to verify their accuracy. Although I am a professional trader, I don't need to strive to buy at the lowest and sell at the highest point on every trade. After all, I'm just a trader, not God! So we need to adjust our mindset and only earn the profits we deserve. Overall, this week's operations were quite profitable, and we will continue to work hard next week.
There's no need to panic excessively. I believe the bulls haven't completely lost control; this can be seen as a short-term pullback driven by fundamental factors. The possibility of a medium- to long-term peak in gold is unlikely; the overall bullish trend in the long term remains unchanged. The long-term bullish outlook persists because current external factors, such as geopolitical tensions, tariffs and trade tensions, the Fed's halt to tapering, and continued central bank gold purchases, do not support a medium-term peak in gold. Although the subsequent release of data following the US government shutdown may be mixed, potentially delaying the Fed's rate cuts, the overall trend of de-dollarization will not change. The current decline is merely a correction within the medium-term bullish trend.
This is just a general pre-market analysis; it will be updated based on actual market movements after the market opens. If you are unsure about precise trading strategies, try my method: first, use a small position to test the market, then add to your position during pullbacks. This way, you won't miss any opportunities. If you are truly unsure when, where, and how to trade, let's work together to flexibly and steadily pursue greater returns in the ever-changing market!
Gold bulls launch a strong counterattack!After a prolonged period of narrow-range fluctuations, gold reached a high of around 4120 before pulling back. Currently, the overall structure remains bullish. Market conditions are constantly changing, and stubbornness is the worst thing in trading. Neither die-hard bulls nor die-hard bears can last in the face of the market. We should follow the trend; this is the fundamental logic of professional trading. Don't fight the market; just follow the trend. Currently, the bulls still hold the initiative in gold. Short-term pullbacks are more about consolidation than a trend reversal. As long as the upward momentum continues, pullbacks are opportunities, not risks. The key focus going forward is the pullback performance in the 4090-4070 area. As long as it holds, this area remains a good place to buy on dips. The market always punishes those who defy it. Hitting a wall is a lesson; understanding the direction is growth. Following the trend is the easiest and most stable way to trade. Continue to follow the rhythm; opportunities are for those who choose the right direction.

Gold , Butterfly ?As you can see on chart
1 - brocken trend
2 - Now retesting
3 - Butterfly pattern
4 - FVG selling Zone
If that so . and 4255 - 4270 hold , we may break last support and fall down
better to divide your entry from now untill 4250 then hold and wait
Good luck

Is it Black Friday? No need to panic, strategy updateGold has closed. During the latter half of the US session, influenced by news, it fell to around 4180, finding support and reaching a high of 4211. Gold prices then fell sharply again, briefly dropping to 4145 USD before slightly recovering. Having already risen over 200 points this week, this upward move was too rapid, and the consolidation period was too short, resulting in weak upward momentum. While reaching 4250 is only a matter of time, short-term trading requires careful attention to timing. The excessive pullback during the US session has led to a correction, potentially breaking the current uptrend. Therefore, a cautious approach is advised, avoiding blindly chasing the upward trend and patiently waiting for a stabilizing signal after a pullback. This is currently a more prudent and cost-effective choice. Following market rhythm and acting according to the trend is the core principle of investing. From the current structure, the support area to watch is the 4130-40 range. Resistance is at 4175-85, and the closing price is around 4170. Will this be a Black Friday? Don't panic. Our operations will be updated based on the opening market trend and news. Just stay tuned.
I focus solely on short-term trading and clear market analysis. In short-term trading, there is no market that goes up or down forever, only the right entry point at any given moment. Find the rhythm and follow the trend. That's the essence of trading. We made 5 trades this trading day, including both long and short positions, all of which were sold at a profit. You can check the historical recommendations to verify their accuracy. For example, we sold a long position at 4193 at 4202, which rose to a high of 4211. Don't regret selling too early at that point. We have our own profit targets and risk management for each trade. Once the profit target is reached, we sell. Although I am a professional trader, it's not necessary for me to buy at the lowest and sell at the highest point in every trade. After all, I'm just a trader; I don't have God's perspective! Therefore, we need to adjust our mindset, only earning what's rightfully ours. Profit and loss are part of trading; focus on overall returns.
If you can't execute trades precisely, try the method I teach you: first, use a small position to test the market, then add to your position during pullbacks or rallies. This way, you won't miss any opportunities. If you're truly unsure when, where, and how to proceed, let's work together to flexibly and steadily pursue greater returns in the ever-changing market!

XAU/USD | Double Bottom → Breakout Retest → Clear Path for Bulls🧭 Market Overview
Gold has transitioned beautifully from a bearish liquidation phase into a clean bullish breakout structure.
This chart walks through each stage of the cycle — Accumulation → Breakout → Retest → Expansion — all clearly mapped for educational insight.
After sellers exhausted around $3,940–$3,960, Gold printed a textbook Double Bottom reversal.
Once price broke and closed above the neckline at $4,120, the structure flipped bullish — and now we’re in the Breakout Retesting phase.
🧩 Step-by-Step Breakdown of Chart Markings
🔶 1️⃣ “Clear Path for Bulls” – Liquidity Void Zone
The “Clear Path for Bulls” zone highlights a previous inefficient drop — an area with minimal resistance.
When price re-enters this void, momentum often accelerates, creating strong bullish continuation.
This is why above $4,120, price faces little friction until the next supply zone.
🟩 2️⃣ “Double Bottom” – Structure Base
Formed near $3,940–$3,960, this marks the liquidity sweep and accumulation base.
The second bottom confirms buyer presence and sets the neckline at $4,120.
That neckline is now acting as support, exactly where price is retesting today.
Below it? Only a liquidity pocket — thin structure, fast moves.
⚙️ 3️⃣ “Breakout Retesting” – Confirmation Phase
The “Breakout Retesting” zone illustrates a healthy technical pullback.
This retest confirms structure integrity, shakes out weak hands, and attracts institutional liquidity.
As long as $4,100–$4,120 holds, bulls maintain full control.
🔴 4️⃣ “Invalidation Point” – Structural Risk Line
The red-labeled “Invalidation Point” defines where the bullish thesis fails: a 4H close below $4,080.
This is the cutoff level protecting traders from a failed breakout.
The red projection (−4.11%, −168 pts) visualizes the probable liquidity sweep back toward $3,940.
🟢 5️⃣ “215.25 (5.20%) → 21,525” – Bullish Projection
This is the measured-move projection from the Double Bottom’s height.
It targets a 5.20% upside move into $4,360–$4,380, which aligns with the next liquidity/supply zone.
Simple, technical, and logical — structure-based profit zone.
⚫ 6️⃣ “−168.31 (−4.11%)” – Bearish Counterpath
A failed retest would likely send price down into the liquidity pocket again.
This highlights the importance of invalidation — clear risk awareness before execution.
Great visual lesson on maintaining reward-to-risk balance.
🟩 Bullish Case
✅ Hold above $4,120 confirms breakout integrity
🎯 Target 1 → $4,280
🎯 Target 2 → $4,360–$4,380
⚡ “Clear Path for Bulls” offers minimal resistance
🟥 Bearish Case
⚠️ Close below $4,080 invalidates breakout
📉 Expect liquidity grab toward $3,940–$3,960
💧 Reaccumulation likely before next attempt higher
🧠 Educational Insights
Structure builds sentiment — price respects zones, not opinions.
Breakout Retests validate structure; they’re not reversals.
Invalidation Points = professional discipline.
Measured Moves project liquidity targets, not guarantees.
Liquidity Voids show potential acceleration zones — trade them with structure.
💬 Trade Summary
Bias Above / Below Targets Risk Structure
🟩 Bullish Above $4,120 $4,280 → $4,380 Below $4,080 Double Bottom + Retest
🟥 Bearish Below $4,080 $3,940 Invalidation Liquidity Sweep Setup
🧩 Final Thoughts
Gold is now retesting its breakout structure — a key moment for confirmation.
Holding $4,120 keeps bulls in command toward $4,380, while losing it could trigger a −4% liquidity sweep before the next buildup.
This move is a clean visual example of:
Liquidity → Structure → Confirmation → Expansion
Stay patient, stay structured, and trade confirmations — not assumptions. 📚✨
📢 Community Discussion
What’s your bias on Gold here?
🟩 Holding above $4,120 for the bullish continuation, or 🟥 expecting a retest failure toward $3,940?
Share your thoughts 👇

XAUUSD H4 Market OutlookGold Outlook: Market Flashes Early Reversal Signals
Weekly Overview
- Gold closed the week at $4085.83, up 2.11%, but the rally is already showing cracks. Price failed to stay above the critical 50% monthly retracement at $4133.95, which instantly weakens the bullish narrative. Add the sharp rejection from $4245.20, and you’re looking at a market that’s losing follow-through right where buyers needed to dominate.
Fundamentals
- The 43-day U.S. government shutdown left holes in key economic data; CPI and NFP may never be published, so the Fed is flying partially blind into the December meeting. That uncertainty alone distorts every macro-driven asset, including gold.
- The Michigan Index is down 30% YoY, scraping near 1978-level pessimism. ADP shows job cuts averaging 11,000/week. Confidence is fragile, and the Fed remains split after two rate cuts this year.
Technical Breakdown
- Gold’s biggest job this week was simple: hold above $4133.95. It didn’t. That failure keeps that level as immediate overhead resistance.
Bullish Requirements
- Reclaim $4133.95
- Break and hold above $4245.20
- Only then does a push toward the record high at $4381.44 become realistic
Bearish Threats
- Last week’s rejection from $4245.20 is the textbook starting to point if buyers don’t return fast, sellers have clean downside targets:
- $3886.46 (minor swing low)
- $3846.50 → $3720.25 (retracement zone)
- Momentum already shows signs of fatigue.
Forward Bias
- The long-term trend is still up, but the weekly structure has shifted from “confident rally” to “prove it or lose it.”
- Until price decisively reclaims $4133.95, expect choppy action with a downside lean; especially if Fed minutes or Michigan sentiment reinforce uncertainty instead of relief.

GOLD ( XAUUSD ) Buying Trade idea From the Support LevelHello Traders
In This Chart GOLD HOURLY Forex Forecast By FOREX PLANET
today Gold analysis 👆
🟢This Chart includes_ (GOLD market update)
🟢What is The Next Opportunity on GOLD Market
🟢how to Enter to the Valid Entry With Assurance Profit
This CHART is For Trader's that Want to Improve Their Technical Analysis Skills and Their Trading By Understanding How To Analyze The Market Using Multiple Timeframes and Understanding The Bigger Picture on the Charts
