Gold to 3700Gold price currently forming a right angle triangle prepping for a drop as it rise to retest 4040 area.
Short entry: 4040
TP: 3705
SL: 4070
set your TP and Sl according to your Margin size
Trade ideas

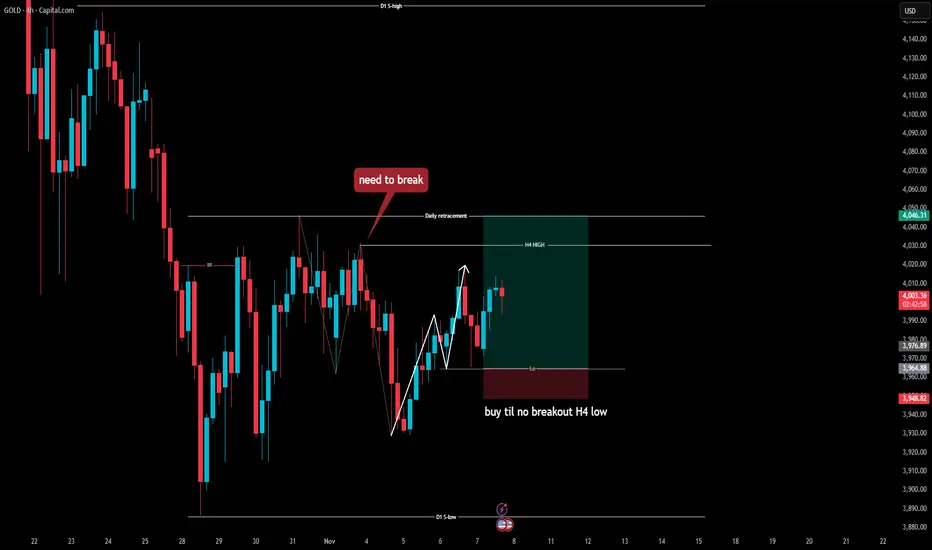
GOLD SWING SETUPGold is currently showing indecision on the H4 timeframe.
Within its internal structure, price is forming an uptrend, suggesting a possible reversal from the previous downtrend pattern.
If momentum continues, gold may break the reversal structure and align with the major uptrend.
The target area for this move is around 4050, where a new major uptrend formation could develop.
OUTLOOK XAUUSD 1H Analysis (6th November 2025)This just a trade Idea not a financial advise
BUY/SELL SCENARIOS:
BUYS:
1) Body Candle Close above the 3990.36 level.
2) Retest the failed 1h Bearish OB at the 3990.36 level.
3) Create a 3/5m Bullish Engulfing Candle to capitalize on BUYS towards the 4046.50 level.
SELLS:
1) Retest the 1h Bearish OB at the 3979.33 level.
2) Create a 3/5m Bearish CHOCH with a body candle close (with a FVG)
3)Retest the 3/5m Bearish CHOCH Level to capitalize on SELLS towards the 3915.30 level.
Trade smart, Trade safe and trade according to your trading plans. Cheers

Gold – Technical Outlook🔴 Bearish Scenario (Downtrend)
Pivot Level: 4000
If price trades below 4000, continuation to the downside is expected.
🎯 First target: 3930 (support zone)
If 3930 breaks → full bearish extension towards:
🎯 Next targets: 3895 – 3865
🟢 Bullish Scenario (Uptrend)
If price breaks and holds above 4000, upside momentum will strengthen.
🎯 First target: 4030 (resistance zone)
If 4030 breaks and holds on the 1H or 4H timeframe → strong bullish continuation towards:
🎯 Next targets: 4081 – 4133

GOLD | Gains Capped by Trade Uncertainty and Fed ExpectationsGOLD – MARKET OUTLOOK | Gains Capped by Trade Uncertainty and Fed Expectations
Gold futures rose slightly but gains remain limited as investors assess the U.S.–China trade deal and potential Fed rate cuts.
Market sentiment stays cautious, with traders awaiting key U.S. data for direction.
Below 4,025: Bearish bias toward 3,982 → 3,960 → 3,921.
Above 4,025: Bullish recovery toward 4,053 → 4,104.
Pivot: 4,025
Support: 3,982 · 3,960 · 3,921
Resistance: 4,053 · 4,080 · 4,104
Gold remains bearish below 4,025, but a confirmed break above 4,053 could shift sentiment to bullish in the near term.
PREVIOUS IDEA:

keeping an eye on the 4050–4051 area for a potential buying oppoGold is pulling back after a strong move up, and I’m keeping an eye on the 4050–4051 area for a potential buying opportunity.
This zone lines up with the previous wave (iv) correction and acts as a solid support level. It also falls right around the 0.382–0.5 Fibonacci retracement of the last impulse move — a typical area where buyers tend to step in.
As long as price stays above 4040, the bullish structure remains valid. A bounce from this zone could mark the beginning of wave (v), with upside potential toward 4100 and beyond.
My plan:
Buy zone: 4050–4051
Stop-loss: below 4040
Targets: 4085 / 4110
I’m waiting for confirmation before entering, but this area looks promising for a short-term continuation of the uptrend.

Next week's gold trading strategyThe current battle between bulls and bears at the $4,000 mark is essentially a balance between "expectation of easing" and "policy divergence + profit selling pressure". There is no clear single-direction trend in the short term. The core of trading lies in "abandoning preconceptions and following signals".
It is recommended that investors focus on "confirmation breakout trading", holding a light position during range-bound periods and selling high and buying low with caution. They must absolutely avoid heavy bets on direction; they should closely monitor the signals of an upward breakthrough at $4,027 and a downward break below $3,984. Once the direction is confirmed, they should follow the trend and strictly execute stop-loss orders.
In the short term, if the $4,027 level can be broken through and held, it will open up an upward space of 15-30 dollars; if it falls below $3,984, it may test the support range of $3,963 - $3,950; if it remains in a range-bound state, it is recommended to reduce trading frequency and wait for clearer signals. As an ultra-short-term trade, one needs to maintain a "quick entry and quick exit" rhythm, not getting bogged down in long-term logic, and focus on short-term signals and changes in capital flow.
Next week's gold trading strategy
buy:3990-4000
tp:4020-4030
sl:3975

I WILL GO SHORT FOR GOLD , HOW ABOUT YOU GUYS ? I expect XAAUSD to test the zone based on my CMP (Current Market Price) technique — a method I use to identify potential reaction areas and key levels from a technical perspective.
🔍 Technical Outlook:
Price is approaching a CMP zone that may act as a reaction point.
I’ll be monitoring closely for a bearish engulfing pattern as confirmation before entering a trade.
🎯 Trade Plan:
Stop Loss: 50 pips
Take Profit: 1:2 or 1:3 R:R
Setup Type: CMP Reaction + Engulfing Confirmation
⚠️ Disclaimer:
This analysis reflects my personal technical view and is not financial advice. Always do your own research before taking any trade.

The correction is over; buy gold on pullbacks.#XAUUSD TVC:GOLD OANDA:XAUUSD
With the White House website indicating the ongoing US government shutdown, the normal release of key data such as ADP and NFP may be affected. The news briefly boosted gold prices, leading to a technical rebound in Asian trading.
From the daily chart, the short-term resistance is still around 3980-4000, which is also where the 4H middle line is located. For the bulls to make a full comeback, they need to break through this resistance range and hold above 4000. The current slow and volatile upward trend in gold prices indicates that the bulls still have room to maneuver. In the short term, one can try to continue to be bullish on gold by using the middle line of the hourly chart as a defense. Conservative traders can wait for a pullback to 3970-3955 to try to go long on gold.

Gold Trade Set Up Nov 5 2025Price has pulled back up during the Asia session from yesterdays drop. On the 4h we are still bearish but on the 1h and 15m we are making HH/HL. We got a 15m supply price is close to testing so i want to see price either respect it and make internal 5m bearish structure to go lower to take out SSL/London lows or break and close above it to continue higher to PDH

Report 11/11/25Report summery
Markets just got a two-handed shove: politically, the election results plus a Supreme Court that sounded wary about the legal basis for most of the administration’s tariffs; corporately, Tesla shareholders rewarding the “robotaxi + Optimus” optionality with a record package that anchors the market’s physical-AI story. In the very near term, that mix argues for lower equity risk appetite at the index level when policy uncertainty flares, stickier rate-cut expectations if the Court crimps tariff revenue, a range-bound to firmer USD on growth and rate differentials, and a supported crude tape as OPEC+ keeps output expansion on pause. Barron’s summed the weekly tape: Dow −1.2%, S&P −1.6%, Nasdaq −3.0% into the election/Court week, with oil buoyed as OPEC+ paused planned increases and the shutdown dragged on; AI positioning was a headwind for some names.
On Nov. 11, the Dollar Index printed ~96.9 and U.S. equities bounced from the week’s slump, underscoring that this is a path dependency story, each headline toggles the balance between “tariff revenue supports fiscal and dovish Fed” versus “legal curbs force policy workarounds and wider deficits.” Yields have been skittish for precisely this reason.
What just changed and why it’s material
Voters swung blue in key off-year races (NYC, NJ, VA, CA), a symbolic check on the White House, while conservative justices questioned whether tariffs belong with Congress rather than the presidency under the emergency-powers rubric. That combination narrows the unilateral policy lane that markets had grown used to, even if near-term asset prices still lean on AI enthusiasm and hopes of Fed cuts.
At the same time, the shutdown’s persistence and data blackouts (CPI/PPI delayed) reduce near-term macro visibility; the FAA even trimmed air traffic by ~10% due to staffing constraints. This keeps volatility in play around each incremental political headline.
Finally, shareholders approved a $1T incentive for Musk, a shot of confidence in Tesla’s “physical AI” thesis even as today’s revenue mix remains car-heavy, locking in a market narrative where robotaxis and humanoid robots carry an outsized share of implied valuation.
Policy mechanics and the market’s decision tree
Tariffs & the Court. If the Court ultimately limits the current legal basis, the administration can try to pivot to other authorities to keep levies flowing, but there will likely be a gap risk: refunds on existing levies or slower collections would widen near-term funding needs, affect Treasury supply expectations, and complicate the deficit path that officials have been using to justify rate-cut rhetoric. Even some market participants who think the strategy will be re-patched concede it would put the White House on the back foot and chill counterparties’ willingness to concede in trade talks.
Shutdown & fiscal optics. The Senate moved a package to end the shutdown, but intraparty backlash shows how fragile the coalition is; until resolution, the absence of data and incremental operational frictions (SNAP/payment delays risk, FAA constraints) raise the odds of episodic growth scares without giving the Fed clean data.
Oil policy backdrop. OPEC+ pausing planned output increases props up crude into year-end, interacting with any tariff- or shutdown-driven supply chain noise. That’s important for breakevens and for the “Fed-cuts-soon” narrative.
Asset-by-asset implications
XAUUSD (gold). In the near term, gold remains a buy-the-dips hedge on policy volatility: Court-driven tariff uncertainty and shutdown-driven data gaps nudge rate-cut odds around the edges and keep real-yield volatility elevated, a classic recipe for tactical gold bids on risk-off days. If the Court curtails tariff revenue and the market leans to earlier cuts, that supports gold through lower real rates; if the administration swiftly re-routes tariffs and the dollar firms, gold consolidates in a broad range. The recent bond-market “yips” around tariff prospects are the tell.
S&P 500 / Dow Jones. Index-level path is choppy: earnings leadership is narrowing again and AI-capex “asset-heavy” pivots create P&L drag in some megacaps, while the shutdown and tariff newsflow toggle multiples. Tesla’s vote is bullish for the AI/automation complex beta but doesn’t change aggregates if rates wobble. Near term, I favor quality large-cap growth with cash-flow resilience plus defensives until shutdown clarity and the Court’s posture firm up. Barron’s captured last week’s risk-off and the OPEC+ oil tailwind; Monday’s equity bounce illustrates the headline-sensitivity regime we’re in.
USDJPY & DXY. The dollar stays two-way but supported on growth/rate differentials while U.S. policy is seen as net-stimulative and the Fed isn’t firmly committed to a December cut. If tariffs are curtailed and deficit optics worsen, the market could fade the USD on lower real yields, but the move likely waits for clean data once the shutdown ends. The Dollar Index hovering near the high-90s underscores that this isn’t a collapse scenario; it’s a chop.
Crude Oil. With OPEC+ pausing increases, balances tighten modestly into year-end. China’s reserve behavior and sanction dynamics provide an underlying floor. In a risk-off tape on U.S. politics, crude may dip on growth fears, but policy-put supply argues for buying weakness unless global demand data sharply deteriorate.
Strategic forecasts
Base case (55%). Shutdown is resolved with a thin deal; the Court issues an opinion that narrows but does not nuke tariff usage, prompting legal workarounds that preserve most revenue with a lag. Equities grind with factor rotations; the dollar ranges; crude stays supported; gold holds a high-beta hedge role. Fed communication turns a bit more data-dependent into year-end given the data blackout.
Bullish risk (25%). Quick shutdown end plus an opinion that validates sufficient tariff authority to keep revenue intact; Treasury supply relief + OPEC+ discipline + ongoing AI enthusiasm push the Dow back toward highs and compress IG/HY spreads; DXY firms and gold ranges.
Bearish risk (20%). Prolonged shutdown + opinion that forces refunds and delays replacements; Treasury supply fears lift term premia; equities de-rate; DXY softens with yields, gold rallies, crude chops but holds better than cyclicals thanks to OPEC+. The recent recounting of bond market swings on tariff odds shows you the path dependency.
Fiscal and political implications investors can’t ignore
Three items drive the medium-term P/L: (1) tariff-linked revenue math and Treasury issuance; (2) the durability of OPEC+ discipline against a soft global cycle; (3) the political learning curve, Democrats adopting more muscular tactics, Republicans facing internal constraints, which together implies higher policy volatility even if the average path for growth is fine. Barron’s flagged both the Court’s fiscal wild card and the way Tuesday’s results may restrain unilateralism; that mix lifts the premium investors demand for U.S. policy stability, even if risk assets still love AI.
Risks and opportunities
The principal left-tail is a messy ruling that triggers refunds and months of tariff uncertainty just as shutdown distortions bite, an ugly cocktail for rates and cyclicals. The principal right-tail is a clean shutdown resolution + Court clarity that stabilizes fiscal math, letting the market refocus on productivity/AI and re-rate quality growth. Within that, Tesla’s package cements capital availability for physical-AI narratives, spilling over to industrial robotics, auto-ADAS, edge compute and power gear, even as the index tape stays headline-driven.
Positioning ideas
For XAUUSD, I like staggered entries on pullbacks during USD firmness or yield pops, with exits into Court/shutdown risk-off spikes. For S&P 500/Dow, stay barbell: cash-rich compounders and resilient defensives against a small sleeve of physical-AI and industrial automation beta that benefits from the Tesla imprimatur. For USDJPY/DXY, keep trades short-leash, fading extremes rather than chasing, until we have a shutdown end date and tariff jurisprudence in hand. For crude, own dips while OPEC+ maintains discipline; rotate to producers with strong balance sheets and low breakevens rather than pure beta.
Executive context and current market state
Into Tuesday, Nov. 11 (Warsaw), U.S. equities are trading near record territory after a constructive start to the week: the S&P 500 closed at 6,832.43 (+1.54% on Monday), the Dow at 47,368.63 (+0.81%), and the Nasdaq Composite at 23,527.17 (+2.27%). The Dollar Index sits at 96.87 (down ~5.7% YTD), spot gold rallied to about $4,112/oz, and front-month crude is hovering near $60/bbl. The broad Bloomberg U.S. Treasury index yield is ~3.92%, with the long Treasury index near 4.69%. This is the asset-mix backdrop for the week’s catalysts.
What the “$1T robo ransom” vote really does (Tesla)
The central equity narrative is shifting from EV unit economics to “physical-AI” optionality. The shareholder vote to award Elon Musk an unprecedented performance package is, functionally, a vote to concentrate control around a Robotaxi/Optimus roadmap that currently contributes almost nothing to revenue but most of the equity value embedded in the stock, per the Barron’s analysis you shared. The bull frame is speed: Tesla’s ability to iterate hardware, software, and data centers quickly, plus its experience “touching the physical world”, positions it to attack logistics and labor-substitution profit pools. The bear/neutral frame is time-to-cash: Robotaxi economics require regulatory throughput, urban deployment, and sustained FSD reliability; humanoids require customer acceptance, cost curves, and safety frameworks. On the numbers cited: BofA’s value apportionment implies that the “auto today” piece is a minority of the price, while Robotaxis and Optimus together dominate. If the plan passes, as betting markets and high-profile holders suggest in the column—Tesla leans even harder into the AI platform identity. If it fails, governance overhang grows, and the equity would likely re-rate toward cash-producing businesses (auto + energy storage + FSD subscriptions), a meaningfully lower outcome than “open-ended” robo upside.
For portfolio construction, that bifurcation matters because a “pass” increases the path-dependence of Tesla within mega-cap indices: more sensitivity to AI-infrastructure cycles, to city-level regulation, and to headline risk around automation accidents. Near term, the mechanical index impact is supportive while the broader EV tape remains mixed; medium term, you should assume higher left-tail volatility around regulatory events and demo failures (a la past autonomy setbacks), paired with right-tail upside on any credible Robotaxi monetization pilot.
Big Tech’s AI capex super-cycle and cash-flow math
Across Big Tech, a maturing AI capex super-cycle is compressing near-term margins at firms that lack offsetting external cloud revenue, while advantaging platforms that can rent out capacity. The piece you provided highlights Meta’s capex and depreciation bulge and the risk that “show-me” cash-flows lag the spend. Alphabet’s higher capex guide is backstopped by stronger cash generation and Cloud profitability; Microsoft and AWS remain cushioned by cloud operating leverage even as depreciation ramps. For alpha, the implication is straightforward: reward owners of AI-capex that monetize externally, and be choosier where AI is largely an internal cost center. At the second-derivative level, this also pulls forward demand for power, grid upgrades, copper and electrical equipment, and specialized construction, supporting industrials with data-center exposure, while creating pressure on utilities and regional power markets in the form of capacity and pricing debates.
Tariffs: macro effect smaller than feared, but the legal risk rises
The tariff shock of April didn’t deliver “doomsday.” The data in your packet point to an effective average rate materially below headline levies (via exemptions, supply-chain rerouting, bonded-warehouse usage, and inventory timing), with companies eating a notable share of costs as margins remain structurally fatter than pre-pandemic. That’s why realized inflation impulse looks muted so far, even as some sectors creep prices higher over time. The legal front is now a separate, market-moving variable: the Supreme Court signaled skepticism on key tariff authorities; a forced refund of previously collected levies is estimated at roughly $195 billion, which would weigh on the dollar if enacted. In markets last week, the ICE DXY slipped, and the Dollar Index has been trending lower YTD, consistent with anticipation of Fed easing and, at the margin, legal risk to tariff revenue.
U.S.–China: a fragile detente and what it removes and doesn’t
The Trump and Xi summit in South Korea took some tail-risk off: a one-year delay on China’s new rare-earths curbs, U.S. suspension of the “affiliates rule” expansion, partial tariff relief, and resumed commodity purchases provide breathing room. This is commercial de-escalation, not strategic rapprochement, and core issues (advanced chips, dual-use tech, export controls) are unresolved. For positioning, the immediate effect is lower equity risk premia across Asia and semis with China exposure, plus a softer safe-haven bid into the dollar; medium term, watch whether Nvidia’s engagement yields any sanctioned-product pathway and whether enforcement on rerouting via third countries tightens. Path dependency remains high: a single export-control or maritime incident can unwind the calm.
Labor market erosion vs. foundation: why the Fed still leans to cuts
The labor theme in your packet, stable initial claims around ~220k amid headline layoffs, supports the “erosion, not cliff” view. Small-business hiring intent is trying to turn; hospitality and transport showed monthly payroll gains; education/healthcare still add jobs. It’s a tepid recovery pulse, but it keeps the U.S. growth mix alive alongside easing goods inflation. Fed Governor Lisa Cook framed the trade-off cleanly: policy remains “modestly restrictive,” with downside jobs risk outweighing the risk of reinflation at the margin, and every meeting staying live. That stance is consistent with a 2026-leaning cuts path and a softer dollar baseline absent fresh supply shocks. Gold’s resilience with real yields off the highs is consistent with that combination and with continued geopolitical hedging.
Fiscal frictions: SNAP partial payments and shutdown scarring
SNAP’s partial-benefit plan during the shutdown introduces near-term drag for the lowest-income cohorts with the highest marginal propensity to consume, alongside state-level administrative delays. The macro effect is small at the national level but not trivial for retail comps sensitive to the EBT calendar. If prolonged, it slightly dents Q4/Q1 discretionary and reinforces the case for easier Fed policy relative to a world where fiscal flows were unimpeded.
Energy: China’s strategic stockpiling cushions crude’s downside
China has been importing >11 mb/d this year, stashing an estimated 1.0–1.2 mb/d into reserves, while Brent and WTI trade in the low-$60s. Stockpiling, capacity additions, and yuan-settled Russian flows put a floor under prices; conversely, any pause in those reserve builds exposes crude to the low-$50s scenario given the still-loose global balance. The U.S., by contrast, has been slow to rebuild the SPR. For portfolio risk, that mix argues for maintaining convexity via call spreads rather than outright long barrels, given macro growth uncertainty. The current tape, crude near $60, gold >$4k, dollar softer, is exactly the profile that tends to favor duration and quality equities over high-beta cyclicals unless or until an upside demand surprise materializes.
Banks: BofA’s bid to close the ROTCE gap
Bank of America’s investor day intends to shift the narrative from “responsible growth” to “more growth,” with a targeted ROTCE lift toward 16–18% from ~14% YTD, and capital returns combining ~2% yield with robust buybacks for a ~7% total shareholder yield. The drag from the low-coupon MBS book should abate as reinvestment runs at higher yields into 2026, while credit costs remain benign relative to history. Versus JPMorgan’s still-superior returns, BofA’s upside rests on delivering loan growth (notably cards, where it’s been conservative), re-energizing Merrill’s margins, and proving out NII expansion without undue duration risk. At ~12.5x forward EPS and a discount to top peers, there is room for multiple catch-up if execution lands. The near-term risk is “sell the news” if targets are seen as back-loaded.
Strategy, risks, and where to lean on
Strategically, lean into beneficiaries of externally monetizable AI capex (cloud platforms and their power-and-build-out upstreams), quality financials that can credibly expand ROTCE as duration headwinds fade, and gold as a policy-and-geopolitics hedge while dollar momentum is soft. Keep a differentiated stance within mega-cap tech: firms with internal-only AI spend face “show-me” risk on margins. Maintain optionality in energy rather than directional leverage. The biggest risks to this stance are an adverse Supreme Court outcome that ricochets through trade channels in unexpected ways, a negative surprise in CPI that re-firms real yields, an autonomy-related regulatory shock that crimps the Tesla/Robotaxi narrative, or an abrupt deterioration in the U.S.–China tone that revives dollar strength and commodity volatility.
For the lazy in my opinion:
* XAUUSD (Gold): Up
* S&P 500 (ES): Up
* Dow Jones (DJI): Up
* Nasdaq 100 (NQ): Up
* WTI Crude (CL): Up (modest; floor from China stockpiling)
* DXY (US Dollar Index): Down
* USDJPY: Down (yen firmer on softer USD/rates)
* UST 10Y Yield: Down (prices up)
* TSLA: Up (governance vote → “physical-AI” optionality)
* META: Down (capex/depr. overhang)
* GOOGL: Up (cloud/cash flow cushion)
* MSFT: Up (Azure strength)
* AMZN: Up (AWS monetizes AI demand)
* Bank of America (BAC): Up (ROTCE catch-up path)
* Energy equities (XLE): Down (oil capped, margin pressure)
* Copper: Up (grid/data-center buildout)
* EURUSD: Up (weaker USD)
* USDCNH: Down (yuan supported by flows)
* VIX: Down (risk premium easing)

Please always follow money managment. Forex Markete is very riskThe information and publications are not meant to be, and do not constitute, financial, investment, trading, or other types of advice or recommendations supplied or endorsed by TradingView. Read more in the

1st trade of weekPlease use small lot size.
Gold is will go upside for kick out sellers before a big drop until its didn't complete its task we will remains buyers for short term after that we will enjoy big selling.

Gold consolidates near 4000 as market awaits breakout1️⃣ Market Overview:
Gold (XAU/USD) climbed to $4008 earlier but was quickly sold off back to $3990, showing a strong tug-of-war between buyers and sellers.
Currently trading around $3998–$4002, the market remains in a tight consolidation phase ahead of potential volatility in the U.S. session.
The USD remains steady, while U.S. bond yields stay elevated — both limiting gold’s short-term upside momentum.
2️⃣ Technical Analysis:
• Resistance: $4008 – $4015 – $4025
• Support: $3990 – $3985 – $3972
• EMA50 (H1): around $3996 → acting as short-term dynamic support.
• RSI (H1): neutral near 50 → market still awaiting a decisive signal.
• Multiple spinning top candles on H1 indicate accumulation and indecision.
3️⃣ Outlook:
Gold continues to move sideways between $3990–$4010, showing price compression before a breakout.
If H1 closes above $4015, the bullish momentum could extend toward $4025–$4040.
However, a drop below $3988 could trigger another correction toward $3975.
4️⃣ Trading Strategy:
🔻 SELL XAU/USD
Entry: $4008 – $4012
🎯 TP: 40 / 80 / 200 pips
🛑 SL: $4016
🔺 BUY XAU/USD
Entry: $3975 – $3977
🎯 TP: 40 / 80 / 200 pips
🛑 SL: $3971

XAUUSD: Market Analysis and Strategy for November 7th.Gold Technical Analysis:
Daily Resistance: 4080, Support: 3890.
4-Hour Resistance: 4035, Support: 3965.
1-Hour Resistance: 4020, Support: 3985.
Technically, the bullish outlook on monthly and weekly charts remains strong, but caution is advised as the market may be accumulating upward momentum during the downtrend. The daily chart shows gold consolidating within a range; watch for a potential slowdown in the moving average system, and the MACD/KDJ indicators may be poised for an upward correction.
Whether the price can recover above 4080/85 is crucial for further bullish moves, while a break below 3880 is key for further bearish moves. A conservative approach would be to wait for a breakout and then follow the trend. Short-term traders can buy low and sell high within this range.
Looking at the 1-hour chart, the moving average support is moving upwards, the Bollinger Bands are narrowing, and the trading range is narrowing. In the short term, focus on the continuation of the upward trend during the European and American sessions, paying particular attention to the resistance zone around 4030, the recent rebound high, and secondarily the upper Bollinger Band at 4015-4020.
Trading Strategy:
BUY: 3970~3960
BUY: 3990~3980
SELL: 4020~4030
More Analysis →

Gold Price Forecast (7 Nov 2025): Buyers Waiting Below $4,000📌 Current Price Snapshot
The spot price for Gold is around US $3,991 per troy ounce (as of 7 Nov 2025) according to
In Australian dollars the price is about A$6,144 per troy ounce.
🎯 Key Technical / Market Context
Resistance / Support zones
The metal has tested and broken through the psychological US $4,000/oz level recently but has found resistance there.
World Gold Council
A key breakdown level is around US $3,700/oz. If price drops below that, it opens a risk of deeper pull-back (to ~US $3,500/oz).
On the upside, if momentum returns and breaks convincingly above ~US $4,400/oz it could trigger a fresh leg upward.
Technical indicators
The recent analysis shows gold is trading below its 50-day EMA, meaning short-term momentum is weak and there’s dominant selling pressure.
Economies.com
While oversold indicators have given somewhat of a bounce, the up-trend is not yet strong.
Economies.com
Drivers (fundamentals & macro)
A weaker US dollar and expectations of rate cuts by Federal Reserve have been major tailwinds for gold.
goldpriceforecast.com
Geopolitical uncertainty and central-bank buying are adding structural support.
But caution: If the dollar strengthens, or rate cuts get delayed/inflation surprises happen, gold could be vulnerable.
BullionByPost Europe
🔍 My Trading View & Strategy
Given the current levels and market structure, here’s how I’m positioning, if I were trading gold today:
Short term (next few days to 1–2 weeks):
With the price ~US $3,991 and under pressure below key moving averages, I’m not chasing a long position aggressively. I’d wait for either:
A dip toward support (~US $3,700) with signs of bounce (good risk-to-reward for long).
Or a breakout above ~US $4,200-US $4,400 with strong volume and momentum for long.
Medium term (next 1-3 months):
My base view is still bullish (structural tailwinds remain) but price is in a consolidation/correction phase. So:
Consider buying on dips around US $3,700-3,800 with tight stops.
If price drops below US $3,500, reevaluate: risk of deeper correction.
If price breaks above US $4,400 convincingly, potential target toward US $4,800+ in that window.
Risk management:
Stop-loss placed just below the key support (e.g., beneath US $3,650) to protect downside.
Use smaller size if entering in this somewhat volatile environment.
Keep an eye on macro news (Fed announcements, USD moves, inflation prints).

I WILL GO SHORT FOR GOLD / XAAUSD , WHAT DO YOU GUYS THINK ?I expect XAAUSD to test the zone, based on my CMP (Current Market Price) technique — a method I use to identify potential reaction areas and key levels from a technical perspective.
🔍 Technical Outlook:
Price is approaching a CMP zone that may act as a reaction point.
I’ll be monitoring closely for a bearish engulfing pattern as confirmation before entering a trade.
🎯 Trade Plan:
Stop Loss: 50 pips
Take Profit: 1:2 or 1:3 R:R
Setup Type: CMP Reaction + Engulfing Confirmation
⚠️ Disclaimer:
This analysis reflects my personal technical view and is not financial advice. Always do your own research before taking any trade.

Gold Price Outlook – Trade Setup (XAU/USD)📊 Technical Structure
OANDA:XAUUSD Gold (XAU/USD) continues to face resistance below the $3,995–$3,993 Resistance Zone, with repeated rejections suggesting weakening bullish momentum. Price action has formed lower highs near $3,990, signalling potential exhaustion.
The Support Zone sits around $3,929–$3,938, which previously acted as a springboard for short-term rebounds. The current structure favours a bearish correction, particularly if price fails to reclaim $3,995 on a sustained basis. A clean break below $3,950 would confirm bearish continuation toward the $3,930 area.
🎯 Trade Setup
Idea: Sell near resistance, target a drop toward support.
Entry: $3,985 – $3,993 (Resistance Zone retest)
Stop Loss: $3,996
Take Profit 1: $3,950
Take Profit 2: $3,930
Risk–Reward Ratio: ≈ 1 : 5.2
A break above $3,996 would invalidate the short setup and could open the door to retest $4,030.
🌐 Macro Background
Gold prices slipped to around $3,970 in Thursday’s Asian session, weighed down by stronger-than-expected US private payroll data and a resilient US Dollar.
As FXStreet’s Lallalit Srijandorn noted, “Gold edges lower below $4,000 as private payrolls rebound in October.” 【FXStreet】
ADP Employment Data: US companies added 42,000 jobs in October, rebounding from the previous month’s contraction, suggesting stabilization in the labor market. This data supports the Fed’s cautious tone and trims expectations for near-term rate cuts.
Fed Commentary: Several Fed officials, including Michael Barr, John Williams, and Christopher Waller, are scheduled to speak later today. Any hawkish remarks reinforcing the “higher for longer” narrative could further strengthen the USD and pressure gold.
Government Shutdown: The US government shutdown, now at 37 days, marks the longest in history. Political gridlock could lend some safe-haven support to gold, but so far, the impact has been muted compared to stronger USD dynamics.
In short, with the US labour market improving and Fed officials maintaining caution, gold’s upside remains limited, while macro bias supports near-term weakness.
🔑 Key Technical Levels
Resistance: $3,985 – $3,996
Support: $3,929 – $3,938
Psychological Level: $4,000
📌 Trade Summary
Gold (XAU/USD) remains under pressure below $4,000 as bullish momentum fades. The setup favours a short position from the $3,985–$3,993 zone, targeting a decline toward $3,930. A sustained break above $3,996 would invalidate this bias and shift focus to $4,030 resistance.
⚠️ Disclaimer
This analysis is for reference only and does not constitute trading advice. Trading involves significant risk, and proper risk management is essential.

XAUUSD: Market Analysis and Strategy for November 11Gold Technical Analysis:
Daily Resistance: 4192, Support: 4030
4-Hour Resistance: 4150, Support: 4080
1-Hour Resistance: 4150, Support: 4125
From a technical perspective, the monthly/weekly charts continue to show a bullish trend in the short term. The daily chart's "rounded bottom" upward pattern is basically confirmed, and the MACD/KDJ indicators provide support for upward momentum. As those who have read my recent analyses know, I have consistently emphasized that a break above 4080-4085 would further trigger bullish sentiment. Going forward, pay attention to the support level where the previous resistance turned into support, and also monitor the continuation of the upward trend. Support is expected around 4085-4080.
Combined with the 1-hour chart, although the upward momentum of the moving averages has slowed somewhat, the overall trend remains unchanged. During the European and American sessions, watch for opportunities to buy if the price tests the support levels around 4125 and 4117.
BUY:4125~4117
BUY:4102near
BUY:4090near
SELL:4155~4162near

XAUUSD BUY M30 TIME FRAME CHART ANALYSIS CONFIRMED TARGET I'm going to BUY now entry 3998
Take profit 4008
Take profit 4018
Take profit 4030
SL 3988

XAUUSD : 4H Elliott wave at correction stageNow Correction stage
Short-term pattern :
Long to zone 4045 - 4193
Invalid if drops below 3884
Buy entry zone 3945-3975 if it breaks the yellow trendline
, will double confirm to C and end of X
Stop loss 3884
(If it can meet that green arrow zone, we wait and see a rejection candle for short again)
PS.
Medium-term pattern: Gold should drop below 3885, and wait for its reversal to get the bullish Long-term trend again

Gold's Critical Crossroads: Double Top Threatens Reversal!👑 Gold's Critical Crossroads: Double Top Threatens Reversal! 📉
XAU/USD (4H Timeframe) Analysis
Gold has experienced a significant uptrend followed by a sharp reversal pattern, leaving traders to navigate a crucial period of consolidation and retesting. The chart highlights key supply and demand zones that will dictate the metal's next major move.
1. The Bearish Setup: Double Top and Key Zone Loss
The chart clearly shows that the bullish momentum stalled after hitting a high around 4400.
⚠️ The Double Top at 4400: This major bearish reversal pattern formed, indicating strong selling pressure at the top. The price couldn't sustain the breakout, leading to a swift decline.
📉 Breakdown of the 4000 Key Zone: After the double top, Gold lost the critical 4000 Key Zone, which previously acted as strong support (teal box). The price is now retesting this zone from below, confirming its transition into a resistance area.
🛑 4150 to 4250 (1st Resistance): This large red zone represents the first major overhead supply area. For bulls to regain confidence, they would need to conquer this zone, but it looks heavily defended for now.
2. Current Price Action and Support Levels
The price is currently consolidating below the 4000 resistance, forming a classic "descending triangle" or consolidation pattern.
🛡️ 3900 Immediate Support: The price is being held up by the 3900 immediate support level (green box). Holding this level is essential to prevent a further slide. A break below 3900 would likely signal more downside.
🎯 3800 to 3850 Next Support: This deeper green zone is the last line of defense for the current structure. This area aligns with the base of the previous major rally, making it a critical demand zone.
3. Trade Plan Scenarios
Bulls (Long):
Entry Trigger: A sustained breakout and candle close above the 4000 Key Zone.
Target: A retest of the 4150 to 4250 resistance area.
Bears (Short):
Entry Trigger: A confirmed breakdown and candle close below the 3900 Immediate Support.
Target: The next major demand zone at 3800 to 3850.
In summary, Gold is at a pivotal point. Traders should monitor the battle at the 3900 support and 4000 resistance for the next directional cue!
What do you think will happen next: will Gold hold 3900 or finally break above 4000?
Disclaimer:
The information provided in this chart is for educational and informational purposes only and should not be considered as investment advice. Trading and investing involve substantial risk and are not suitable for every investor. You should carefully consider your financial situation and consult with a financial advisor before making any investment decisions. The creator of this chart does not guarantee any specific outcome or profit and is not responsible for any losses incurred as a result of using this information. Past performance is not indicative of future results. Use this information at your own risk. This chart has been created for my own improvement in Trading and Investment Analysis. Please do your own analysis before any investments.

Shorting Europe Session Gold RallyExpected upside move in Europe session is in play. I will go for another short from here. I'm bearish until the end of US shutdown.
