Gold price analysis October 16GOLD UPDATE – The trend is still in favor of the buyers
Gold continues to record new records during the day, showing that buying power is still absolutely dominant. In recent sessions, the simplest strategy – just “BUY” according to the trend – has brought good profits.
At the moment, the most important thing is to wait for the price to adjust to the support zones to establish a new buying position. If you are still trying to “catch the top” of gold, maybe it is time to temporarily remove the Sell button and go with the main trend of the market.
📈 Trading strategy:
BUY Trigger: When a price rejection signal appears at the support zone of 4180 – 4215
Target: Aim for the 4300 mark
Trade ideas

Gold Price Outlook – Trade Setup (XAU/USD)📊 Technical Structure
OANDA:XAUUSD Gold surged to a fresh record near $4,380 before retracing lower, now consolidating around $4,320–$4,330. The support zone sits at $4,301–$4,290, while the resistance zone is located at $4,368–$4,377. Price action shows a sharp pullback from highs, but bulls still hold ground above the key support. A rebound scenario could see a push back toward the resistance, while a decisive break below $4,285 would invalidate the bullish setup.
🎯 Trade Setup (Bullish Scenario)
Entry: $4,301–$4,290 (near consolidation & above support)
Stop Loss: $4,285
Take Profit 1: $4,350
Take Profit 2: $4,368
Take Profit 3: $4,377
Risk/Reward: ≈ 1 : 4.91
🗝️ Key Technical Levels
Resistance: $4,350 / $4,368 / $4,377
Support: $4,301 / $4,290
🌍 Macro Background
Gold remains supported by Fed rate cut bets, US-China trade frictions, and prolonged US government shutdown fears.
Fed Policy: Powell and Waller signalled two more cuts this year, reducing the opportunity cost of holding gold.
US-China Tensions: Additional port fees and tariff threats fuel safe-haven demand.
US Government Shutdown: Entering its third week, weighing on the USD and indirectly boosting gold.
Geopolitics: Some easing in Ukraine risks could cap upside, but macro drivers remain gold-positive.
📌 Trade Summary
Gold remains in a strong uptrend despite intraday corrections. A long setup near $4,301–$4,290 with stops under $4,285 offers a favourable risk-reward toward $4,368–$4,377. Safe-haven demand and dovish Fed expectations continue to support bullish momentum.
⚠️ Disclaimer
This analysis is for reference only and does not constitute trading advice. Trading involves significant risk, and proper risk management is essential.

XAUUSD NEXT POSSIBLE MOVE Gold is currently trading near a key support zone, an area where buyers have previously shown strong reactions. After a period of correction, price action is indicating buyer accumulation and a potential shift in momentum.
If the price continues to respect this support area and forms a bullish structure (such as a higher low or bullish engulfing candle), it could signal the beginning of a bullish reversal.
Volume and momentum indicators are also hinting at reduced selling pressure and a gradual return of buyer strength.
As long as Gold holds above the support level, the market bias remains bullish, with potential for an upward continuation in the coming sessions.
Traders should wait for clear confirmation from price action before executing buy entries to align with smart money flow.

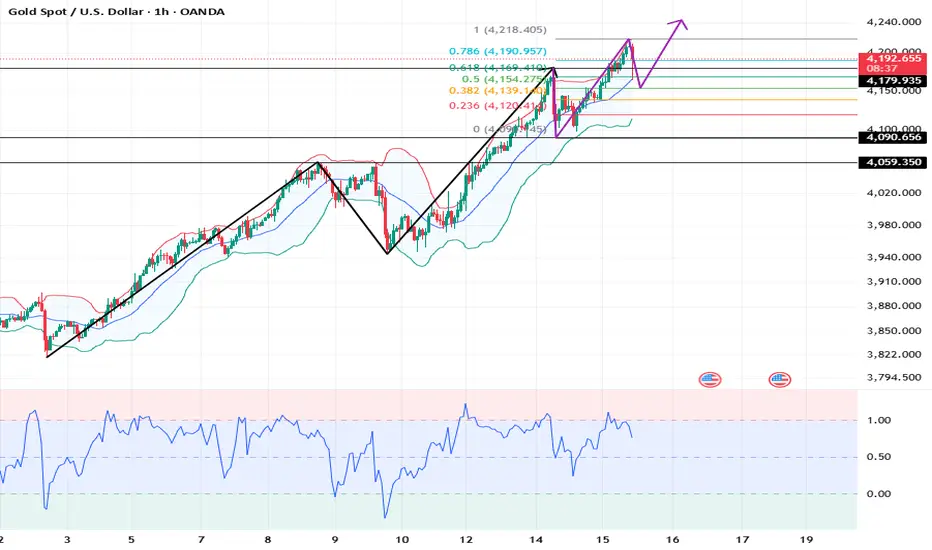
Risks and opportunities exist at the same time, continue to buyGold Technical Analysis
Daily Resistance: 4200, Support: 3945
4-Hour Resistance: 4220, Support: 4090
1-Hour Resistance: 4220, Support: 4180
Gold prices have already broken through the 4200 mark today, effectively erasing any bearish concerns. Yesterday, I was hoping for a pullback to 4060, offering a better entry point, but the rally was too strong, and the pullback stalled around 4100.
From the current structure, gold has found support at 4180 and 4150. If it stalls there today, you can still buy in. The only caveat is not to set a stop-loss that's too small, but don't cancel it either. Doing so can easily lead to false breakouts, as has been the case with recent large and rapid movements.
Although gold remains in a bull market, as prices continue to rise, sudden and rapid intraday declines like Tuesday's will only become more frequent and more severe. All we can do is continue to follow the upward trend while remaining vigilant and prepared to react to any potential corrections.
Trading today, we continue to prioritize buying on dips, focusing on support levels around 4180-4150.
BUY: near 4180
BUY: near 4150
Gold - short term pull back Gold has been running hot, but I’m expecting a relief move to the downside before continuation. We’ve just seen a bullish flag completion, and markets often need to cool off before resuming the larger trend.

Are you ready for the Hammer?Hi there,
be ready for strong pullback soon!
Sure, price can always go higher or lower, but market is not a straight line it moves in impulses and correction, and Fifth wave is always can be tricky can have extensions also!
God luck

XAUUSDAm taking this, with very low-risk.
Counter trend setup. Risky. Manage trade efficiently if interested

Gold. where is FOMO and JOMO zone? 12/Oct/25XAUUSD where would be roughly the FOMO ( Fear of Missing Out ) ( To trap buyers ) and JOMO ( Joy of Missing Out ) ( To trap Seller and Abandoned Gold Buyer ) are would occur? A Nature Harmonic Phenomenon/ Pattern where price balance out from imbalance of supply/demand..

Gold Healthy PullbackGold is taking a short breather after a strong rally. Price recently tapped near the $4,230 zone before showing its first meaningful pullback in days.
The 33 EMA (pink line) is acting as dynamic support, if the price holds above it, we could see another leg higher toward the $4,280–$4,320 range. However, if that level breaks cleanly, the next strong demand sits around $4,020, where both the 100 EMA and previous accumulation zone align.
In simple terms, this is a healthy correction within a bullish trend. A bounce from either the 33 EMA or 100 EMA could easily trigger the next push upward.

GOLDPreferably suitable for scalping and accurate as long as you watch carefully the price action with the drawn areas.
With your likes and comments, you give me enough energy to provide the best analysis on an ongoing basis.
And if you needed any analysis that was not on the page, you can ask me with a comment or a personal message.
Enjoy Trading ;)

GOLD (XAUUSD) SELL SETUPGold has been moving in a strong ascending channel, pushing to all-time highs in an overextended rally. Price is now sitting at channel resistance, showing signs of rejection.
🕊️ With the Gaza war ending, safe-haven demand is cooling — a bearish sign for gold. A healthy correction is expected after 8 weeks of almost non-stop upside.
🎯 Take Profit Levels:
TP1: 4164
TP2: 4122
TP3: 4093
TP4: 4056
⚠️ If price breaks channel support, we could see deeper downside.
🚫 SL above recent highs

The Fundamentals That Could End the Debasement TradeThe “debasement trade” has emerged as one of the key market themes: a strategy based on the loss of value of fiat currencies amid unlimited monetary creation, rising public debt, and the erosion of purchasing power. In this context, investors have turned to so-called “tangible” assets—gold and silver—viewed as safe havens against monetary dilution.
But while this narrative has dominated much of the year, several fundamentals could gradually bring it to an end by late 2025.
First, the end of the U.S. government shutdown would restore confidence in American fiscal management and reduce the political risk premium. In the same vein, clearer fiscal consolidation and a return to minimum budget discipline could signal that governments are regaining control over the trajectory of deficits and debt. This mere shift in perception could be enough to ease fears of U.S. dollar “debasement.”
At the same time, if central banks maintain or raise real interest rates, fiat currencies would regain competitiveness against non-productive assets. Positive real yields restore the value of cash and reduce the appeal of inflation hedges. This is even more true if inflation expectations decline: less fear of price surges means less need to seek protection through gold or other precious metals.
A stable or stronger dollar would reinforce this dynamic—it is, in fact, the most important factor signaling the end of the debasement trade.
Historically, a firm greenback weighs on precious metals while signaling renewed confidence in monetary stability. At the same time, a better global growth environment could redirect capital toward risk assets at the expense of “hard assets.”
Another key element is the tightening of liquidity conditions. Less money in circulation and less speculative excess would dry up flows into safe-haven assets. Similarly, a geopolitical de-escalation would reduce demand for protective values. If, in parallel, institutions reallocate toward bonds—attracted by once again appealing yields—that would mark the end of the great flight from the fiat system.
Finally, the real turning point will come with the return of political and monetary credibility. When markets once again perceive authorities as capable of managing debt, inflation, and growth without resorting to the printing press, the engine of the debasement trade will naturally shut down. Once confidence is restored, the risk premium on tangible assets will decline, placing the dollar, real yields, and macroeconomic discipline back at the center of the game.
DISCLAIMER:
This content is intended for individuals who are familiar with financial markets and instruments and is for information purposes only. The presented idea (including market commentary, market data and observations) is not a work product of any research department of Swissquote or its affiliates. This material is intended to highlight market action and does not constitute investment, legal or tax advice. If you are a retail investor or lack experience in trading complex financial products, it is advisable to seek professional advice from licensed advisor before making any financial decisions.
This content is not intended to manipulate the market or encourage any specific financial behavior.
Swissquote makes no representation or warranty as to the quality, completeness, accuracy, comprehensiveness or non-infringement of such content. The views expressed are those of the consultant and are provided for educational purposes only. Any information provided relating to a product or market should not be construed as recommending an investment strategy or transaction. Past performance is not a guarantee of future results.
Swissquote and its employees and representatives shall in no event be held liable for any damages or losses arising directly or indirectly from decisions made on the basis of this content.
The use of any third-party brands or trademarks is for information only and does not imply endorsement by Swissquote, or that the trademark owner has authorised Swissquote to promote its products or services.
Swissquote is the marketing brand for the activities of Swissquote Bank Ltd (Switzerland) regulated by FINMA, Swissquote Capital Markets Limited regulated by CySEC (Cyprus), Swissquote Bank Europe SA (Luxembourg) regulated by the CSSF, Swissquote Ltd (UK) regulated by the FCA, Swissquote Financial Services (Malta) Ltd regulated by the Malta Financial Services Authority, Swissquote MEA Ltd. (UAE) regulated by the Dubai Financial Services Authority, Swissquote Pte Ltd (Singapore) regulated by the Monetary Authority of Singapore, Swissquote Asia Limited (Hong Kong) licensed by the Hong Kong Securities and Futures Commission (SFC) and Swissquote South Africa (Pty) Ltd supervised by the FSCA.
Products and services of Swissquote are only intended for those permitted to receive them under local law.
All investments carry a degree of risk. The risk of loss in trading or holding financial instruments can be substantial. The value of financial instruments, including but not limited to stocks, bonds, cryptocurrencies, and other assets, can fluctuate both upwards and downwards. There is a significant risk of financial loss when buying, selling, holding, staking, or investing in these instruments. SQBE makes no recommendations regarding any specific investment, transaction, or the use of any particular investment strategy.
CFDs are complex instruments and come with a high risk of losing money rapidly due to leverage. The vast majority of retail client accounts suffer capital losses when trading in CFDs. You should consider whether you understand how CFDs work and whether you can afford to take the high risk of losing your money.
Digital Assets are unregulated in most countries and consumer protection rules may not apply. As highly volatile speculative investments, Digital Assets are not suitable for investors without a high-risk tolerance. Make sure you understand each Digital Asset before you trade.
Cryptocurrencies are not considered legal tender in some jurisdictions and are subject to regulatory uncertainties.
The use of Internet-based systems can involve high risks, including, but not limited to, fraud, cyber-attacks, network and communication failures, as well as identity theft and phishing attacks related to crypto-assets.

Gold trading strategy | October 13-14✅ From the 1-hour chart, gold has pulled back from the 4117 high and is currently trading between MA5 and MA10, showing a slowdown in short-term momentum.
The moving average system shows MA5 starting to turn downward, while MA10 and MA20 remain upward, indicating short-term correction pressure but strong medium-term support.
The Bollinger upper band near 4117 is acting as resistance, while the middle band around 4077 serves as the key short-term support. If the price stabilizes above this level, a short-term rebound is likely.
🔴 Resistance Levels: 4115–4120
🟢 Support Levels: 4070–4060
✅ Trading Strategy Reference:
🔰 If gold pulls back to the 4060–4070 zone and holds steady, consider building long positions in batches, targeting 4105–4120.
🔰 If gold faces repeated resistance around 4120–4130 and momentum weakens, consider light short positions, targeting 4085–4070, with a stop loss above 4135.
🔥Trading Reminder: Trading strategies are time-sensitive, and market conditions can change rapidly. Please adjust your trading plan based on real-time market conditions.


Looking for Shorts Entry Looking for short entry on gold for next week. anything above 4033 region will invalidate the setup. proceed with caution. and exercise save risk management.

Gold/USD: Bullish Climb to $4100?OANDA:XAUUSD is showing a bullish setup on the 1-hour chart , with an entry zone between $3,963-$3,985 near a key support level.
First target at $4,075 marks initial resistance, while the second at $4,100 offers a deeper upside potential. Set a stop loss on a close below $3,940 to manage risk effectively. 🌟
A break above $3,985 with strong volume could confirm this move, driven by safe-haven demand and USD dynamics. Watch economic data trends! 💡
📝 Trade Plan:
✅ Entry Zone: $3,963 – $3,985 (support area)
❌ Stop Loss: Daily close below $3,940
🎯 Targets:
TP1: $4,075 (initial resistance)
TP2: $4,100 (extended target)
Ready for this rally? Drop your thoughts below! 👇

Gold price dropped sharply, adjusted around 3900⭐️GOLDEN INFORMATION:
Gold (XAU/USD) holds below the key $4,000 mark during the Asian session on Friday. While the metal remains under pressure after Thursday’s pullback from record highs, softer US Dollar momentum, expectations of further Fed rate cuts, and lingering US government shutdown concerns continue to lend support.
⭐️Personal comments NOVA:
Gold price started to have a large-scale correction, below 3400. Selling pressure continued around 3900.
⭐️SET UP GOLD PRICE:
🔥SELL GOLD zone: 4018 - 4020 SL 4025
TP1: $4005
TP2: $3980
TP3: $3965
🔥BUY GOLD zone: $3894-$3896 SL $3889
TP1: $3905
TP2: $3920
TP3: $3935
⭐️Technical analysis:
Based on technical indicators EMA 34, EMA89 and support resistance areas to set up a reasonable SELL order.
⭐️NOTE:
Note: Nova wishes traders to manage their capital well
- take the number of lots that match your capital
- Takeprofit equal to 4-6% of capital account
- Stoplose equal to 2-3% of capital account

XAUUSD M30 | Bullish riseGold (XAU/USD) is reacting off the buy entry at 4,000.37, which is a pullback support and could potentially rise from this level to the upside.
Stop loss is at 3,950.65, which is a multi-swing low support.
Take profit is at 4,056.76, which is a multi swing high resistance.
High Risk Investment Warning
Trading Forex/CFDs on margin carries a high level of risk and may not be suitable for all investors. Leverage can work against you.
Stratos Markets Limited (tradu.com ):
CFDs are complex instruments and come with a high risk of losing money rapidly due to leverage. 65% of retail investor accounts lose money when trading CFDs with this provider. You should consider whether you understand how CFDs work and whether you can afford to take the high risk of losing your money.
Stratos Europe Ltd (tradu.com ):
CFDs are complex instruments and come with a high risk of losing money rapidly due to leverage. 66% of retail investor accounts lose money when trading CFDs with this provider. You should consider whether you understand how CFDs work and whether you can afford to take the high risk of losing your money.
Stratos Global LLC (tradu.com ):
Losses can exceed deposits.
Please be advised that the information presented on TradingView is provided to Tradu (‘Company’, ‘we’) by a third-party provider (‘TFA Global Pte Ltd’). Please be reminded that you are solely responsible for the trading decisions on your account. There is a very high degree of risk involved in trading. Any information and/or content is intended entirely for research, educational and informational purposes only and does not constitute investment or consultation advice or investment strategy. The information is not tailored to the investment needs of any specific person and therefore does not involve a consideration of any of the investment objectives, financial situation or needs of any viewer that may receive it. Kindly also note that past performance is not a reliable indicator of future results. Actual results may differ materially from those anticipated in forward-looking or past performance statements. We assume no liability as to the accuracy or completeness of any of the information and/or content provided herein and the Company cannot be held responsible for any omission, mistake nor for any loss or damage including without limitation to any loss of profit which may arise from reliance on any information supplied by TFA Global Pte Ltd.
The speaker(s) is neither an employee, agent nor representative of Tradu and is therefore acting independently. The opinions given are their own, constitute general market commentary, and do not constitute the opinion or advice of Tradu or any form of personal or investment advice. Tradu neither endorses nor guarantees offerings of third-party speakers, nor is Tradu responsible for the content, veracity or opinions of third-party speakers, presenters or participants.

The “Debasement Trade” — What Is It?In 2025, the best-performing assets are not tech stocks or sovereign bonds, but gold, silver, Bitcoin, and Ethereum. This striking fact reflects a much deeper trend: the powerful comeback of the “debasement trade” — the bet on the devaluation of major currencies.
Amid soaring public deficits, record debt levels, and increasingly accommodative monetary policies, more and more investors are questioning the ability of leading economies to preserve the value of their money. The term “debasement” originates from the era when monarchs reduced the precious metal content of their coins — an early way to create money at the expense of those who held it.
Today, the mechanism is different, but the logic remains the same: governments finance their spending through debt, which central banks ultimately absorb indirectly. The result is expanding money supply, eroding purchasing power, and waning confidence.
In this environment, a trade has emerged — selling or avoiding fiat currencies in favor of real and scarce assets. Bitcoin and Ethereum benefit from their algorithmic scarcity; gold and silver, from their historic role as stores of value.
This movement is not merely defensive; it signals a paradigm shift. Investors are seeking assets uncorrelated with sovereign debt — instruments that can preserve wealth in a world of ever-expanding public balance sheets. In other words, it is less about speculation and more about insurance against monetary erosion.
In the short term, this “debasement trade” supports precious metals and cryptocurrencies. But in the medium term, it conveys a more troubling message: a structural loss of confidence in fiat money. As long as governments postpone fiscal adjustments, demand for these alternative assets is likely to remain strong.
Ultimately, 2025 confirms a truth many preferred to ignore: when money weakens, investors turn to what cannot be printed.
DISCLAIMER:
This content is intended for individuals who are familiar with financial markets and instruments and is for information purposes only. The presented idea (including market commentary, market data and observations) is not a work product of any research department of Swissquote or its affiliates. This material is intended to highlight market action and does not constitute investment, legal or tax advice. If you are a retail investor or lack experience in trading complex financial products, it is advisable to seek professional advice from licensed advisor before making any financial decisions.
This content is not intended to manipulate the market or encourage any specific financial behavior.
Swissquote makes no representation or warranty as to the quality, completeness, accuracy, comprehensiveness or non-infringement of such content. The views expressed are those of the consultant and are provided for educational purposes only. Any information provided relating to a product or market should not be construed as recommending an investment strategy or transaction. Past performance is not a guarantee of future results.
Swissquote and its employees and representatives shall in no event be held liable for any damages or losses arising directly or indirectly from decisions made on the basis of this content.
The use of any third-party brands or trademarks is for information only and does not imply endorsement by Swissquote, or that the trademark owner has authorised Swissquote to promote its products or services.
Swissquote is the marketing brand for the activities of Swissquote Bank Ltd (Switzerland) regulated by FINMA, Swissquote Capital Markets Limited regulated by CySEC (Cyprus), Swissquote Bank Europe SA (Luxembourg) regulated by the CSSF, Swissquote Ltd (UK) regulated by the FCA, Swissquote Financial Services (Malta) Ltd regulated by the Malta Financial Services Authority, Swissquote MEA Ltd. (UAE) regulated by the Dubai Financial Services Authority, Swissquote Pte Ltd (Singapore) regulated by the Monetary Authority of Singapore, Swissquote Asia Limited (Hong Kong) licensed by the Hong Kong Securities and Futures Commission (SFC) and Swissquote South Africa (Pty) Ltd supervised by the FSCA.
Products and services of Swissquote are only intended for those permitted to receive them under local law.
All investments carry a degree of risk. The risk of loss in trading or holding financial instruments can be substantial. The value of financial instruments, including but not limited to stocks, bonds, cryptocurrencies, and other assets, can fluctuate both upwards and downwards. There is a significant risk of financial loss when buying, selling, holding, staking, or investing in these instruments. SQBE makes no recommendations regarding any specific investment, transaction, or the use of any particular investment strategy.
CFDs are complex instruments and come with a high risk of losing money rapidly due to leverage. The vast majority of retail client accounts suffer capital losses when trading in CFDs. You should consider whether you understand how CFDs work and whether you can afford to take the high risk of losing your money.
Digital Assets are unregulated in most countries and consumer protection rules may not apply. As highly volatile speculative investments, Digital Assets are not suitable for investors without a high-risk tolerance. Make sure you understand each Digital Asset before you trade.
Cryptocurrencies are not considered legal tender in some jurisdictions and are subject to regulatory uncertainties.
The use of Internet-based systems can involve high risks, including, but not limited to, fraud, cyber-attacks, network and communication failures, as well as identity theft and phishing attacks related to crypto-assets.

Back to Basics: How to Calculate Entry & TP on Gold (Forex)📌 Back to Basics: How to Calculate Entry & TP on Gold 🥇📈
Gold doesn’t move in pips like Forex pairs—it moves in points.
✅ 1 Point = 10 Pips
In this quick video, I’ll show you a simple way to calculate your entry and take-profit (TP) when trading Gold. No stress, no confusion—just add or subtract points from your entry price to set your TP with confidence.
Perfect for beginners and traders who want a refresher on the basics!
✨ Trading made simple.
👉 Watch now and level up your Gold trading game.
⚠️ Disclaimer: This video is for educational purposes only and should not be considered financial advice. Trading carries risk, and you should only trade with money you can afford to lose. Always do your own research before making any trading decisions.

GOLD Bull Market Price Target is 7 500 USD accumulate on dips🏆 Gold Market Long-Term Update 12/24 months
📊 Technical Outlook Update
🏆 Bull Market Overview
▪️2weeks/candle price chart
▪️Gold Bull market in progress
▪️1976/1979 650% gains - Bull Market 1
▪️1999/2012 650% gains - Bull Market 2
▪️2016/2027 650% gains- Bull Market 3
▪️Price Target BULLS 7500 USD
▪️650% gains off the lows
▪️will hit in 2026/2027
⭐️Recommended strategy
▪️BUY/HOLD accumulate dips
▪️BUY/HOLD physical gold
▪️BUY/HOLD GLD/GDX

gold up coming targets is 4090 t0 4100 and 4200gold up coming targets is 4090 t0 4100 and 4200
its only technicals pure

Next move of GOLD Take liquidity grab and continues down move this is my point of from my trading setup
