XAUUSD BUY M30 TIME FRAME CHART ANALYSIS CONFIRMED TARGET I'm going to BUY now entry 3998
Take profit 4008
Take profit 4018
Take profit 4030
SL 3988
Trade ideas

Gold's Critical Crossroads: Double Top Threatens Reversal!👑 Gold's Critical Crossroads: Double Top Threatens Reversal! 📉
XAU/USD (4H Timeframe) Analysis
Gold has experienced a significant uptrend followed by a sharp reversal pattern, leaving traders to navigate a crucial period of consolidation and retesting. The chart highlights key supply and demand zones that will dictate the metal's next major move.
1. The Bearish Setup: Double Top and Key Zone Loss
The chart clearly shows that the bullish momentum stalled after hitting a high around 4400.
⚠️ The Double Top at 4400: This major bearish reversal pattern formed, indicating strong selling pressure at the top. The price couldn't sustain the breakout, leading to a swift decline.
📉 Breakdown of the 4000 Key Zone: After the double top, Gold lost the critical 4000 Key Zone, which previously acted as strong support (teal box). The price is now retesting this zone from below, confirming its transition into a resistance area.
🛑 4150 to 4250 (1st Resistance): This large red zone represents the first major overhead supply area. For bulls to regain confidence, they would need to conquer this zone, but it looks heavily defended for now.
2. Current Price Action and Support Levels
The price is currently consolidating below the 4000 resistance, forming a classic "descending triangle" or consolidation pattern.
🛡️ 3900 Immediate Support: The price is being held up by the 3900 immediate support level (green box). Holding this level is essential to prevent a further slide. A break below 3900 would likely signal more downside.
🎯 3800 to 3850 Next Support: This deeper green zone is the last line of defense for the current structure. This area aligns with the base of the previous major rally, making it a critical demand zone.
3. Trade Plan Scenarios
Bulls (Long):
Entry Trigger: A sustained breakout and candle close above the 4000 Key Zone.
Target: A retest of the 4150 to 4250 resistance area.
Bears (Short):
Entry Trigger: A confirmed breakdown and candle close below the 3900 Immediate Support.
Target: The next major demand zone at 3800 to 3850.
In summary, Gold is at a pivotal point. Traders should monitor the battle at the 3900 support and 4000 resistance for the next directional cue!
What do you think will happen next: will Gold hold 3900 or finally break above 4000?
Disclaimer:
The information provided in this chart is for educational and informational purposes only and should not be considered as investment advice. Trading and investing involve substantial risk and are not suitable for every investor. You should carefully consider your financial situation and consult with a financial advisor before making any investment decisions. The creator of this chart does not guarantee any specific outcome or profit and is not responsible for any losses incurred as a result of using this information. Past performance is not indicative of future results. Use this information at your own risk. This chart has been created for my own improvement in Trading and Investment Analysis. Please do your own analysis before any investments.

Sell Setup GoldHi All,
I hope everyone is doing fine and had good day yesterday and today as well. I am here with buy & sell setup. Whatever triggers first will see.
Note: All information is for only Educational Purposes
Check the screenshot for Sell Setup
Green Pips To All
Amen

XAUUSD Breakout Rally Underway — Parallel Channel RetestGold (XAUUSD) is showcasing a classic parallel channel breakout retest pattern that could propel prices higher toward the 4225+ zone in the coming sessions.
Over the past several days, price action has been neatly contained within a parallel channel, bounded by an upward-sloping support line and a steady resistance band. Each swing high and low respected this range, forming a strong structural base for a potential breakout setup.
Recently, the price managed to break above the resistance zone, confirming bullish momentum. This breakout came after a strong impulse move from the channel's support, pushing above the resistance with increasing volume and strength.
Now, the price is revisiting the previous resistance — which is expected to act as a new support. This type of breakout retest is a healthy sign of a sustainable uptrend. If buyers defend this zone, it opens the door for the next bullish leg.
Key Observations:
Support Zone: Around 4100 (former resistance now acting as support)
Resistance Turned Support: Confirming strength in the breakout
Pattern Height Projection: The earlier swing height projected from the breakout point gives a bullish target above 4225
Confirmation Needed: A bounce from the retest zone with a strong candle will confirm the next leg up
Possible Trading Strategy:
Entry: On confirmation candle after retest (e.g., bullish engulfing on 1H or 4H)
Targets:
Target 1: 4165
Final Target: 4225+
Stop Loss: Below 4085 (just under the retest zone)
In summary, the structure favors bulls as long as price holds above the 4100 support. The clean breakout and retest setup, backed by prior channel compression, indicates that XAUUSD is preparing for a fresh upside wave. Keep an eye on the confirmation candle — this move could offer a low-risk, high-reward setup in gold.

Will gold see $4,133 again?
After a few weeks of stagnation and correction, gold seems to be on a good upward trend.
Gold has the opportunity to see higher price numbers in the next few hours.
What do you think?
Support me, buddy!

XAUUSD – Bullish structure aiming for 4,218 FVG zone 🎯 Price has completed a clean liquidity sweep above 4,087, confirming that Smart Money has cleared the short-term highs before continuing higher. The market structure has now shifted bullish, showing clear intent to reach the imbalance zone between 4,157–4,218, where an important Bearish FVG / Supply block remains unmitigated.
The 4,017–4,020 Bullish Order Block below current price is the key mitigation area I’m watching for potential re-entry. If price retraces into this zone and confirms with a BOS up, I’ll be looking for longs targeting 4,087 first, then 4,157–4,218 as the main liquidity draw.
As long as price holds above 4,017, the short-term bias stays bullish. A clean break below that would shift focus back to lower liquidity levels near 3,980, where the next accumulation could form.
Overall, this setup reflects a classic liquidity grab → structure shift → FVG draw, and I’ll stay patient to let price confirm from the OB before engaging.✨
This is my personal view based on SMC principles – not financial advice. Like & Follow for daily updates.

Gold Is Back Online 11.10.2025~+ Data: recent Michigan Consumer & Inflation Miss
~+ CB: rates are on a downward trend long-term

XAUUSD 4D Market OutlookGold is holding steady around $4000 as the U.S. government shutdown, now in its 38th day, fuels safe-haven demand and keeps traders cautious. The lack of official economic data, including job reports, has forced investors to rely on mixed private indicators, adding to uncertainty.
Expectations for a Federal Reserve rate cut in December have grown, with the CME Fed Watch Tool showing a 67% chance, up from 60% last week. This shift, combined with a softer U.S. dollar and falling Treasury yields, continues to support gold prices. The dollar index slipped to 99.56, while the 10-year Treasury yield dropped to 4.09%, both adding tailwinds for the metal.
Physical gold demand remains weak in India due to high prices, while China’s commodity policy changes could influence the market indirectly.
Technically, gold remains in an uptrend, holding firm above key support levels between $3846 and $3720. The 52-week moving average at $3222 continues to act as major support. On the upside, resistance is seen near $4134, with a potential target of $4381 if that level is broken.
Overall, gold maintains a bullish tone above $4000, supported by expectations of lower interest rates and ongoing safe-haven demand. However, a clear breakout likely depends on progress in resolving the U.S. shutdown or stronger signals from the Federal Reserve about future policy moves.

Gold scalp sellsRisky Scalp sells respecting recent Supply level mitigated.
Please risk very little amount of acc. size cause am bullish on gold today

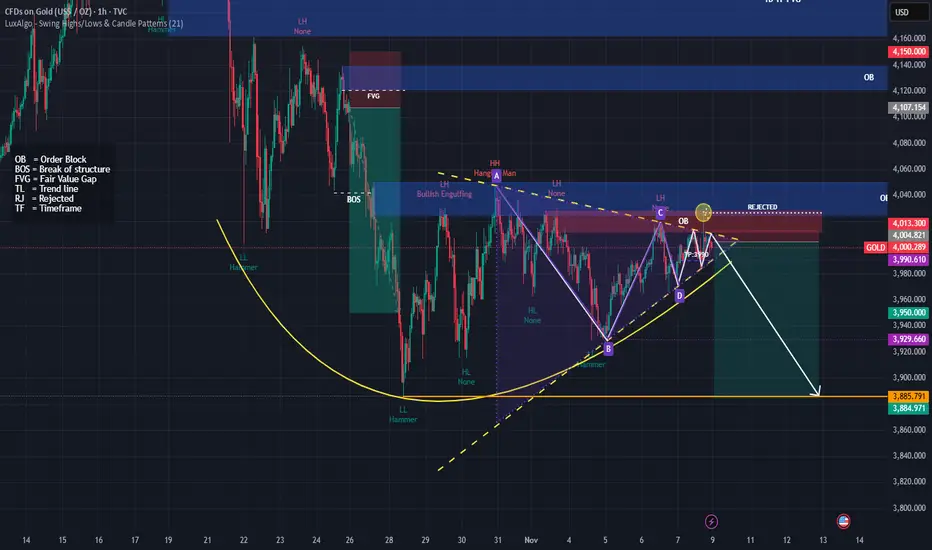
Rejected at (OB) $4013–$4020, next days 10th-14th target $3,885🧭 Overall Structure
The chart shows a potential bearish setup.
I have drawn a descending pattern (A-B-C-D) with rejection from an Order Block (OB) around $4,013–$4,020.
The white arrow projects a downward move toward 3,885.
🔍 Key Technical Elements
1. Order Blocks (OB)
Upper OB (~4,150–4,120): Higher timeframe supply zone; strong resistance if price rallies.
Current OB (~4,013–4,040): Recently rejected here — price reacted and failed to make a new higher high → confirms seller pressure.
2. Break of Structure (BOS)
A previous BOS occurred to the downside, suggesting bearish momentum took control after a temporary bullish leg.
3. Trend Lines (Yellow Dashed)
The upper TL connects lower highs → consistent downtrend.
The lower TL (support) was recently tested and might break soon — signaling bearish continuation.
4. Pattern
A–B–C–D harmonic-like pattern completed near the order block, often signaling a sell opportunity when it aligns with rejection zones.
Price formed a lower high (LH) at point C and another at D → confirms trend weakness.
5. Candlestick Rejection
“Rejected” and “Hammer” labels near point D and OB zone show failed bullish attempts → adds confluence for short.
🎯 Bearish Targets
TP1: 3,950 (nearest support)
TP2: 3,930 (previous low)
TP3 (Major): 3,885 (strong historical support zone)
⚠️ Invalidation
If price closes above 4,040–4,060 (OB zone), bearish setup invalidates.
That would mean liquidity grab and possible push toward 4,100–4,150 OB.
🧩 Summary
Bias Entry Zone Confirmation Targets Invalidation
Bearish 4,010–4,020 OB zone Rejection + lower high 3,950 → 3,930 → 3,885 Close above 4,060
XAU/USD Intraday Plan — 3989 Support Holding, Next Stop 4042?Price has broken above 3989 and pulled back to retest the 50MA, which is now holding as support. If bullish momentum continues, the 50MA looks ready to cross above the 200MA, which would strengthen the short-term bullish momentum.
The next resistance is at 4042. A clean break above 4042 could open the move toward 4090.
If buyers fail to hold above 3989, price may slide back into the First Reaction Zone (3957–3918).
Failure to hold that zone could bring the Support Zone and even the HTF Support Zone back into play.
📌Key Levels to Watch:
Resistance:
4042
4090
4142
Support:
3989
3957
3918
3884
3851
3820
3781
🔎 Fundamental Focus:
Not many high-impact releases today. We do have several FOMC members speaking, along with Prelim UoM Consumer Sentiment and Inflation Expectations later.
As always, keep in mind that geopolitical and broader macro sentiment continue to play a major role here — even with a quiet calendar, gold can still react to headlines.

The Gold Rush and Washington's Strategic MoveThe US OANDA:XAUUSD and OANDA:XAGUSD markets are experiencing an unprecedented boom, with demand up 58% in the last three months alone, precious metal ETFs attracting over $16 billion. But behind this wave of investment is not just a defensive sentiment against inflation or geopolitical risks, but also a deeper shift in the global resource power structure.
On November 6, the US Department of the Interior unexpectedly added copper, silver and metallurgical coal to its list of “critical minerals,” expanding the strategic scope of supply security. The list, updated every three years by the US Geological Survey (USGS), will serve as the basis for a new round of tariff reviews under Section 232, a legal tool that allows tariffs on national security grounds.
The move was seen by analysts as a clear political signal: Washington is increasingly viewing industrial and precious metals not just as commercial goods, but as strategic assets in global supply chain competition.
A Strategic, Not Just Commercial List
According to the USGS, the definition of “critical minerals” includes materials that are essential to the economy or national security, are vulnerable to supply chain disruptions, and have systemic impacts if they are not available.
Silver, a metal widely used in electronics, solar panels, jewelry, and investments, is the most notable case. Its inclusion on the list has caused market volatility: New York silver stocks hit record levels, while London markets saw short-term shortages. The United States currently relies on imports for nearly two-thirds of its silver needs, mainly from Mexico and Canada.
The addition of silver “is the start of a new policy cycle,” said Suki Cooper, an analyst at Standard Chartered, and if tariffs are imposed, it could reshape the global balance of supply and demand for precious metals. While some silver customs codes have been exempted, the political signals from Washington are enough to trigger a wave of speculation and hoarding.
From Minerals to Geopolitical Power
This is not a one-off change. The US administration, starting with Trump and continuing under Biden, is remaking mineral policy as part of its national security strategy.
From promoting domestic mining, to funding smelting projects, to using financial tools like tax credits and federal loans, Washington is trying to reduce its dependence on imports, especially from China, which now dominates many rare and industrial metals supply chains.
In addition to silver, elements such as lead, silicon, phosphate, uranium and rhenium were also added to the list, reflecting the US vision of a “transitional energy economy”. Meanwhile, elements with the highest risk of supply chain disruption, such as rhodium, gallium, germanium, tungsten and rare earths, remain in the “special priority” category.
The resource power structure is shifting, and the US clearly wants to reshape that order, starting with establishing a “self-reliant mineral ecosystem”.
Gold, silver and investor defense
In this context, the acceleration of the gold and silver markets reflects more than just traditional safe haven sentiment. The 58% surge in precious metals demand in the US shows that capital is shifting from financial assets to physical goods, a manifestation of concerns about the debt cycle, expansionary monetary policy and prolonged geopolitical volatility.
Precious metal ETFs recorded net inflows of $16 billion in the most recent quarter alone, while gold prices continue their relentless bull run. Gold and silver are being repositioned as “strategic assets”, not just temporary shelters.
Long-term impact
The US upgrade of its mineral policy represents a turning point in post-globalization industrial policy: not just to protect productive capacity, but also to create leverage in strategic competition with other economies.
If tariffs and financial support are implemented in a coordinated manner, the metals market could enter a prolonged bull market, with higher volatility and deeper fragmentation in global trade.
In the long run, this is not just a story about gold or silver prices, but about how the US reshapes the physical power base of the 21st century economy.
Technical outlook analysis OANDA:XAUUSD
After a strong rally from July to early October, gold prices have entered a correction and consolidation period around the $3,850–$4,000/ounce range. The daily chart shows a short-term bearish structure within a falling channel, but selling pressure is showing signs of weakening as prices hold above the 0.5 Fibonacci level at $3,846/ounce.
The RSI is moving sideways around the neutral level of 50, indicating that the bearish momentum has slowed down, while the short-term MA21 (around $4,055) is acting as important dynamic resistance. A decisive break above $3,973–$4,000 could be an early signal for a technical recovery towards the $4,120 (0.236 Fibo) range.
Conversely, if the price loses the $3,846 mark, corrective pressure could pull the price to the next support zone at $3,720 (Fibo 0.618), which corresponds to the medium-term bottom of the current price channel.
Overview:
Gold is in a consolidation phase after a long rally, with the range narrowing and awaiting a fresh catalyst from monetary policy or geopolitics. A compression phase before a breakout is likely, with lower risk for buyers if prices continue to hold above the $3,850 area.
SELL XAUUSD PRICE 4021 - 4019⚡️
↠↠ Stop Loss 4025
→Take Profit 1 4013
↨
→Take Profit 2 4007
BUY XAUUSD PRICE 3939 - 3941⚡️
↠↠ Stop Loss 3935
→Take Profit 1 3947
↨
→Take Profit 2 3953

GOLD ForecastGold has broken out of the descending channel, showing early bullish momentum. If price sustains above the breakout zone near 3,960–3,970, it may target the next resistance areas around 4,005 and 4,045. However, failure to hold above the breakout level could trigger a pullback toward 3,940 support. Bulls are gaining strength, but resistance levels remain crucial for confirmation of further upside.
"Thank you for your support! If you found this idea valuable or learned something new, please consider liking and leaving a comment. I’d really appreciate hearing your feedback and thoughts."

Today's gold trading strategyKey turning point breakthrough confirmed, technical pattern opens up the main upward space
The London gold price has firmly held at the 4000 US dollar integer level today. The current price is 4009.86 US dollars, having rebounded by over 45 US dollars from the intraday low of 3964.42 US dollars, forming a strong structure of "breakthrough + retracement + further advance". Three technical signals confirm the trend
① After breaking through the upper edge of the previous oscillation platform (3990 US dollars), the trading volume has increased by 78% compared to the previous period, and the proportion of active buying orders has risen to 65%, indicating strong fund support
② The MACD indicator on the daily chart remains in a golden cross, the red bar continues to expand, and the price has stabilized above the 5-day, 10-day, and 20-day moving averages, forming a "bullish arrangement" pattern
③ From the Fibonacci extension levels, after breaking through 4000 US dollars, the next target is directly at 4050 US dollars (1.618 extension level). Historical data shows that after the gold breaks through a key integer level, the probability of continuing to rise within 24 hours is 89%
Today's gold trading strategy
buy:4000-4010
tp:4020-4030
sl:3990

Gold’s $3,900 Base May Trigger Rally to Bullish TargetsFrom both a near-term and medium-term horizon, gold appears to have established a clear reversal base around the $3,900 level, indicating that the downside momentum has likely been exhausted and that the market is preparing to advance toward its bullish target levels.

The correction is over; buy gold on pullbacks.#XAUUSD TVC:GOLD OANDA:XAUUSD
With the White House website indicating the ongoing US government shutdown, the normal release of key data such as ADP and NFP may be affected. The news briefly boosted gold prices, leading to a technical rebound in Asian trading.
From the daily chart, the short-term resistance is still around 3980-4000, which is also where the 4H middle line is located. For the bulls to make a full comeback, they need to break through this resistance range and hold above 4000. The current slow and volatile upward trend in gold prices indicates that the bulls still have room to maneuver. In the short term, one can try to continue to be bullish on gold by using the middle line of the hourly chart as a defense. Conservative traders can wait for a pullback to 3970-3955 to try to go long on gold.

gold market daily projection gaze at 4170’sGold market sweeps through the 4100’s, reacting swiftly like a firefighter move, now setting pace on a daily candle formation that projects a bullish continuation toward the 4170’s. follow for more ideas , comment for more insights , and boost idea if you find it helpful

Gold Price Outlook – Trade Setup (XAU/USD)📊 Technical Structure
OANDA:XAUUSD Gold (XAU/USD) extended its advance, reaching $4,147–$4,156, its highest level in over two weeks. The structure shows a bullish bias as the price consolidates above $4,120, with buyers likely to defend the Support Zone at $4,105–$4,111.
The Resistance Zone at $4,147–$4,156 aligns with a short-term overbought area where some profit-taking may occur. However, as long as the price remains above the $4,111 support, momentum favours a continued push toward the upper boundary of the channel.
🎯 Trade Setup
Idea: Buy near support, targeting a retest of resistance at $4,150–$4,156.
Entry: $4,111 – $4,106
Stop Loss: $4,105
Take Profit 1: $4,147
Take Profit 2: $4,156
Risk–Reward Ratio: ≈ 1 : 6.53
A confirmed break below $4,105 would invalidate this setup and may trigger a correction toward $4,092.
🌐 Macro Background
Gold’s momentum remains firm, buoyed by rising Fed rate-cut expectations and soft U.S. labour data, even as the U.S. government shutdown nears resolution.
FXStreet’s Lallalit Srijandorn noted, “Gold extends gains toward $4,150 as weaker U.S. jobs data and dovish expectations lift investor sentiment.” 【FXStreet】
Labor Market Weakness: According to ADP data, U.S. private-sector job creation fell by an average of 11,250 jobs per week in late October — signalling a slowdown in labour demand after the firm previously reported gains. This reinforces expectations that the Fed could deliver another rate cut by year-end.
Fed Outlook: The CME FedWatch Tool indicates a 68% probability of a 25 bps rate cut in December, and nearly 80% odds by January 2026, supporting gold’s medium-term bullish tone.
Government Shutdown Update: Bloomberg reported that the U.S. Senate passed a temporary funding measure backed by centrist Democrats, expected to end the record-long shutdown. This could marginally reduce safe-haven demand but is unlikely to shift gold’s structural momentum, as macro risks persist.
Fed Speakers Ahead: Comments from Fed officials John Williams, Christopher Waller, Raphael Bostic, and others later today may offer further guidance on the December policy path. Any dovish tone could extend gold’s rally beyond $4,156.
In short, while the resolution of the shutdown could momentarily weigh on gold’s safe-haven appeal, soft employment data and high odds of a December rate cut remain powerful bullish drivers.
🔑 Key Technical Levels
Resistance: $4,147 – $4,156
Support: $4,106 – $4,111
Psychological Level: $4,150
📌 Trade Summary
Gold remains supported above $4,110, with strong upward momentum likely to retest $4,147–$4,156. A buy-on-dip strategy near $4,111–$4,105 remains preferred as long as support holds. The bullish bias persists while the Fed cut outlook strengthens.
⚠️ Disclaimer
This analysis is for reference only and does not constitute trading advice. Trading involves significant risk, and proper risk management is essential.

A reversal? No! Our bullish outlook remains unchanged!#XAUUSD OANDA:XAUUSD TVC:GOLD
Looking at the hourly and 4-hour charts, the technical indicators are diverging, indicating a need for a pullback correction. In the short term, it may test the 4115-4105 support level. Therefore, do not trade blindly in the short term, wait for the price to pull back to the support level before participating in long positions.

GOLDPreferably suitable for scalping and accurate as long as you watch carefully the price action with the drawn areas.
With your likes and comments, you give me enough energy to provide the best analysis on an ongoing basis.
And if you needed any analysis that was not on the page, you can ask me with a comment or a personal message.
Enjoy Trading ;)

GoldXAUUSD
- Completed " 123 " Impulsive Waves
- Break of Structure
- Order Block
- Demand Zone
- Fibonacci Level - 50.00% / 61.80%

Gold price rose, awaiting the majors data resumeThere were signs of a resuming US government, which could resume the major data release, especially in the labor market. The labor market has weakened recently, and private data indicate a contraction in companies being watched, driving investors to seek safe havens like gold. Besides, the central bank continued to accumulate gold, with a 28% annual growth in Q3, projected to reach above 1000 tons per year in the latest four years, supporting gold prices.
The XAUUSD briefly tested the 4150 level, with the Golden Cross EMAs signaling stronger bullish momentum. However, the price could hover around 4150 before breaching to test the next resistance at the 4200 level.
By Van Ha Trinh - Financial Market Strategist at Exness

GOLD (XAU/USD) – Intraday Technical Outlook | November 11, 2025Gold continues its strong bullish momentum, extending from the previous breakout structure on the H1 timeframe. The market has respected the ascending trendline, forming higher highs and higher lows, confirming short-term buyer dominance.
Currently, price is testing the resistance zone around 4147 – 4187, which aligns with a Fibonacci extension level and a potential exhaustion point from the recent impulse wave. Traders should pay close attention to price action signals within this area for possible reactions.
Key Technical Levels:
Resistance: 4187 – 4200 (Fib 1.618 & psychological zone)
Support: 4116 – 4130 (trendline + previous consolidation zone)
Trading Plan:
Scenario 1 (Bullish Continuation): If price sustains above 4147 with strong volume and bullish momentum, the next target will be 4187, followed by 4210.
Scenario 2 (Correction Setup): A rejection from 4187 could trigger a short-term pullback toward 4116, providing potential buy-the-dip opportunities along the trendline support.
Indicators Insight:
EMA Cluster (50–100): Still sloping upward, confirming bullish bias.
RSI: Near overbought region, signaling caution for late buyers.
Fibonacci 0.618 retracement: Lies near 4115, aligning with our first support zone.
Gold remains in an uptrend, but with price nearing key resistance, traders should manage risk carefully and wait for confirmation before entering.
Stay alert for volatility during the U.S. session and remember: reaction matters more than prediction.
Follow for more daily gold trading strategies and updates.
