Trade Idea: LONG XAUUSD Timeframe: 15M for trigger | Date: 27 No
Key Levels:
✅ Entry Zone 1 (Scalp): High Risk. Stop Loss: 4140
✅ Entry Zone 2 (Swing): Medium Risk. Stop Loss: 4122
Strategy: Await bullish confirmation (e.g., bullish engulfing, RSI divergence) within the specified zones. The 4122 level is critical for the overall bullish structure.
#Trading
Trade ideas

Gold (XAUUSD): Possible buy setup in 30m timeframeGold (XAUUSD): Possible buy setup in 30m timeframe. Pass is clear, be strict to my tp and sl, otherwise you won't get any profit.
Cheers


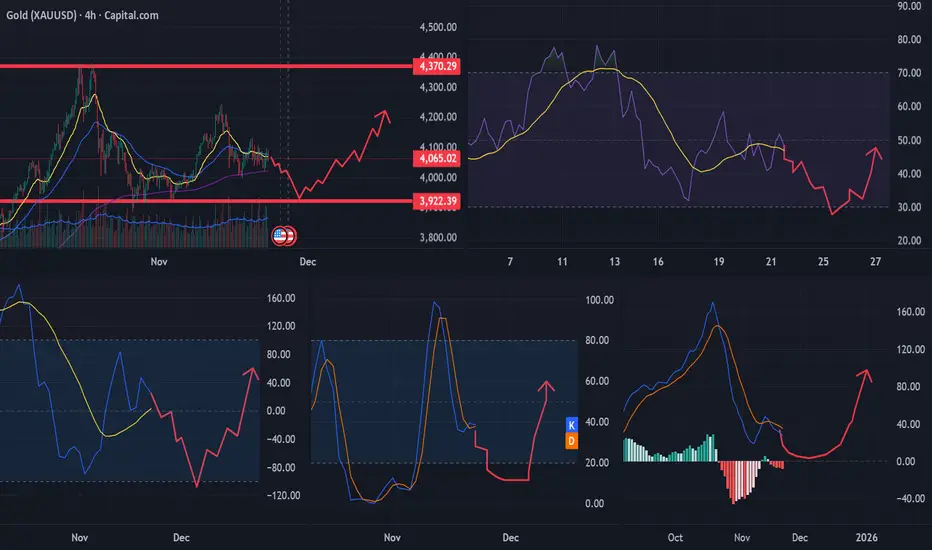
Gold Preparing for 3920–3950 Retest Before Bullish ContinuationMonthly timeframe (1M)
Gold historically spends 3–4 months in a consolidation or bounce range before continuing the macro trend.
After a parabolic move up, the current monthly candle shows a large top wick, signaling temporary buyer exhaustion – but the long-term trend remains firmly bullish.
Weekly timeframe (1W)
Price made a clean retest of the 20EMA, which is a textbook “healthy pullback” in strong uptrends.
RSI coming off the overbought zone with a mild bearish crossover.
CCI clearly trending down.
MACD showing the first signs of a potential rollover, but no confirmed bearish cross yet.
Overall: the weekly chart is in a bullish correction, not a reversal.
Daily timeframe (1D)
MACD is approaching the zero line, which rarely breaks below on gold during bullish cycles.
RSI near 50 – the typical lower boundary for bullish pullbacks.
CCI touched oversold once and looks ready for another retest.
Gold typically touches the 50EMA during corrections – which hasn’t happened yet.
Last daily candle closed above EMA20, but momentum is still weakening.
This strongly suggests a retest of the 3920–3950 zone (1D EMA50 area) before continuation.
4H timeframe
Price is currently fighting with the 20EMA and 50EMA.
The 200EMA was tested twice and held perfectly, supported by oversold conditions across:
RSI, CCI, MACD curl, and Stoch.
This signals quiet institutional buying on dips.
Final outlook
Most probable scenario:
Retest of 3920–3950 (1D EMA50 zone)
Trend remains strong on higher timeframes; lower timeframes are completing a healthy correction.
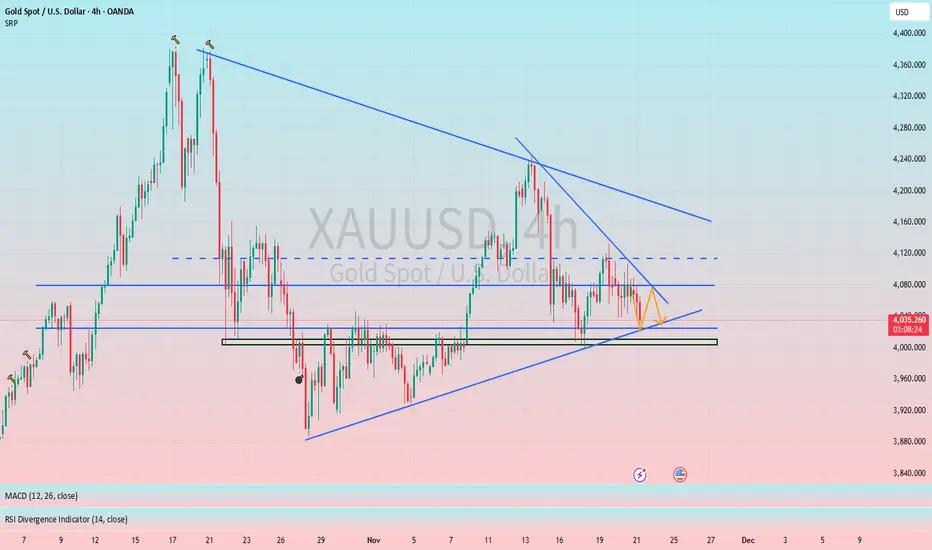
Breakout from a triangle pattern indicates a potential direction#XAUUSD OANDA:XAUUSD TVC:GOLD
From a trend perspective, gold is currently in a triangle consolidation range. As time goes on, the short-term resistance is also moving downwards. Therefore, gold did not provide us with a suitable opportunity to participate in trading last night. Gold is currently continuing its decline and may further test the 4025-4015 support level. If it pulls back to this level, we can consider a small long position in gold.
Going Long And Short Afterwards On GoldThis entire analysis is based on the five minute timeframe. Price broke the most recent support level, which had been a very strong support. After the second touch, the third touch finally broke through and price is now moving down toward the next support zone. I am anticipating a bounce from that next support level, pushing price back up toward the previous high that I have marked. From that high, I expect a sell off that takes price all the way down toward the low around four thousand fifty.

Gold Intraday Trading Plan 11/21/2025Yesterday gold didn't go up as expected it was hovering around 4050-4100. In lower TF, it's not making any decisive moves. Therefore, I will look for breakout today. If 4100 is broken, I will buy toward 4150. If 4050 is broken, I will sell towards 4000. However, I do see the downward momentum is getting stronger. Let's see what the market will present us.

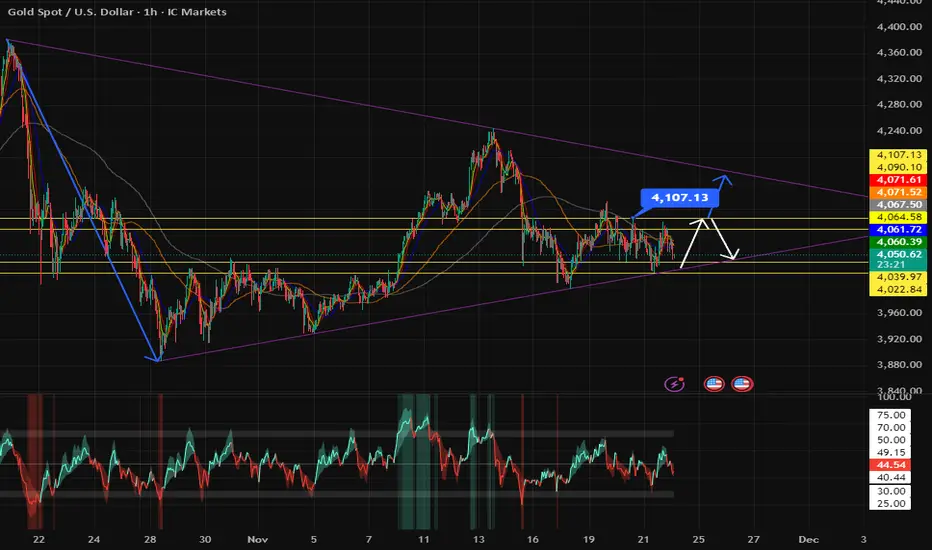
XAUUSD – H1 uptrend channel, short-term downside risk increasingXAUUSD – H1 uptrend channel, short-term downside risk increasing Brian – Prioritize short selling at the channel peak, wait to buy back at lower support
I. Strategy Summary Gold is trading in an uptrend channel on H1, but the rise around 4.160 shows signs of weakening, increasing short-term correction risk.
Preferred Scenario: Short sell at the channel peak 4.162–4.164, targeting support areas 4.145 – 4.130 – 4.115 – 4.100.
After the correction, the 4.100–4.080 area may become the foundation for the next rise in the larger trend.
Important price areas to watch: 4.139 – 4.127 – 4.110 – 4.088.
II. Macro Context & News 27/11
02:00 – Fed releases Beige Book This document updates the Fed branches' assessment of the US economic situation.
Describing slower growth, cooling price pressures will further reinforce expectations that the Fed will soon cut interest rates → supporting gold.
Conversely, if the Beige Book describes the economy as still “resilient,” the market may temporarily slow down pricing in rate cuts → causing a short-term adjustment for gold.
19:30 – ECB releases October meeting minutes
If the minutes lean towards the scenario of keeping high interest rates longer, the EUR may be supported, indirectly affecting the USD and gold inflows.
However, the impact is usually not as strong as US data, mainly affecting the overall risk-on/risk-off sentiment.
General Context: Gold has surpassed 4.160 USD/oz as the market increasingly expects the Fed to cut interest rates as early as December, reducing the appeal of interest-bearing assets and increasing the allure of gold – a non-yielding asset. This creates a support foundation for the medium-term uptrend, but after a hot rise, technical adjustments on H1 are normal.
III. Technical Structure – H1 uptrend channel
The price is within the H1 uptrend channel, with rising peaks and troughs, but the upper area near 4.160 coincides with:
The upper boundary of the price channel. The “Sell POC” area on the chart – where liquidity and sell orders are concentrated.
Preferred scenario on the chart: The price may slightly rebound to the POC area 4.162–4.164, then be rejected and slide to the important support area around 4.110 before extending the adjustment down to 4.100–4.080.
The lower trendline of the uptrend channel also acts as a short-term buy area if a clear candle reaction appears.
Notable price areas on H1: Resistance: 4.162–4.164 (channel peak + POC). Intermediate support: 4.139 – 4.127 – 4.110. Deep support: 4.088 – 4.080 – 4.100 (area that may form the bottom for the next rise).
IV. Trading Plan 1. Preferred Scenario – Short sell at the channel peak Idea: Short sell when the price rebounds to the upper boundary of the H1 uptrend channel and POC 4.162–4.164, expecting a correction to support.
Sell: 4.162–4.164 SL: 4.168 TP targets: TP1: 4.145 TP2: 4.130 TP3: 4.115 TP4: 4.100
This is a counter-move order in the uptrend channel, only targeting a short-term correction, not a major trend reversal scenario.
2. Supplementary Scenario – Short buy at support trendline Idea: When the price hits the lower trendline of the H1 uptrend channel and a nice candle reaction appears, consider a short-term buy according to the channel, prioritizing areas:
4.139 – 4.127 – 4.110 – 4.088
Specific Entry/SL levels will depend on the actual price reaction at the trendline, but the general principle:
Buy close to the trendline,
SL placed below the immediate support area,
TP aimed at the middle of the channel or the nearest resistance.
V. Risk Management & Notes
Do not open new positions right before or at the time of the Beige Book and ECB minutes release, as volatility may suddenly increase, widening spreads.
The sell order at 4.162–4.164 is a short-term counter-trend order in the uptrend channel, requiring moderate volume and strict adherence to SL 4.168.
If the price clearly breaks and holds above the 4.170 area, the H1 correction scenario weakens – in that case, stay out, wait for a new structure instead of trying to maintain a sell view.

Gold Short-Term Structure ObservationGold is moving within a steady upward structure after reacting from a previous demand zone. Price is now approaching an intraday support area, where it has shown multiple technical reactions in recent sessions. If the structure remains stable, the chart suggests potential continuation toward the upper range highlighted.
If you want, I can also make:

Gold Breaks Key Resistance, Eyes 4200 LevelSupported by rising rate-cut expectations, improving liquidity, and heightened geopolitical risks, gold has broken above the 4069–4076 resistance zone and reclaimed the 4100 level. The market is currently absorbing selling pressure around 4150. On the 1H chart, the key support levels are 4104–4096, followed by 4086. As long as these support zones remain intact, gold has a strong probability of continuing its upward move toward the 4200 region.
During the climb, monitor resistance at 4168 and 4187–4194. If price accelerates directly into the 4204–4213 band, the likelihood of a short-term pullback will increase, at which point support at 4188 and 4169 becomes critical.
On the daily chart, the structure can still be treated as a potential double-bottom formation, with the broader bias favoring the bulls. Trend supports lie at 4110, 4092, and 4067. If the pattern remains intact, the first upside target is 4220. Should gold stabilize above 4200 during volatility, extended targets are 4290, 4342, and 4366.

Gold Rebounds: 4100 Test Fails, Awaits RetryGold is in a rebound trend, attempting to break through 4100. The first breakout attempt failed, with prices pulling back to around 4090—awaiting fresh bullish momentum for another breakout
Buy 4080 - 4085
TP 4100 - 4110 -4120
Accurate signals updated daily. They serve as a reliable guide for trading issues – feel free to refer to them. Hope they help!

Gold price analysis November 24In the most recent session, gold continued to show signs of weakness when it failed to overcome the key resistance level of 4100. Profit-taking pressure appeared early and pulled the price back to the trendline - where the market is facing the risk of being broken if the selling pressure remains as it is. Once the trendline is broken, the short-term bullish structure will be completely broken and the correction range may extend to the deep support zone of 3935.
In this context, the most favorable strategy is to wait for the trendline breakout signal to trigger a SELL order, then follow the decline to the strong support zone of 3935.
Notable technical zones:
Support: 4040 – 4007 – 3935
Resistance: 4100 – 4145 – 5200
Recommended trading plan:
SELL when the price breaks the trendline around 4040
SELL DCA when the support of 4005 is broken
Target: 3935
Risk management: The bearish trend is invalidated if the candle closes back above 4100

Gold dailyGold, after previous declines, has created a foundation for a long-term upward trend in the global ounce. This safe-haven asset is expected to record new monthly highs again. However, for short-term analysis, from the current price of $4,056, we set a target of $4,100 to $4,120 for the coming week or the next ten-day period.
Sasha Charkhchian

XAUUSD: Market Analysis and Strategy for November 24thGold Technical Analysis:
Daily Resistance: 4145, Support: 4000
4-Hour Resistance: 4110, Support: 4022
1-Hour Resistance: 4085, Support: 4040
The weekly chart closed with a doji, putting pressure on short-term bullish sentiment. The consecutive doji closes on the daily chart suggest a slowdown in the short-term upward trend and exacerbate the expectation of consolidation. The upper Bollinger Band resistance continues to move downwards, and the price will need to focus on the 4040 level (the middle Bollinger Band) during the day. The next key level is 4000; a break below this level would warrant a short-term sell-off. If the price can recover above 4085 in the short term, a continued bullish trend is possible, with the 4140/4150 area as another resistance level to watch. Long-term holders can still look for buying opportunities around 3930/3920;
Looking at the 1-hour chart, gold rebounded after a decline in the European session, with the Bollinger Bands narrowing. The focus in the US session will be on the continuation of this rebound, with resistance levels around 4078 and 4092. The short-term range to watch is 4040-4100;
Trading Strategy:
BUY: 4040near
SELL: 4078~4085
More Analysis →

How to trade in a range-bound market?Gold remains in a wide-range trading pattern, with the daily chart closing with another doji candlestick. This pattern suggests continued range-bound trading. Today's strategy is to buy low and sell high, as there is still room and demand for further declines. The key resistance level to watch today is around $4098; sell on rallies near this level.
Gold maintains its wide-range trading structure. The daily/weekly charts show a tug-of-war between bulls and bears, with moving averages converging and the price hovering around the middle Bollinger Band. Gold will soon face a directional decision. From a technical perspective, after rebounding to the $4110 high and encountering resistance, gold has fallen again in a stepped pattern, and this area remains a significant resistance zone.
Key Levels:
First Support: 4040, Second Support: 4023, Third Support: 4004
First Resistance: 4090, Second Resistance: 4108, Third Resistance: 4130
Gold Intraday Trading Strategy:
BUY: 4026-4031, SL: 4010, TP: 4050-4060;
SELL: 4095-4100, SL: 4115, TP: 4080-4070;
More Analysis →
Gold May See a Minor Pullback Before Gaining Bullish Momentum📊 Market Update
Gold is currently trading around ≈ 4,050 USD/oz. A firm US Dollar is keeping gold from breaking higher, while markets await clearer signals from the Federal Reserve and upcoming US economic data. Cautious sentiment is keeping gold in a tight consolidation range.
📉 Technical Analysis
Resistance Levels:
• R1: ~ 4,100
• R2: ~ 4,135 (new resistance – recent swing high, strong selling pressure likely)
Support Levels:
• S1: ~ 4,020
• S2: ~ 3,995 – 4,000 (strong support, aligned with recent lows and trend validation)
EMA & Trend:
• Price is below the EMA 09, indicating slowing bullish momentum and short-term consolidation.
• If price moves back above EMA 09 on H1 → bullish momentum may resume.
Candles – Volume – Momentum:
• Narrow-range movement on H1/H4 → sideways market.
• Volume slightly lower → traders are waiting for a catalyst.
• Momentum is soft but no strong reversal signals yet.
________________________________________
📌 Market View
Gold may pull back to the 4,020 or 4,000 support regions before regaining upward momentum.
A weaker USD or negative US economic data could push gold upward again toward 4,100 – 4,135.
________________________________________
💡 Trading Strategy
🔻 SELL XAU/USD at: 4,090 – 4,093
🎯 TP: 40 / 80 / 200 pips
❌ SL: 4,096
🔺 BUY XAU/USD at: 4,023 – 4,020
🎯 TP: 40 / 80 / 200 pips
❌ SL: 4,017

XAUUSDThe knowledge has been shared with you guys.
Just do not enter blindly wait and watch the price reaction on our zones.
And than decide weather to buy or sell,
Keep following for guys

Elliott Wave Analysis XAUUSD – 21/11/20251. Momentum
D1:
The D1 momentum is contracting, signaling a potential reversal. If today’s candle confirms this, it will further support the continuation of wave Y.
H4:
H4 momentum has turned downward, so the expectation for today remains bearish movement.
H1:
H1 momentum is preparing to turn upward, suggesting a small corrective bounce. However, in the current context, price is likely to remain sideways within the 4046 – 4081 range.
________________________________________
2. Wave Structure
D1 – Higher timeframe
With D1 momentum preparing to turn down, the continuation of wave Y is reinforced.
But since momentum is near the oversold zone, two potential scenarios may unfold:
1️⃣ Strong decline:
A sharp drop may break 3888, opening the way toward deeper targets such as 3746.
2️⃣ Weak decline – Compression:
Price may continue down but fail to break 3888.
Once momentum turns upward again, a new trend could form.
________________________________________
H4 – Pattern outlook
The H4 structure remains unclear—price may still be in wave (3) or wave (2).
• If it is wave (3), strong bearish candles or a test of 4001 should appear.
• If price keeps moving sideways without breaking 4001 until H4 momentum reaches oversold, the current move is likely wave B of an ABC correction inside wave 2.
Based on the current depth of wave B, wave C is estimated to target 4175.
________________________________________
H1 – Lower timeframe
Wave 2 (green) is taking longer than ideal, but not enough to invalidate the current labeling.
The 4081 resistance is very strong and serves as our sell zone.
Below, the 4020 support is equally important:
• A sharp decline with H1 closing below 4020 may trigger a larger bearish continuation.
• Typically, price reacts with a bounce when it first touches this area.
________________________________________
3. Trade Plan
Sell Zone: 4073 – 4075
SL: 4093
TP1: 4020
TP2: 3958
TP3: 3885

Thanksgiving volatility is limited, precise strategy is key.#XAUUSD OANDA:XAUUSD TVC:GOLD
🙏Today is Thanksgiving, and the market will close early. Gold trading is likely to be quiet, and with insufficient liquidity, it is expected to continue to fluctuate within a narrow range.
📊However, as I said yesterday, core safe-haven demands such as the Fed's interest rate cut expectations and geopolitical factors continue to provide some support for gold prices, and the upward structure has not been broken. The holiday effect is simply limiting significant volatility. Pullbacks are all for building momentum for a subsequent bullish rally.
📈The short-term daily MA5 is moving upward, and the 4-hour moving average and Bollinger middle line are also around 4135, which together with 4125 below form short-term support. On the first pullback to the 4135-4125 area, you can consider a small long position. The key support level to watch remains unchanged at around 4115-4100, near the daily MA10. As long as this level holds, the market's bullish trend will remain intact.
🌈Regarding resistance, continue to focus on the 4170-4180 range, a breakout would lead to an attack on the 4195-4205 range.
✅In summary, our strategy remains unchanged: in the absence of data or news-related factors today, we will primarily focus on buying on dips and waiting for the market to provide opportunities to buy at lower prices.

Gold looking for longsI think the trendline will be broken , stops will be taken and then gold will start going down.
Let us see what next week is going to bring on.


Gold Sell SetupHi All,
Hope everyone is doing good.
Again with a small gold analysis (Just for educational purposes, no financial advice). Gold is looking little bearish and will take a chance to enter it and get green pips.
Enjoy

Gold remains bullish.Gold maintained its bullish structure, closing significantly higher on the daily chart. The New York closing price once again rose above the 10-day moving average (MA10) at 4105, with the 5-day and 7-day moving averages forming a golden cross and trending upwards. The RSI indicator is above the midline. On the shorter-term 4-hour and hourly charts, the Bollinger Bands are widening upwards, with the price maintaining its position in the upper half of the bands, and the moving average system showing an upward crossover. The trading strategy for gold remains unchanged from yesterday: prioritize buying on pullbacks to support levels, and only consider selling at higher levels.
At the Asian open today, gold experienced a rebound, reaching a high of 4144 before retracing. Currently, gold is still in a consolidating upward trend, and our overall bullish outlook remains unchanged. Gold is still developing within a narrowing triangle pattern on the daily chart, with the key level around $4150. A break above this level would open up further upside potential.
Key Levels:
First Support: 4108, Second Support: 4092, Third Support: 4074
First Resistance: 4150, Second Resistance: 4167, Third Resistance: 4183
Gold Intraday Trading Strategy:
BUY: 4085-4090, SL: 4070, TP: 4110-4120;
SELL: 4170-4175, SL: 4190, TP: 4150-4140;
More Analysis →
