Current Gold Trading Strategy
Current Gold Trading Strategy:
Today is Friday. As long as gold prices are pressured within the 4010-4020 range and remain below $4000, there is only one trading strategy: short at higher prices.
Current Trading Strategy:
SELL: 4000-4010
SL: 4020-4025
TP: 3980-3960-3930-3900
Trade ideas

GoldXAUUSD
- Symmetrical Triangle as an corrective pattern in Short Time Frame
- Break of Structure
- RSI - Divergence
- Completed " 12345 " Impulsive Waves and " ABC " Corrective Waves
- Change of Characteristics

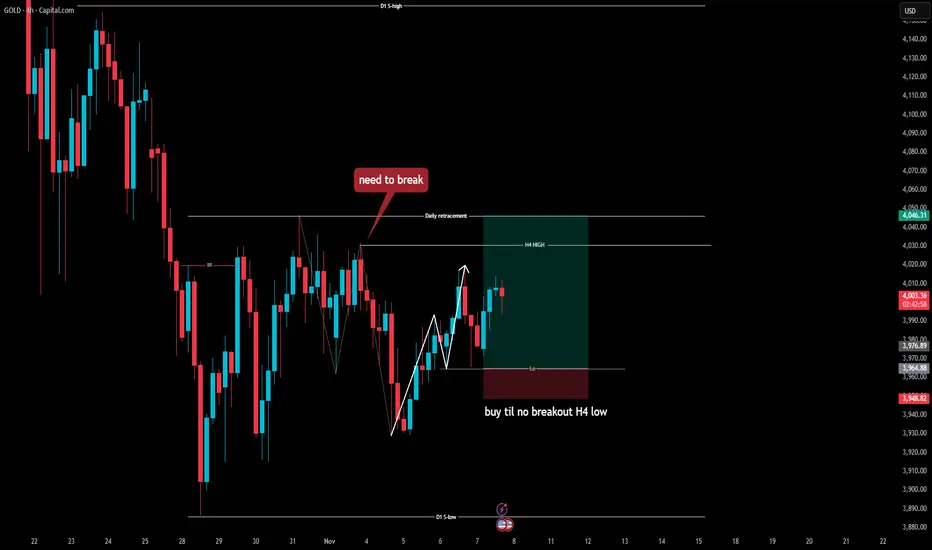
GOLD SWING SETUPGold is currently showing indecision on the H4 timeframe.
Within its internal structure, price is forming an uptrend, suggesting a possible reversal from the previous downtrend pattern.
If momentum continues, gold may break the reversal structure and align with the major uptrend.
The target area for this move is around 4050, where a new major uptrend formation could develop.
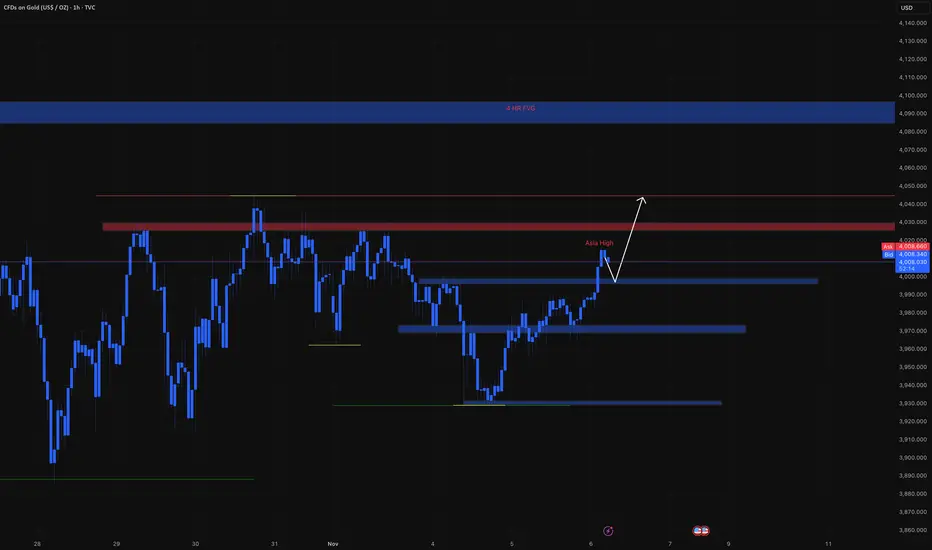
LONG ON GOLD XAU/USDGold has swept sell side liquidity and has given us a choc (change or character) to the upside.
There is tons of buyside liquidity to the upside with huge FVG's (Fair value gaps) and equal highs (double top) that need to be mitigated.
I am buying gold looking to catch over 200-300 points.
That's 2000-3000 pips.

GoldXAUUSD
- Symmetrical Triangle as an corrective pattern in Short Time Frame
- Break of Structure
- Order Block
- Change of Characteristics
- RSI - Divergence

XAUUSDPrice Action Trading is a method of financial market analysis where traders make buying and selling decisions solely based on the asset's price movements over time, without relying on technical indicators.
It's essentially the art of reading a "naked" or clean chart to understand the psychology and behavior of market participants.

XAU/USD (Gold) 1H: Bullish BOS & Supply Zone Testthe price of Gold attempting to move higher after a significant drop earlier in the week. The key elements highlighted are:
Current Price Action: The price is currently trading around $3,987.20 and is testing a key resistance zone.
1H Supply Zone: A supply zone is identified between roughly $3,990 and $4,000. This area represents a concentration of selling pressure.
Break of Structure (BOS): There are multiple "BOS" labels, which indicate a Change of Character (CHoCH) or continuation of the trend.
The recent upward move has caused a BOS just below the supply zone, signaling an immediate shift towards bullish momentum.
1H Order Block (OB): A bullish Order Block (OB) or demand zone is identified at the bottom of the recent move, roughly between $3,930 and $3,950. This is a likely area for buyers to step in if the price retraces.
Stop-Loss Hunt (SSS): The "SSS" (likely standing for Sell-Side Liquidity or Stop-Loss Sweep) indicates an area of liquidity that could be targeted before the price moves up.
Bullish Scenario: The large arrow suggests a strong bullish expectation. The price is anticipated to break through the immediate 1H Supply zone (breaking the BOS at the high) and continue moving higher, potentially targeting levels above $4,040.

GOLD Bullish ContinuationGOLD Bearish Continuation
Based on 1 hour trend reversal
Im only writing this because trading view wants more of a description
Gold is about to dropIf you trading GOLD SHORT SET UP BEEN FORMED,once this daily supply🟤 come into play nothing will stop it to drop

GOLD How to Trade the XAUUSD Range Breakout StrategyLet's cut straight to the chase on Gold (XAU/USD). Right now, the chart isn't giving us much to work with. We are locked solid in a textbook range-bound environment. 😒
If you compare this choppy, sideways action to the clear trends we've seen previously, the difference is stark. There is simply no directional conviction in the market at the moment; we're witnessing classic accumulation/distribution—or just plain indecision.
My focus is simple: Patience is your edge right now. I'm not interested in getting chopped up inside this consolidation zone. We are waiting for a concise, decisive move—a clean breakout—either above the high or below the low of this current range.. and a retest of the range. ⬆️⬇️
Bullish Scenario: A breakout above, followed by a successful re-test and fail. That's our green light for a long position, signaling momentum has shifted North. 🚀
Bearish Scenario: A breakdown and re-test of the range. That's the cue for a short opportunity, confirming bearish momentum. 📉
The breakout and re-test confirmation will be key. Until then, I'll stand aside and preserve capital. No setup, no trade. 🔥

Candle Range Theory (CRT) Predicts Major Drop to BTLhe market just executed a perfect high-timeframe manipulation play right at a key institutional zone! This setup screams Distribution phase according to the CRT model.
🔑 The CRT Breakdown:
The Accumulation/Range Phase: Price consolidated horizontally below the 4h Bearish FVG, creating a clear range and collecting liquidity.
The Manipulation Phase (The Sweep): We saw the classic "False Breakout" above the range, perfectly sweeping the Buy-side Liquidity (BSL) just below the strong Bearish FVG 4h level ($4,024 area). This move trapped late-movers into long positions. 🎣
CRT Confirmation Candle: The subsequent candle action gave us the marked "Thick closure candle to scare bulls". This is the market's confirmation that the manipulation is complete and the directional move is about to start, using the volume/range from that candle to define intent.
The Distribution Phase (The Drop): Price is now breaking down, effortlessly slicing through the smaller FVGs (Fair Value Gaps) below $4,005. This shows clear displacement and an imbalance in supply. 🌊
🎯 The Target:
With the high-level sweep complete, the market is now magnetised to the next major pool of liquidity: the BTL (Buy-side Trapped Liquidity), which is the clear low on the 4h chart near $3,927.16.
If the $4,000 psychological support breaks decisively, expect a fast move down to clear that BTL!
Risk Management is Key! Protect capital as the $4k level can be volatile.
Bias: Strongly Bearish
Entry Confirmation: Clean close below the $4,000 zone.
Target: BTL at $3,927.16
What's your take? Is $4,000 the final defense line? Let me know! 👇
Greetings,
MrYounity

Gold Weekly Summary and Forecast 11/1/2025Gold closed the month with a green bar which signals the bullish run is not over yet. From monthly TF, I am expecting the price to test 78.6% Fibo level and rise up to previous ATH at 4380 at least for the month of Nov.
Weekly candle is not showing bullish continuation yet, as it's still printing a red candle. From daily, the hanging red candle is also suggesting a drop is coming. Therefore, I am expecting a initial drop to 3940 and rise from there at the later stage of next week.
let's see what the market will provide.

Gold: Consolidation trend remains unbrokenGold has just tested the 4020-4030 resistance zone, only to pull back under pressure and retrace. This indicates that the resistance zone remains effective today. With the non-farm payroll data not being released, gold prices are expected to continue their sideways trend.
From the 4-hour chart perspective, focus on the short-term resistance at 4020-4030. The key pivot point for bull-bear dynamics lies at 4045-4055. For support levels, watch the short-term zone at 3960-3970, with critical attention on the previous low support at 3888-3890.
Our trading strategy, which was provided this morning, has already been validated by the market. We still recommend prioritizing short positions on rebounds for now, and caution against chasing the trend.

What Happens Next?I believe that the third wave has ended on the daily and weekly charts and that we are currently in the fourth corrective wave. I tried to draw the details of the correction on the 4-hour chart. The correction we are in may not be a classic correction and may be more complex; however, the B movement we are in appears to be forming a symmetrical triangle, and with the 6th movement, these triangles may break down or up; that is, the direction is unclear. However, if we are within an A-B-C correction and B is currently forming, a downward C movement is likely to follow. If there is no daily stay above 4040, the C downward movement is highly probable. I have also indicated C's first target on the chart. These are not recommendations, but my own conclusions.

GOLD: 8.000Hi guys, I leave this channel here just to see in the coming decade if pattern will be the same as in post '80 bubble.
Nothing new, I still "believe" gold could raise to 8.000$ (6k or 10k doesn't matter, will be the same), it's just a 100% move from here, if QE start and Fed print money into a market that has no problem (because companies have revenue), well i thing everything will skyrocket.
I wait this level to sell all my necklaces, nothing more than this, I prefer long the stock market than invest into gold, for now.
Let's see.

Nov 7, 2025 - XAUUSD GOLD Analysis and Potential Opportunity📊 Analysis:
Yesterday’s close didn’t provide a clear directional signal.
For now, my plan is to build positions around the 4000 level —
Above 4000, I’ll look to buy pullbacks into support.
Below 4000, I’ll sell rallies into resistance.
A break below 3990 would confirm stronger bearish momentum,
while a break above 4010 would suggest that bullish strength is returning.
🔍 Key Levels to Watch:
• 4030 – Resistance
• 4020 – Resistance
• 4012 – Resistance
• 4000 – Bull–bear pivot zone
• 3990 – Key support
• 3971–3980 – Support zone
• 3964 – Support
• 3956 – Support
📈 Intraday Strategy:
SELL: If price breaks below 3990 → target 3985, with further downside toward 3980, 3975, 3970
BUY: If price holds above 4004 → target 4010, with further upside toward 4014, 4020, 4030

Gold / shortBy breaking d wedge of a triangle, I think price may revisit the last low to form W5 of C.

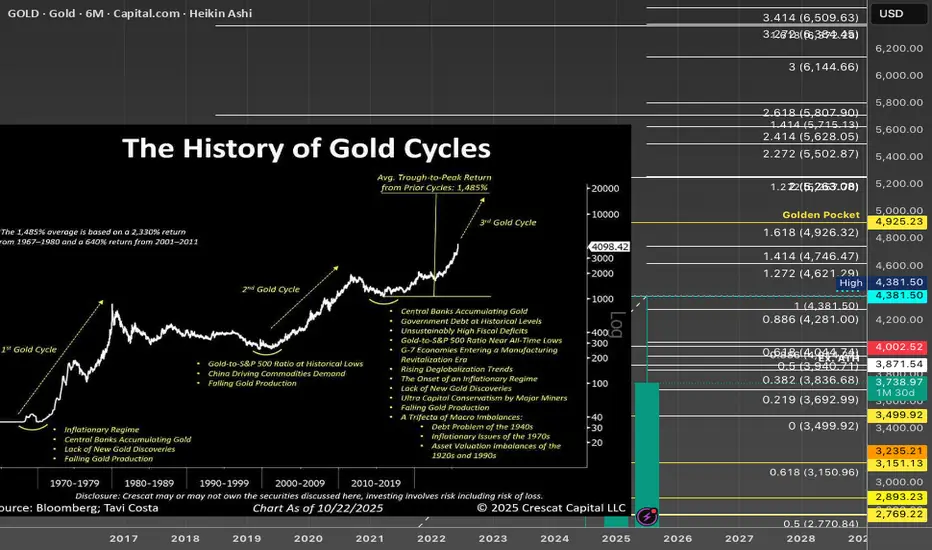
History of Gold Cycles Chart - Inspiration After doing the weekly rounds and reads I came across a post that had this great chart by Crescat Capital. The simple breakdown provides a clean overview from then until now, which for me makes who the Gold market my easier to digest and cut the noise.
Xaausd planHello! Shorttime plan is finished.
1h timeframe:
We have a FVG that must fills around price 3980.
This is smart money concept.
Let price go down to FVG(support), wait for a confirmation, like a bullish engulfing, hammer candle.
Maybe the last time xauusd going down to 3980 before is go higher to 4060-4100
Entry: 3980-3990
Sl: 3965-3975
Tp1: 4030
Tp2: open to maximize, move sl to breakeven after tp1 hit and close manually later.
Are you bullish on gold?

GOLD | Bearish Momentum Holds Below Pivot Zone GOLD | Bearish Momentum Holds Below Pivot Zone
Gold remains under bearish pressure as it trades below the pivot zone at 4,034–4,053, signaling continued weakness amid cautious sentiment ahead of upcoming U.S. data.
🕯 Momentum remains negative, but a breakout above the pivot zone could quickly shift the tone back to bullish.
Key Levels
Pivot Zone: 4,034 – 4,053
Resistance: 4,082 · 4,105 · 4,189
Support: 4,004 · 3,982 · 3,921
Trading Plan:
Sell Setup: Shorts valid below 4,038, targeting 4,004 / 3,982 / 3,921.
Buy Setup: Longs valid only above 4,053, targeting 4,105 / 4,152.
Premium Takeaway
Gold remains in bearish control below 4,053, with potential to drop toward 3,982–3,921.
A confirmed 1H close above 4,053 would shift bias to bullish, opening the path toward 4,105–4,189 in the short term.

Gold has corrected about 10% from its recent highGold has corrected about 10% from its recent high after a strong rally earlier this year.
However, the long-term trend remains bullish, suggesting that the market may move sideways for a while to consolidate before the next upward leg begins.
In the short term, gold still has room for a technical rebound, with key resistance levels at
$4,080 / $4,135 / $4,190 per ounce.
If prices drop below $3,900, investors should be cautious —
a deeper correction could follow, potentially testing the next major support zone near $3,550–$3,600.
“Gold remains in a long-term uptrend. This pullback may simply be a pause — not the end of the rally.”

Gold bulls are strong; is 4100 still far away?
News:
Gold rallied after testing the 3915 area again, breaking through resistance levels at 3975-80 and 4030 throughout the day, closing with a large bullish candlestick and forming a bullish engulfing pattern.
This morning, it rose to around 4046 before falling back and breaking below the key support/resistance level of 4005-10.
Technology manifestation:
From the 1-hour chart, the current short-term resistance level to watch is 4035-4030, with a key resistance level at 4060-4055. If this area is broken, the gold price may reach 4100. The short-term support level to watch is 3960. The recommended strategy is to buy on dips, and to observe more and trade less in the middle, avoiding chasing the market and patiently waiting for key entry points.
I will provide specific operational strategies in the channel, so please pay attention.
Trading strategy:
Buy:3989-3986, SL: 3975, TP: 4010-4020-4030

Lingrid | GOLD Weekly Support Zone: Short Term Upside MoveOANDA:XAUUSD is approaching the weekly support area near 3,880, suggesting a short-term bullish impulse might be formed within the downward channel. Price action now moved below the 4,050, which aligns with prior breakdown structure and acts as a potential resistance level. As long as price sustains above 3,880, buyers may push toward 4,050 before meeting stronger resistance. Potential rejection near the lower channel boundary may hint at a corrective recovery phase gaining traction.
⚠️ Risks:
Federal Funds Rate decision on could reignite bearish momentum.
Rising Treasury yields may suppress gold’s short-term recovery potential.
Failure to hold above 3,880 would invalidate the short-term bullish scenario.
If this idea resonates with you or you have your own opinion, traders, hit the comments. I’m excited to read your thoughts!
