Trade ideas

Current Gold Trading Strategy
Current Gold Trading Strategy:
Today is Friday. As long as gold prices are pressured within the 4010-4020 range and remain below $4000, there is only one trading strategy: short at higher prices.
Current Trading Strategy:
SELL: 4000-4010
SL: 4020-4025
TP: 3980-3960-3930-3900

GoldXAUUSD
- Symmetrical Triangle as an corrective pattern in Short Time Frame
- Break of Structure
- RSI - Divergence
- Completed " 12345 " Impulsive Waves and " ABC " Corrective Waves
- Change of Characteristics

GOLD: 8.000Hi guys, I leave this channel here just to see in the coming decade if pattern will be the same as in post '80 bubble.
Nothing new, I still "believe" gold could raise to 8.000$ (6k or 10k doesn't matter, will be the same), it's just a 100% move from here, if QE start and Fed print money into a market that has no problem (because companies have revenue), well i thing everything will skyrocket.
I wait this level to sell all my necklaces, nothing more than this, I prefer long the stock market than invest into gold, for now.
Let's see.

GoldXAUUSD
- Symmetrical Triangle as an corrective pattern in Short Time Frame
- Break of Structure
- Order Block
- Change of Characteristics
- RSI - Divergence

XAUUSDPrice Action Trading is a method of financial market analysis where traders make buying and selling decisions solely based on the asset's price movements over time, without relying on technical indicators.
It's essentially the art of reading a "naked" or clean chart to understand the psychology and behavior of market participants.

GOLD Bullish ContinuationGOLD Bearish Continuation
Based on 1 hour trend reversal
Im only writing this because trading view wants more of a description
Gold is about to dropIf you trading GOLD SHORT SET UP BEEN FORMED,once this daily supply🟤 come into play nothing will stop it to drop

GOLD How to Trade the XAUUSD Range Breakout StrategyLet's cut straight to the chase on Gold (XAU/USD). Right now, the chart isn't giving us much to work with. We are locked solid in a textbook range-bound environment. 😒
If you compare this choppy, sideways action to the clear trends we've seen previously, the difference is stark. There is simply no directional conviction in the market at the moment; we're witnessing classic accumulation/distribution—or just plain indecision.
My focus is simple: Patience is your edge right now. I'm not interested in getting chopped up inside this consolidation zone. We are waiting for a concise, decisive move—a clean breakout—either above the high or below the low of this current range.. and a retest of the range. ⬆️⬇️
Bullish Scenario: A breakout above, followed by a successful re-test and fail. That's our green light for a long position, signaling momentum has shifted North. 🚀
Bearish Scenario: A breakdown and re-test of the range. That's the cue for a short opportunity, confirming bearish momentum. 📉
The breakout and re-test confirmation will be key. Until then, I'll stand aside and preserve capital. No setup, no trade. 🔥

XAU/USD – Ahead of U.S. Data: Continuation or Reversal?🌐 MARKET CONTEXT
The gold market is currently navigating a juncture of competing forces: on one hand, the continuing expectation of central bank pivoting and safe-haven demand; on the other, risks from a stronger U.S. dollar and higher real yields. For instance, recent commentary highlighted that gold broke above ~US$4,074-oz amid weak U.S. data and growing hopes of a Fed rate cut.
OneRoyal News
+2
ODI: Think change
+2
Additionally, the milestone of gold surpassing US$4,000 per ounce has underlined both its strong momentum and the questions about whether this is a sustainable trend or ripe for a pullback.
World Gold Council
+1
From a sentiment standpoint:
The risk-on component: if data disappoints, gold could rally further.
The risk-off / hawkish policy risk: if inflation or jobs data surprise to the upside, the dollar and rates may rise, weighing on gold.
For the upcoming London → New York sessions, focus is on how gold reacts around major technical zones, and whether price structure shows continuation or reversal.
Thus, the bias today is conditional bullish, leaning long on confirmed demand zones, but ready to flip to bearish if supply zones trigger rejection.
📉 TECHNICAL ANALYSIS (SMC + Liquidity Structure)
The price is in a broader up-trend (following the breakout above key resistance zones) but is now entering high-probability structural decision zones.
We have clear Supply and Demand zones:
Some prior Resistance turned Support zones around ~4,021-4,074 (per recent reports) act as demand/higher-probability buy areas.
OneRoyal News
+1
A supply zone around ~4,080 and above is noted as a target and potential reversal area if momentum falters.
OneRoyal News
+1
Regarding SMC confirmations: look for liquidity sweeps (stop-loss hunts), fake BOS (Break of Structure), or mitigation before entering. A clean confirmation before a trade increases probability.
Example: If price rises into 4,080-4,078 and then sweeps above 4,086 then reverses, that may signal a “trap buy and sell” scenario (structure break then reversal). Conversely, if price dips to 3,990-3,988 or 3,930-3,928 and shows a sweep of liquidity then a strong bullish candle, we may have a CHoCH and continuation long.
🔑 KEY PRICE ZONES
4,080–4,078 ▶️ Sell Zone – High-probability supply nearest to session high, look for rejection.
4,161–4,163 ▶️ Buy Zone – A higher demand zone / breakout target area acting as strong structural bounce.
4,081–4,083 ▶️ Buy Zone – Demand zone near current structure, reactive long setup if confirmed.
3,990–3,988 ▶️ Buy Zone – Deep demand/support zone for larger reversal potential.
Stop-loss levels:
Sell stop-loss: 4,086
Buy stop-loss (4,161 zone): 4,155
Buy stop-loss (4,081 zone): 4,075
Buy stop-loss (3,990 zone): 3,982
⚙️ TRADE SETUPS
✅ BUY SCENARIO 1 – STRUCTURAL SUPPORT HIGH TARGET
Entry: 4,161–4,163
Stop-loss: 4,155
TP1: ~4,180 TP2: ~4,210 TP3: Open
Logic: A breakout into this zone or strong bounce from it would indicate continuation of bullish momentum and structural demand dominance.
✅ BUY SCENARIO 2 – MID-STRUCTURAL DEMAND
Entry: 4,081–4,083
Stop-loss: 4,075
TP1: ~4,100 TP2: ~4,135 TP3: Open
Logic: A reactive long setup if price pulls back to this zone and confirms demand (liquidity sweep + bullish candle). Good London session focus.
✅ BUY SCENARIO 3 – DEEP SUPPORT ACCUMULATION
Entry: 3,990–3,988
Stop-loss: 3,982
TP1: ~4,020 TP2: ~4,060 TP3: 4,100+
Logic: Larger-scope reversal zone, ideal if price falls into this area and shows structure change (CHoCH) from bearish to bullish.
⚠️ SELL SCENARIO – SESSION SUPPLY REJECTION
Entry: 4,080–4,078
Stop-loss: 4,086
TP1: ~4,040 TP2: ~3,990 TP3: ~3,930
Logic: If price rises into this supply zone and shows rejection (e.g., wick up, reversal candle) then expect a short. Especially potent during New York session when liquidity is high.
🧠 NOTES / SESSION PLAN
Prioritize confirmation: don't enter solely on touching zone — wait for structure (M5/M15) and liquidity event.
London session: likely focus on BUY setups (4,081 zone, 3,990 zone).
New York session: monitor for the SELL setup at 4,080–4,078 if price approaches.
Monitor macro data releases (U.S. inflation, job numbers) which could provoke volatility and invalidate setups.
Risk management: each trade should respect stop-loss and maintain risk ≤2% of account; trail stops once TP1 hits.
Avoid chasing after large rapid moves; allow the market to structure into zones rather than predicting broken conditions.
🏁 CONCLUSION
The bias for today: bullish conditional — we favour buys on confirmed demand zones (4,161–4,163; 4,081–4,083; 3,990–3,988) but remain alert for a bearish reversal if price exhausts into the supply zone around 4,080–4,078 with clear rejection. Today’s structure offers a wide range of actionable zones; success will depend on discipline to wait for confirmation and managing risk strictly.

$Gold / $XAU trade: +1.5R profit! As I shared public analysis on TVC:GOLD / TVC:XAU last Friday before market close, I took that trade on my funded account.
Currently up around +1.6R profit booked partial profits and moved stoploss to breakeven.

Idea on GOLDGold price settles above $4000 as safe-haven demand strengthens on U.S. shutdown and weaker dollar outlook.
Bulls defend the 50-day moving average at $3878.45, keeping gold's short-term bias tilted to the upside.
Technical breakout above $4046.60 could trigger a run toward $4133.95–$4192.36 resistance zone.uncertainty around the delayed U.S. non-farm payrolls report — a result of the shutdown standoff — helped renew safe-haven demand, especially after private sector data showed job losses in October. Traders are now pricing in a 66% chance of a December rate cut, according to CME Group’s FedWatch Tool. That dovish repricing, alongside softening Treasury yields, is helping underpin gold despite broad risk aversion.

XAUUSD triangle correction probably have completedthe recent upthrust probably completed wave c hence the last wave (z).
it is an alternative analysis.

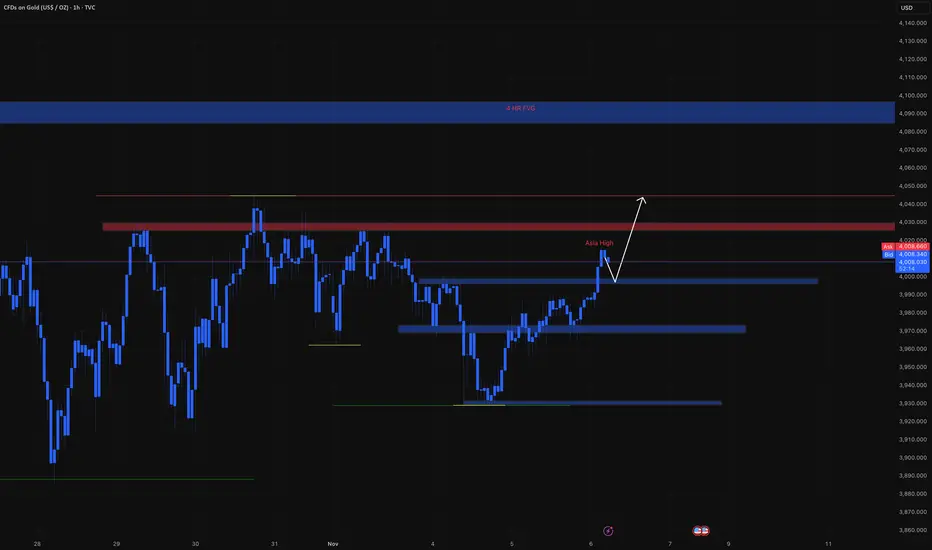
XAU/USD Gold analysis week 2 of NovGOLD Weekly Outlook
This week, I’ll be going through two possible directional biases for gold and how price could play out from current levels.
- Scenario (A):
Price could continue pushing upwards to mitigate the 2hr supply zone, where we may then see a Wyckoff distribution form before a potential move down to set a bearish trend. This aligns with the liquidity resting below and the unmitigated demand zone beneath.
- Scenario (B):
Alternatively, price could tap into the 7hr demand zone, where a Wyckoff accumulation could take place — giving us a buying opportunity to target the liquidity above.
P.S. Always stay adaptable and avoid marrying your analysis. Let the market show its hand, then make your move accordingly — the trend is your friend!

Gold Market Direction Gold is still in bear market 📉 and now is just making a ranging pullback.
This week is done making a big move but next week we will definitely see a huge drop 📉 of no new trend changes to kill the drop.
But now we still having bearish market.
My strategy for market direction is work amazingly well and no mistakes made hence brokers are failing to catch me.
Gold is still a bearish market. Now they want to trap the buyers.
Sell the market if you see any opportunities or text for any information.
Gold has corrected about 10% from its recent highGold has corrected about 10% from its recent high after a strong rally earlier this year.
However, the long-term trend remains bullish, suggesting that the market may move sideways for a while to consolidate before the next upward leg begins.
In the short term, gold still has room for a technical rebound, with key resistance levels at
$4,080 / $4,135 / $4,190 per ounce.
If prices drop below $3,900, investors should be cautious —
a deeper correction could follow, potentially testing the next major support zone near $3,550–$3,600.
“Gold remains in a long-term uptrend. This pullback may simply be a pause — not the end of the rally.”

Nov 7, 2025 - XAUUSD GOLD Analysis and Potential Opportunity📊 Analysis:
Yesterday’s close didn’t provide a clear directional signal.
For now, my plan is to build positions around the 4000 level —
Above 4000, I’ll look to buy pullbacks into support.
Below 4000, I’ll sell rallies into resistance.
A break below 3990 would confirm stronger bearish momentum,
while a break above 4010 would suggest that bullish strength is returning.
🔍 Key Levels to Watch:
• 4030 – Resistance
• 4020 – Resistance
• 4012 – Resistance
• 4000 – Bull–bear pivot zone
• 3990 – Key support
• 3971–3980 – Support zone
• 3964 – Support
• 3956 – Support
📈 Intraday Strategy:
SELL: If price breaks below 3990 → target 3985, with further downside toward 3980, 3975, 3970
BUY: If price holds above 4004 → target 4010, with further upside toward 4014, 4020, 4030

XAUUSD Bear Cycle has started and this is why according to VIX.Gold (XAUUSD) closed 2 straight red weeks, which last did on June 23. Despite this pull-back, it remains within a Channel Up since the October 31 2022 Low, which was essentially when the Bear Cycle ended and the new Bull Cycle (Channel Up) started.
The previous Bull Cycle topped around 4.5 months after the Volatility Index (VIX) shown in blue, peaked during the March 2020 COVID flash crash.
We are now on a similar situation as VIX topped on the week of March 31 2025 during the Trade War and has since started to decline aggressively. Gold's current top was 6.5 months after VIX's top. Even the 1W RSI sequences between the two Bull Cycles are similar, further raising the degree of their high symmetry.
According to this correlation, Gold may has already formed its Bull Cycle Top 3 weeks ago and could be starting a new +2 year Bear Cycle.
As far as a Target and Bottom is concerned, the previous Bear Cycle almost hit its 0.382 Fibonacci retracement level three times throughout the Cycle, until it broke below it marginally for its September - October 2022 bottom.
As a result, we are looking for the 0.382 Fib yet again as our focal point which is currently around $3000.
-------------------------------------------------------------------------------
** Please LIKE 👍, FOLLOW ✅, SHARE 🙌 and COMMENT ✍ if you enjoy this idea! Also share your ideas and charts in the comments section below! This is best way to keep it relevant, support us, keep the content here free and allow the idea to reach as many people as possible. **
-------------------------------------------------------------------------------
💸💸💸💸💸💸
👇 👇 👇 👇 👇 👇

Gold is sideways and waiting for a breakout⭐️GOLDEN INFORMATION:
Gold (XAU/USD) slips toward $4,000 in early Asian trading on Tuesday as investors scale back expectations for additional Federal Reserve (Fed) rate cuts. Markets now await comments from Fed Governor Michelle Bowman later in the day.
Last week, the Fed delivered its second rate cut of the year, lowering the benchmark range to 3.75%–4.00%. However, Chair Jerome Powell’s remark that another cut is “not a foregone conclusion” reinforced a hawkish tone, pressuring the non-yielding metal.
⭐️Personal comments NOVA:
Gold price is still maintaining the accumulation price range, not clearly determining a certain trend. Waiting for a breakout.
⭐️SET UP GOLD PRICE:
🔥SELL GOLD zone: 4089 - 4091 SL 4096
TP1: $4076
TP2: $4050
TP3: $4030
🔥BUY GOLD zone: 3922 - 3920 SL 3915
TP1: $3940
TP2: $3950
TP3: $3965
⭐️Technical analysis:
Based on technical indicators EMA 34, EMA89 and support resistance areas to set up a reasonable sell order.
⭐️NOTE:
Note: Nova wishes traders to manage their capital well
- take the number of lots that match your capital
- Takeprofit equal to 4-6% of capital account
- Stoplose equal to 2-3% of capital account

Gold - The most obvious top!🪙Gold ( TVC:GOLD ) will reverse soon:
🔎Analysis summary:
After we witnessed a major breakout back in 2024, Gold has been rallying about +120% ever since. However, Gold is now approaching a monster resistance trendline of the long term rising channel. It is really just a matter of time until Gold will create its official top.
📝Levels to watch:
$4,500
SwingTraderPhil
SwingTrading.Simplified. | Investing.Simplified. | #LONGTERMVISION

XAUUSD Update HIGH RANGE Correction ZoneAs we followed it price action structure, gold price now have a stable support at 3885 and by the time, it has retested 3900 support.
Now, price always retested more high price.
With a present Price Action, we could see, it have a key support level at 3964 and key resistance level at 4050.
Once it broken, it will go to it direction.
If 4050 broken, we could see 4070's as a retest area.
And vice verza, if 3964 broken, it will go to the lower area.
Have a blessing week ahead !


XAU/USD Analysis — Awaiting Breakout Confirmation for Bull Entry🏆 XAU/USD GOLD vs U.S. DOLLAR 🏆
📊 Swing/Day Trade Opportunity Guide
🎯 THE THIEF STRATEGY SETUP
Market: Precious Metals | Pair: XAU/USD (Spot Gold)
Timeframe: Multi-Timeframe Confirmation
Strategy Type: Breakout + Dynamic Support/Resistance
💡 BULLISH CASE CONFIRMED ✅
The bulls are on patrol! 🚨 Multiple confluences suggest an upside move:
✨ LSMA (Least Squares Moving Average) acting as dynamic support with multiple touch confirmations — classic reversal signal for swing traders. The metal is respecting this lower boundary like a fortress wall.
⚠️ Breakout Confirmation Required: Watch for a decisive close above 4,060.00 — this level marks a critical moving average resistance zone. Once breached, this becomes our green light for layered entries.
💰 ENTRY STRATEGY: "THE LAYERING THIEF METHOD" 💎
Instead of FOMO-ing into one position, we deploy the layered entry approach — multiple limit orders like a professional accumulator:
📍 Buy Limit Layers (After Breakout Confirmation):
Layer 1️⃣: 3,920.00 ← Initial dip catch
Layer 2️⃣: 3,960.00 ← Continuation entry
Layer 3️⃣: 4,000.00 ← Mid-zone accumulation
Layer 4️⃣: 4,040.00 ← Final confirmation level
⚡ Pro Tip: Scale these layers based on your account size and risk tolerance. You can add more layers every $20-$40 intervals.
🔔 CRITICAL:
✋ Wait for breakout confirmation above 4,060.00 before placing any buy orders. Premature entries = Stolen profits going nowhere! ❌
🛑 STOP LOSS (Risk Management)
Thief SL Level: 3,880.00 🎯
This is where the heist ends if the plan fails. Close below this support = Exit the building! 🚪
⚠️ Disclaimer Note: This stop loss is suggested as a reference point. Your SL placement depends on your risk appetite, account size, and trading personality. We're not financial advisors — only fellow traders sharing our playbook! Trade at your own risk. 💪
🎪 PROFIT TARGET: "THE POLICE BARRICADE" 🚔
Target Zone: 4,360.00 🏁
Why this level? Multiple reasons converge here:
📈 Strong historical resistance acting as a "police barricade"
🔴 Overbought conditions signal potential pullback territory
⚠️ Trap zone detected — this is where smart money takes profits!
Strategy: Scale out your positions as price approaches this zone. Don't get greedy and lose the win!
⚠️ Disclaimer Note: This profit target is OUR suggested zone, but YOU decide when to take profits. The choice is yours — stack those wins or hold for more. No financial advice here, just trading wisdom shared among Thief OG's! 🎩
🔗 CORRELATED PAIRS TO MONITOR 📡
Watch these related instruments for confluence signals:
💵 USD Index ( TVC:DXY ) — Inverse relationship with gold. If DXY weakens → XAU/USD strengthens. Monitor for divergence opportunities.
🏦 SPX500 ( CAPITALCOM:US500 ) — Risk sentiment indicator. Rising stocks = potential gold weakness. Use as confirmation filter.
FX:EURUSD — EUR strength = potential gold support. Cross-market divergences often precede major moves.
FX:GBPUSD — Pound weakness often correlates with gold rallies. Track for multi-timeframe alignment.
TVC:US10Y (10-Year Treasury Yield) — Inverse correlation. Rising yields = headwind for gold. Monitor daily for macro context.
📋 QUICK CHECKLIST ✅
Confirm LSMA support holds
Wait for 4,060.00 breakout confirmation
Place layered buy limits at 3,920/3,960/4,000/4,040
Set stop loss at 3,880.00
Scale profits into 4,360.00 resistance zone
Monitor correlated pairs for confluence
Respect risk management — never exceed 2% per trade
🎬 THE BOTTOM LINE 🎬
Gold is setting up for a potential swing trade move. The LSMA support is holding, and a breakout above 4,060.00 could trigger a run toward 4,360.00. Use the layering strategy to build positions methodically, protect capital with your chosen stop loss, and exit into resistance zones.
This is a confluence-based breakout play — not a guarantee, just probability on our side. 🎲
✨ If you find value in my analysis, a 👍 and 🚀 boost is much appreciated — it helps me share more setups with the community!
#XAU/USD #GoldTrading #TradingStrategy #SwingTrade #DayTrading #ForexAnalysis #TechnicalAnalysis #ThiefStrategy #LSMA #BreakoutTrading #RiskManagement #TradingCommunity #MarketAnalysis #Commodities #MetalsMarket
