The latest gold trends and trading strategies:
I. Core Trend Overview
Gold is currently trading in a critical range-bound pattern as the market seeks a clear directional breakout. The upside is constrained by a strong resistance zone between $4145 and $4160, while the downside is supported by a solid support band between $4040 and $4050. The core pivot point for this oscillation is at the $4100 level. Until a decisive breakout occurs, the dominant strategy remains selling near resistance and buying near support.
II. In-Depth Technical Analysis
Resistance Zone ($4145-$4160): Bearish Defense
Multiple Technical Confluences: This area combines resistance from previous highs, the upper Bollinger Band, and a descending trendline, creating a significant technical barrier.
Weakening Momentum: Although the daily MACD shows a golden cross, the shrinking bullish momentum histogram indicates fading buying power and insufficient upward momentum, increasing the probability of a pullback in this zone.
Support Zone ($4040-$4050): Bullish Stronghold
Strong Support Cluster: This zone represents a confluence of support from the middle Bollinger Band, the 50-day moving average, and previous consolidation areas, holding substantial technical importance.
Signs of Bearish Exhaustion: The 4-hour RSI has repeatedly found support and flattened near the 50 level, suggesting weakening selling pressure, substantial buying interest, and underlying potential for a technical rebound.
III. Specific Trading Strategy
For the primary strategy of selling on rallies, consider entering short positions within the $4145-$4160 range. Set stop loss at $4170. Take profit targets are at $4100 followed by $4080. This approach is recommended when price tests multiple resistance levels while momentum indicators show exhausted upward movement.
For the secondary strategy of buying on dips, consider entering long positions within the $4040-$4050 range. Set stop loss at $4030. Take profit targets are at $4100 followed by $4120. This opportunity arises when price retests the key support confluence while the RSI indicates weakening bearish momentum.
IV. Key Risks and Management Strategies
Responding to Range Breakouts:
Upside Breakout: If price breaks strongly above $4170, pause all short positions and monitor whether it will test higher resistance levels such as the $4200-$4250 area. Consider entering light long positions on pullbacks or wait for fresh confirmation signals.
Downside Breakout: If price breaks decisively below $4030, exit all long positions immediately. Consider entering light short positions following the breakout, with targets around the $4000 psychological level and potentially down to $3980.
Risk Control Principles:
Strict Stop-Loss: Always implement fixed stop-losses of $10-$15 for both long and short trades to protect against significant losses from false breakouts.
Position Management: Limit risk per trade to 1%-2% of total capital to maintain sustainability and continued trading capability during range-bound conditions.
V. Summary and Outlook
Gold is currently in an accumulation phase, building energy before a potential directional move. Traders should patiently wait for opportunities near the boundaries of the $4145-$4160 resistance zone and the $4040-$4050 support zone, maintaining a range-trading mindset.
Stay alert to fundamental catalysts such as Fed officials' speeches and US economic data releases, as these events could potentially break the current stalemate and trigger sustained trending moves. Maintain discipline, adhere to risk management rules, and remain flexible until confirmed breakouts occur.
Trade ideas

15 minute structure updateThe sellers' target for this time frame has been touched.
In the meantime, the 4051 liquidity level has been built, which will be a return to the liquidity hunt and a pullback to the specified support areas, which will be the selling position for lower targets and liquidity. In the 1-hour time frame, the current bottom has sellers' liquidity, so the sellers will return the price to this bottom.
Analysis link:

XAUUSD/GOLD SELL LIMIT PROJECTION 27.10.25Pattern Context
There’s a descending triangle or M-pattern that has been broken to the downside.
Labels such as “BREAKED M PATTERN NECKLINE HERE” and “BREAKED TRIANGLE PATTERN” indicate bearish structure.
Trade Setup
The chart projects a sell limit order in the region around 4,062–4,083 (highlighted red zone).
Stop loss is above the recent high — around 4,083.185.
Entry appears to be at the retest zone near 4,062.189 (“BREAKER ZONE RETEST & SELL”).
The target (take-profit area) points toward temporary support at approximately 4,031.150, suggesting a bearish continuation.
Trend Lines
A broken uptrend line and triangle breakout support the short bias.
The blue uptrend line and black triangle structure confirm the confluence zone where the retest and rejection may occur.
Summary of Bias
Direction: Bearish (Sell setup).
Confirmation: Triangle & M-pattern breakdown, retest expected.
Risk Management: Stop above 4,083; target near 4,031 (risk-reward ratio ≈ 1:2 depending on entry).

XAUUSD long Setup - Targeting 4005
ong entry triggered on XAUUSD following a bullish rejection from the 3996 support level. Managing risk with a logical stop loss below this key zone. Caution advised due to potential volatility from the upcoming Trump speech.

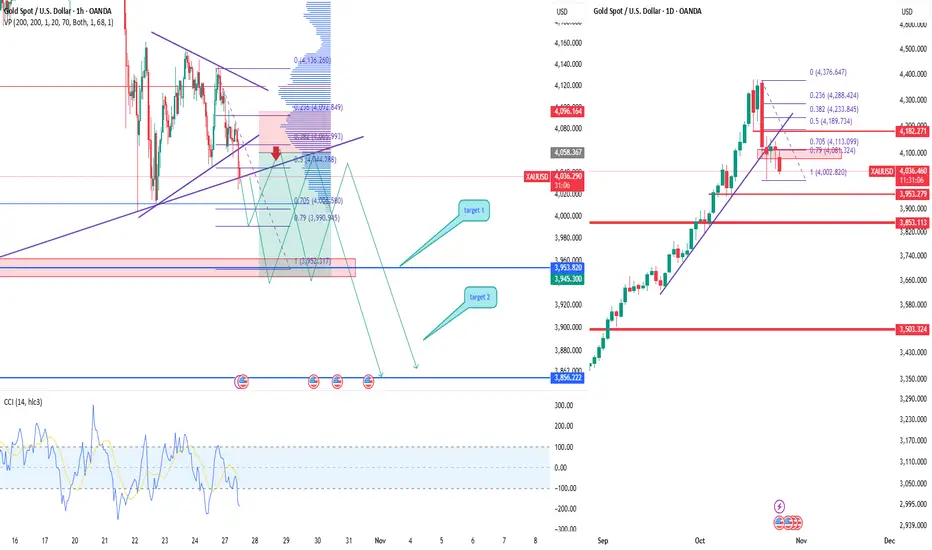
XAUUSD Gold testing support, correction possibleAfter a strong rally, gold entered a correction phase. Price broke the ascending channel and now trades around 4030–4050. The chart structure suggests a potential retest near 4070–4090 before continuation to 3960 (Target 1) and 3856 (Target 2).
CCI confirms weak buying momentum and volume profile shows high liquidity zones above current price — favoring a pullback.
Investors are taking profits after gold’s rally amid softer Fed outlook and possible dollar rebound. While long-term fundamentals stay bullish, short-term correction looks likely.
Sell setup from 4070–4090 zone with targets 3960 and 3856, stop 4110.
Valid while price remains below 4110.
XAUUSD Update - Bullish Scenario to reach 4500 levelIf next week, 3997 support still holding, so a bullish continuation may appears.
If market will make a bullish continuation, the target is fibo extention zone at 4500-4600 zone.
Stay carefully as price still consolidation at 4161 - 4005 zone ( Triangle pattern ) .
Waiting for a confirmation is more wiser.
Have a blessing week ahead !
* This scenario could be cancelled if selling pressure continues and the price makes a deeper correction.

November 3, 2025 - XAUUSD Analysis and Potential Opportunity📊 Analysis:
From the chart, bearish momentum hasn’t completely disappeared, and bullish strength hasn’t yet emerged, suggesting that the market may enter a range-bound phase.
I expect the price to consolidate between 3991 and 4010 — within this range, sell near the top and buy near the bottom.
Watch for a clear breakout:
If price breaks above 4010, consider buying pullbacks into support.
If price breaks below 3991, look to sell rallies into resistance.
A quick reminder: the zone between 4010–4045 lacks clear higher-timeframe levels, but there are many minor levels within it.
Conservative traders may prefer to wait until price exits this zone.
Aggressive traders can try light positions near short-term levels — with strict stop losses and small size.
🔍 Key Levels to Watch:
• 4065 – Resistance
• 4050–4058 – Resistance zone
• 4045 – Resistance
• 4020–4030 – Resistance zone
• 4010 – Upper boundary of range / resistance
• 4000 – Psychological level
• 3991 – Lower boundary of range / support
• 3971–3980 – Support zone
• 3960 – Key support
• 3947 – Support
📈 Intraday Strategy:
SELL: If price breaks below 3991 → target 3987, with further downside toward 3984, 3980, 3975
BUY: If price holds above 4010 → target 4015, with further upside toward 4020, 4025, 4030

Latest Gold Price Trends and Trading Strategies:
I. Core View
After a consecutive decline, spot gold found support at the 3900 USD level and staged a mild technical rebound. However, due to Fed Chair Powell's hawkish remarks dampening market expectations for aggressive rate cuts, the U.S. dollar strengthened, and Treasury yields climbed, leaving gold bulls with weak momentum and unable to effectively reclaim the psychological 4000 USD mark. In the short term, the bearish trend remains dominant, but structural factors such as central bank gold purchases provide long-term bottom support for gold prices.
II. Market Drivers Analysis
Key Pressures (Bearish):
Fed's Hawkish Stance: Powell explicitly stated that "a December rate cut is far from a done deal," causing a sharp drop in market expectations for rate cuts (probability fell from 70% to 45%).
Rising Treasury Yields and a Stronger Dollar: Higher rate expectations pushed up Treasury yields and the U.S. dollar, increasing the opportunity cost of holding non-yielding gold.
Technical Resistance: Strong resistance formed around 4030 USD, where bulls faced selling pressure.
Key Supports (Bullish):
Sustained Central Bank Purchases: Strategic allocations to gold by central banks (price-insensitive buying) provide solid bottom support for the market, particularly around 3900 USD.
Long-Term Fund Inflows: Record quarterly inflows into gold ETFs indicate that institutional and high-net-worth investors are reallocating to gold as a hedge against macroeconomic uncertainties.
Key Technical Support: The 3900-3885 USD zone is currently a critical support area.
III. Technical Analysis
Trend: The short-term bearish trend remains unchanged, with the overall pattern leaning weak and range-bound.
Key Resistance: The 3985-4000 USD area, followed by the strong resistance band at 4015-4020 USD.
Key Support: The 3900-3885 USD zone. A break below this could open further downside.
Trading Approach: Given the bearish trend and strong resistance above, short-term trading should focus on selling on rallies, with light long positions considered near key support levels to capture rebounds.
IV. Specific Trading Strategy Reference
Short Strategy (Primary Approach):
Entry Zone: When gold rallies to the 4015 - 4020 USD area, consider entering short positions in batches.
Stop Loss: Set above 4030 USD (approximately 8-10 USD).
Target Levels: Primary target at 3980 - 3950 USD. If broken, further downside to 3915 USD is possible.
Long Strategy (Secondary Approach, for Rebound Plays):
Entry Zone: When gold retraces to the 3910 - 3920 USD area, consider entering long positions in batches.
Stop Loss: Set below 3900 USD (approximately 8-10 USD).
Target Levels: Primary target at 3970 - 4000 USD. A strong breakout could extend gains to 4015 USD.
V. Risk Warning and Trading Discipline
Stay Updated: The market is dominated by Fed policy expectations, and sentiment can shift rapidly. Closely monitor U.S. economic data and speeches from Fed officials.
Strict Risk Control: Always set stop losses and manage position sizes carefully. Avoid heavy positions, especially in the current volatile market. Do not hold losing positions hoping for a reversal.
Flexibility: If gold breaks above 4030 USD or below 3885 USD, reassess the current trend and adjust trading strategies accordingly.


XAU/USD Update 2 Buying OpportunityNext move on the way. Focus on proper risk management & stay disciplined. Wishing you successful trades..!
Key Reason:
1. Unmitigated demand order flow along with proper BOS.
2. BISI still in pending.
3. If buyers remain strong. Then we'll see pump in gold price. High probability setup for buying.
Confirmation is most important part. Let's see how it will work.

XAU/USD Update 1Next move on the way, focus on proper risk management & stay disciplined. Wishing you successful trades..!
Key Reason:
1. 1 hour supply area.
2. In smaller time frame we've IMB inside this supply area.
3. Confirmation is very important. Let's see how it will work.

Gold Trade Plan 30/10/2025Dear Traders,
The price is currently moving within a descending channel. As long as the trendline hasn’t been broken, the bearish and corrective trend will continue — I expect targets below 3900.
Regards,
Alireza!

THE SELL LOOKS INVALID It's time to close because it doesn't look favorable, likely to buy more so it's best to get out

XAU/USD Intraday Plan | Gold Rebounds Ahead of FOMCPrice is respecting the analysis well — after testing the Deeper Support Zone (3944–3884), gold saw a strong rejection. Price has since rebounded and is now trading around 4017, showing signs of short-term recovery after several sessions of heavy downside pressure.
Gold has reclaimed the 4000 handle and moved back above the MA50, while also breaking the 1H structure to bullish. However, price still trades below the MA200, suggesting that short-term momentum has turned bullish.
For continuation, buyers need to secure a close above 4042, which could open the path toward 4095 and 4137.
On the downside, if price fails to hold above 3987, we could see another retest of 3944–3884, the same zone where buyers previously stepped in.
📌 Key levels to watch:
Resistance:
4042
4095
4137
4178
Support:
3987
3944
3884
3820
🔎 Fundamental Focus:
All eyes are on the FOMC events later today, with the Federal Funds Rate, FOMC Statement, and Press Conference scheduled in the evening.

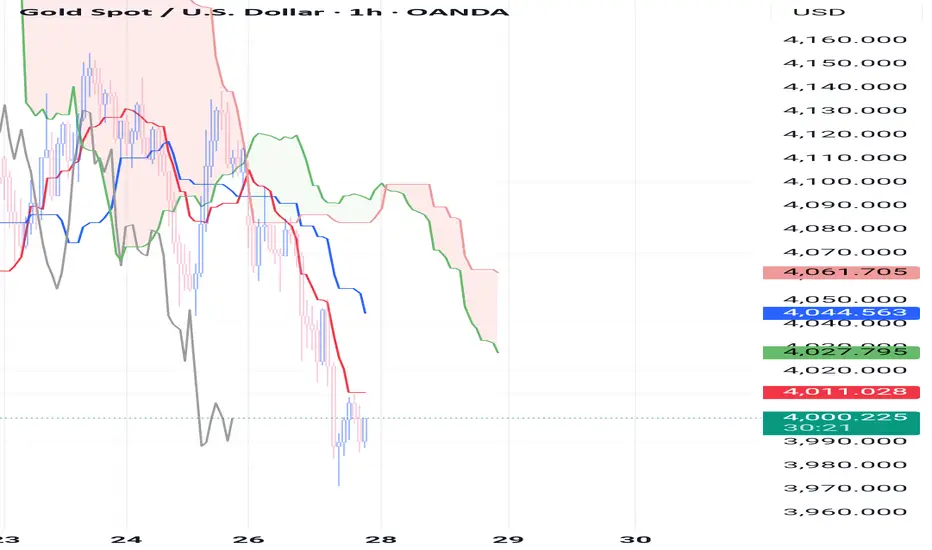
Gold, Signs of Revival on Lower TimeframesBased on Ichimoku vibrations observed on the lower timeframes (5-minute and 15-minute), the market shows signs of instability — a restless struggle, as if tempted to reclaim its lost crown.


XAUUSD 15-Minute Small-Scale Swing Trade - Short Position XAUUSD 15-Minute Small-Scale Swing Trade - Short Position
- Enter short position directly around the current price of 4122 USD, with stop-loss set at 4160USD.
- First target: Take profit around 4060 USD; close half of the position and trail the stop-loss to lock in gains.
- Second target: Take profit around 4000 USD; close all remaining short positions and exit with full profits.

Gold?
Hi,
Although we have emotional/ perception that gold has value etc2. News solidify these claims.
But Double Top = represents SELL (theoretically, technically charts)
Soooo..
I changed view to. bearish till proven otherwise (price breaks)
Now: I see as a new formation of down flag.
Will be proven.. when breaks 4066.
I'm meddling.. sell now. with SLs
(finding sell setups)
All the best
Not a guru
Not a guru

WE ARE SELLING Unfortunately the buy wasn't a long term one, it was a buy to create a lower high then the sells begin again which is just like how a long term buy start, so we are selling now ,
sell at 4100-4105 with sl at 4120 and allow it to run .

GOLD: HAWKISH FED Pushing the Market? $4,085 is the Test!Hey community, Gold is sitting at a critical junction. The alignment of the Fed’s pressure and a key Supply Zone is creating a high-conviction trade setup. Let's break it down.
I. FUNDAMENTALS: The Macro Headwinds 📰
Key Driver (The Bears' Argument): The Fed’s latest "hawkish" signals, with regional Presidents opposing further rate cuts, have significantly cooled market easing expectations. This solidifies the strong USD, creating heavy short-term pressure on non-yielding Gold.
Performance & Record High: Despite the immediate pressure, Gold surged 53% this year, hitting an all-time high of $4,381.21/oz on October 20th, showcasing underlying bullish demand.
Long-Term View: Morgan Stanley still supports Gold’s long-term climb (targeting $4,300/oz average by H1 2026), driven by expected rate cuts and economic instability.
Geopolitics: Trade news (e.g., discussions on US-China tariffs) adds noise, but the Fed's interest rate stance remains the dominant factor.
II. TECHNICAL ANALYSIS: The Supply & Demand Zones 🎯
The prevailing structure on the H4 chart confirms a strong DOWNTREND (Bearish Bias). The recent rally is a correction, necessary to retest key supply before the next decline.
1. The Primary SELL Setup (Following the Trend)
Optimal Supply Zone: $4,059 - $4,085. This is the key reversal zone where smart money is likely waiting to fill sell orders (discount zone for shorts).
Strategy: Wait for price to reach the $4,059 - $4,085 zone. Look for a strong rejection or pattern shift on lower timeframes to confirm the SHORT entry.
Ultimate Target (TP): The strong Demand Zone at $3,939 - $3,952.
2. The Counter-Trend BUY Zone (Bounce Potential)
Strong Demand Area: $3,939 - $3,952. This is a major structural level where Gold is likely to find strong support.
Strategy: If Gold sells off into this area, watch for buying pressure to catch a potential bounce.
🔑 FINAL TRADE CONCLUSION
Best Strategy: Wait and SHORT at the $4,059 - $4,085 Supply Zone. This is where fundamental pressure (Fed) and technical resistance perfectly align.
What's your take? Will the strength of the USD hold Gold down from here? Drop a comment! 👇
#XAUUSD #GOLD #FED #TechnicalAnalysis #ForexTrading #SupplyAndDemand #Bearish #TradingStrategy #PriceAction #MarketAnalysis

Xaausd planHello! Shorttime plan is finished.
1h timeframe:
We have a FVG that must fills around price 3980.
This is smart money concept.
Let price go down to FVG(support), wait for a confirmation, like a bullish engulfing, hammer candle.
Maybe the last time xauusd going down to 3980 before is go higher to 4060-4100
Entry: 3980-3990
Sl: 3965-3975
Tp1: 4030
Tp2: open to maximize, move sl to breakeven after tp1 hit and close manually later.
Are you bullish on gold?

XAUUSD How to become successful in forex and stock trading:
1.Master fundamentals and technical analysis.
2.Build and follow a solid trading plan.
3.Apply strict risk management (4–6% rule).
4.Stay disciplined—control fear and greed.
5.Record and analyze every trade.
6.Focus on high-quality setups only.
7.Diversify across assets and markets.
8.Keep evolving—study, adapt, and grow daily.
