[XAUUSD] Market OutlookAs we saw in the previous outlook, the market reacted perfectly to the marked zone.
Given this reaction and further analysis, we can notice that on the Daily timeframe there’s an internal Supply zone that could cause some trouble.
If that Supply level gets strongly broken, then I’d look for a structural realignment to the upside after a retest of the impulse.
So I’d wait for a full break of the Supply, followed by a move similar to the one shown in the picture .
Personally, I’d prefer scenario 1 for a structural continuation, but the second scenario could also offer the chance to buy gold at more “discounted” prices.
Be patient, no rush.
Trade ideas

28/10/68 : XAUUSD ( Europe / London Session )Using it from Europe Session until 7.00PM , I'll new analysis and update at 8.00PM or watch streaming at 7.00PM on YouTube Channel : @tradebynon
Resistance
3988-3993
3978-3983
3973
Support
3961
3950-3955
3939-3945

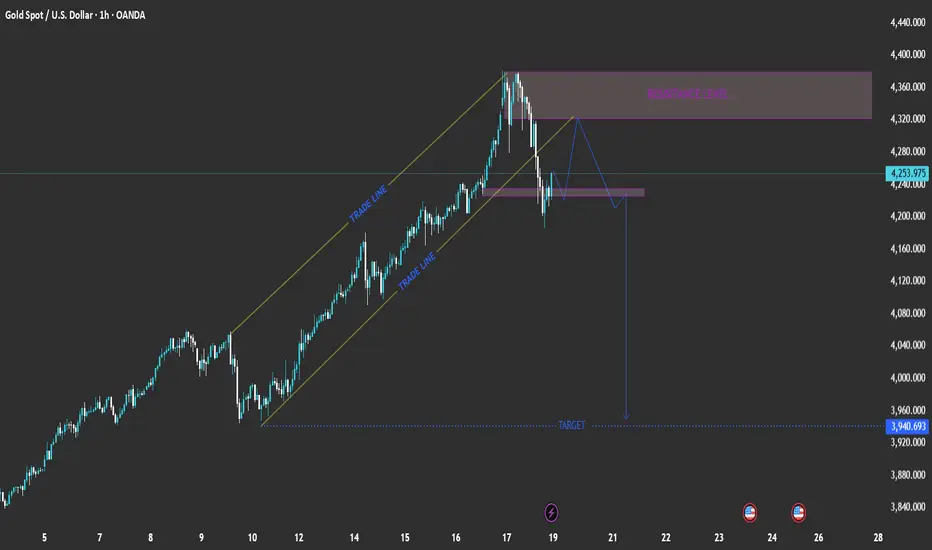
XAU/USD: Channel Breakout → Retest → Downside Target at 3,940EURONEXT:FTI1! EURONEXT:FTI1! EURONEXT:VU8F2026 EURONEXT:VM81! EURONEXT:VV6X2025 EURONEXT:V26X2025 EURONEXT:NS8Z2025 EURONEXT:YG8F2026 Pair: Gold Spot (XAU/USD)
Timeframe: 1-hour
Current Price: 4,253.975
Trend: Recently broke out of an ascending channel (bearish signal)
📉 Chart Breakdown
1. Ascending Channel (Trade Lines)
Price was moving steadily inside a rising channel, indicated by the two parallel yellow “TRADE LINE” levels.
The break below the lower trade line suggests weakening bullish momentum and potential trend reversal.
2. Resistance Level (4,320 – 4,360 zone)
Marked in purple, this zone served as a key resistance.
Price rejected strongly from this area, confirming seller presence.
3. Structure Retest and Potential Move
After the channel break, price retraced back to retest the broken channel support (now resistance).
The projected blue path shows a lower-high formation followed by a new drop, completing a bearish continuation pattern.
4. Target Zone
The projected target is near 3,940.693, aligning with previous structure support.
This level could serve as a profit-taking area for short positions.
📊 Summary of Key Levels
Zone Type Range / Level
4,320 – 4,360 Resistance Strong supply zone
4,220 – 4,240 Retest zone Potential short entry area
3,940 Target Bearish target / demand zone
⚙️ Trading Plan Concept (Hypothetical)
Bias: Bearish
Entry Idea: Wait for rejection from 4,220–4,240 zone.
Stop Loss: Above 4,280 (resistance)
Take Profit: Around 3,940 (target)
Risk/Reward: Approximately 1:3 or better
🧭 Conclusion
The chart suggests that Gold (XAU/USD) might be entering a corrective bearish phase after failing to sustain its bullish channel. A retest of broken structure before another drop aligns with typical market structure behavior.
XAUUSDRisk warning, disclaimer: the above is a personal market judgment based on published information and historical chart data on Tradingview, all analysis is only subjective. Hope investors consider, that I am not responsible for your investment decision.
Thank you.
Good luck

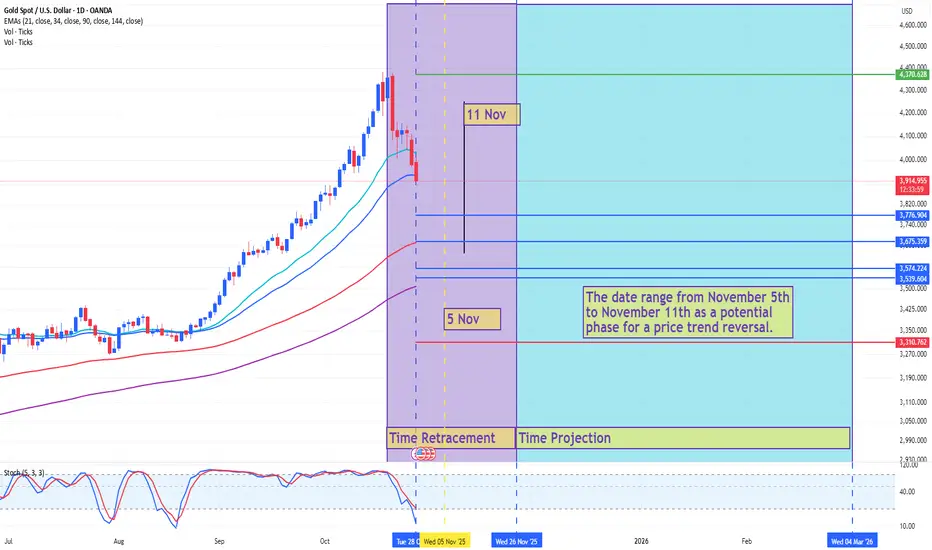
GOLD[1D] Trading Ideas: Fibonacci Time ProjectionGold Timing Analysis: Fibonacci & Lunar Confluence Signals Potential Reversal (Nov 5–11, 2025)
Fundamental:
-
Technical Analysis:
Combining Fibonacci Time Projection with the Lunar cycle to identify a critical turning window.
Note:
The analysis will remain relevant if the latest market data continues to align with this outlook.
IDX:COMPOSITE
Gold Intraday – Oct 30 (No.1)Scalping setup based on early London session volatility.
Expecting rejection near 2380 and possible short fade toward 2370 zone.
⚠️ Quick play — not advice, just sharing my intraday view.

Elliott Wave Analysis – XAUUSD | October 30, 2025
1️⃣ Momentum
• D1 Timeframe:
D1 momentum remains entangled. Yesterday’s daily candle closed at its lowest point, rejecting all intraday bullish attempts. However, it has not yet broken the previous candle’s low — this suggests that the bearish trend is still intact, though weakening, and a potential reversal could occur within the next 1–2 days.
• H4 Timeframe:
H4 momentum is approaching the oversold zone, indicating a possible short-term recovery lasting around 4–5 H4 candles.
• H1 Timeframe:
The price is currently either consolidating or continuing its short-term decline.
If it continues to cling to the 3927 liquidity zone, a further breakdown is likely.
________________________________________
2️⃣ Wave Structure
• D1 Timeframe:
Price is now sitting near the 0.382 Fibonacci retracement of wave (3) in yellow — a typical correction level for wave (4).
Therefore, if the decline continues or the correction extends, it’s highly probable that we are in wave (4) of the yellow count, and the current drop is only the first sub-wave of this corrective phase.
• H4 Timeframe:
Currently, price is around the 0.872 extension of wave (3) in purple, which is not ideal for a completed wave (4).
When combining the D1 and H4 structures, both indicate that the market is likely forming a corrective wave (4) in yellow, and a recovery move may soon appear as D1 momentum begins to turn upward.
👉 If this scenario is confirmed:
o If price breaks above the previous wave (3) high (around 4400), it would confirm the start of a new impulsive wave upward.
o If price rises slowly and the highest target only reaches around 4400 before turning down again → this move is likely part of the corrective wave (4) before another bearish leg resumes.
• H1 Timeframe:
The current formation suggests a potential double zigzag structure.
To confirm this setup, price needs to break below 3892. This is a strong liquidity zone, so if price reaches it, a temporary bounce could occur.
Key liquidity zones above to watch: 3927 – 3953 – 3995.
If price fails to break above the previous red wave X, these zones may act as strong resistance levels, pushing the market lower again.
Target areas for the red wave Y are:
o 3814
o 3786
________________________________________
3️⃣ Trade Plan
Scenario 1:
• Buy Zone: 3815 – 3813
• SL: 3804
• TP1: 3892
Scenario 2:
• Buy Zone: 3787 – 3785
• SL: 3776
• TP1: 3892
________________________________________
📌 Summary:
D1 momentum is weakening and nearing the oversold zone → a potential bullish rebound could develop in the coming sessions.
The 3815 – 3785 area remains a key buy zone, while 3927 – 3995 should be closely monitored as resistance levels to confirm the next directional move.

XAU/USD - Structural Reset and Reversion to Major Sell FrameworkThe recent bullish attempt has officially failed to establish structure, revealing that the brief upward move was merely a corrective exhaustion from the previous selling leg. Despite the short-term relief, momentum quickly reverted, and a new sell-side framework has now formed - one that’s far more aligned with broader structural behavior.
This new formation mirrors the previous major sell triangle, but with a more refined and realistic target zone, highlighted by the purple box. Price remains positioned near the upper boundary of the red structure, suggesting that selling pressure is once again dominant.
Unless buyers can produce a confirmed break above the current structural pivot, the path of least resistance remains to the downside, with measured targets pointing toward the completion zone inside the new sell continuation area.
In short - the market has reset its rhythm. The unstructured pump has faded, and the primary bearish structure is back in control.

XAUUSD: October 28th Market Analysis and StrategyGold Technical Analysis
Daily Resistance: 4005, Support: 3840
4-Hour Resistance: 3972, Support: 3840
1-Hour Resistance: 3950, Support: 3880
Divergence in technical indicators continues to intensify. After the weekly K-line price of spot gold falls below 4000, the next support level is near the 10-day moving average (MA10) around 3840.
The daily K-line shows a temporary peaking signal, intensifying short-term market sell-off sentiment. After breaking below the 3950 support level, the market trend has shifted. The next target is the 3800/3700 level.
Based on the 1-hour chart, gold generally conforms to yesterday's analysis. After the K-line combination broke through the trend support, the downward trend accelerated. The decline widened in the European session, with the price falling below the 3900 mark! Bulls' last hope lies in Thursday's Federal Reserve interest rate decision. Sell on rallies in the near term.
SELL: 3930-3945
BUY: 3835-3845

Trading plan for XAUUSD for 10/27/2025 (short)This trading plan is :
- If the price gets below $4065 then enter short with TP = $4005 (around recent lower low).
- if the price gets below $4005 then enter short with TP = $3946 (around recent lower low).
- if the price gets below $3946 then enter short with TP = $3873 (fibonacci level).

XAUUSD UPDATE : Alert ! BEARISH PRESSURE still EXISTMonday open, price still under pressure below 4161 resistance.
It could be the early sign for 4160 - 4150 level as a strong resistance area, and price have a big possibility to make a downside continuation / more correction to a lower price below 4000.
Becareful for a retest action !
Have a great week ahead !


Double Top Confirmed! Is Gold About to Fall Deeper?As expected from my previous idea , Gold touched its target of $4,183 ( the double top pattern’s target(Small) ). Before reaching that target, it had some ups and downs over the past few days, mainly due to the ongoing US-China tensions .
Gold is trading near a Support zone($4,193 – $4,156) .
From a classical technical analysis perspective, it’s forming a clear double top pattern on the 1-hour timeframe . There’s also a regular bearish divergence (RD-) visible between the two peaks of the double top.
From an Elliott Wave theory standpoint, it looks like Gold has started its corrective wave. If the Support zone($4,193 – $4,156) and the double top pattern’s neckline break , we can expect further downside .
I expect that after breaking the Support zone($4,193 – $4,156) and the neckline , Gold could drop at least to around $4,083(First Target) .
Second Target: $4,057
Stop Loss(SL): $4,385(Worst)
Note: Keep in mind that given the ongoing US-China tensions, any news could invalidate this analysis. So it’s more important than ever to manage your risk carefully these days.
Please respect each other's ideas and express them politely if you agree or disagree.
Gold Analyze (XAUUSD), 1-hour time frame.
Be sure to follow the updated ideas.
Do not forget to put a Stop loss for your positions (For every position you want to open).
Please follow your strategy; this is just my idea, and I will gladly see your ideas in this post.
Please do not forget the ✅ ' like ' ✅ button 🙏😊 & Share it with your friends; thanks, and Trade safe.

XAUUSD (ONDA) Intraday & Swing LevelsLevels interpretation Follows:
🌡️Plot Levels Using 3 Min, 5 Min Time frame in your Chart for Better Analysis
L#1: If the candle crossed & stays above the “Buy Gen”, it is treated / considered as Bullish bias.
L#2: Possibility / Probability of REVERSAL near RLB#1 & UBTgt
L#3: If the candle stays above “Sell Gen” but below “Buy Gen”, it is treated / considered as Sidewise. Aggressive Traders can take Long position near “Sell Gen” either retesting or crossed from Below & vice-versa i.e. can take Short position near “Buy Gen” either retesting or crossed downward from Above.
L#4: If the candle crossed & stays below the “Sell Gen”, it is treated / considered a Bearish bias.
L#5: Possibility / Probability of REVERSAL near RLS#1 & USTgt
HZB (Buy side) & HZS (Sell side) => Hurdle Zone,
*** Specialty of “HZB#1, HZB#2 HZS#1 & HZS#2” is Sidewise (behaviour in Nature)
Rest Plotted and Mentioned on Chart
Color code Used:
Green =. Positive bias.
Red =. Negative bias.
RED in Between Green means Trend Finder / Momentum Change
/ CYCLE Change and Vice Versa.
Notice One thing: HOW LEVELS are Working.
Use any Momentum Indicator / Oscillator or as you "USED to" to Take entry.
⚠️ DISCLAIMER:
The information, views, and ideas shared here are purely for educational and informational purposes only. They are not intended as investment advice or a recommendation to buy, sell, or hold any financial instruments. I am not a SEBI-registered financial adviser.
Trading and investing in the stock market involves risk, and you should do your own research and analysis. You are solely responsible for any decisions made based on this research.
"As HARD EARNED MONEY IS YOUR's, So DECISION SHOULD HAVE TO BE YOUR's".
Do comment if Helpful .
In depth Analysis will be added later (If time Permits)

Is the XAU/USD Breakout the Next Major Trade Opportunity?💰 GOLD vs USD — “Thief Trader’s Golden Breakout Playbook” ⚡️
Asset: XAU/USD (Gold vs U.S. Dollar)
Market: Metals
Type: Day Trade Setup
Bias: 🟢 Bullish plan – pending order after breakout
🧭 TRADE BLUEPRINT
Entry Zone:
Wait for a clean breakout above 4160.00 before entering.
(Breakout confirmation > impulsive candle > retest optional)
Stop Loss:
“Thief SL” parked at 4040.00 — move only after breakout validation.
💡 SL isn’t mandatory — your money, your call!
Target:
Ride the move up to 4380.00, where strong resistance meets overbought traps.
🧨 Escape with profits before the crowd gets greedy!
💬 NOTE TO ALL “THIEF OG’s”
Dear Ladies & Gentlemen,
I’m not asking you to use only my SL or TP — they’re examples.
You’re the master of your risk. Make money. Take money. Stay legendary. 💸
🧩 CORRELATION CHECKLIST
Keep your eyes on these key pairs to confirm gold’s direction:
TVC:DXY (U.S. Dollar Index): If the dollar drops, gold usually pops.
OANDA:XAGUSD (Silver): Often follows gold’s mood — good double-check.
FX:USDJPY & OANDA:USDCHF : Safe-haven cousins. If they fall, gold shines brighter.
OANDA:XAUJPY : A stealth correlation — helps catch sentiment early.
🧠 Gold doesn’t move alone — it dances to USD rhythm and global risk tone.
⚙️ THIEF INSIGHT:
Gold’s sitting near a major pivot resistance (4160) — a breakout signals momentum ignition.
Risk/Reward is balanced: 4040 SL vs 4380 TP (~1:1.8).
Institutional footprints suggest buy interest post-breakout zone.
Stay sharp — watch volume spikes & candle closes above breakout line.
🏁 FINAL WORDS
Trading isn’t robbery — it’s legalized patience.
The real theft is done with discipline, not greed.
Grab your profits like a pro, not a desperado. 🕶️💼
✨ “If you find value in my analysis, a 👍 and 🚀 boost is much appreciated — it helps me share more setups with the community!”
⚠️ DISCLAIMER:
This is a Thief Style Trading Strategy — just for fun & education.
Not financial advice. Always DYOR & trade responsibly. 🧠💰
#XAUUSD #Gold #DayTrading #Breakout #ThiefTrader #Forex #MetalsMarket #GoldAnalysis #USD #DXY #TradingView #RiskManagement #TechnicalAnalysis #FunTrading #MarketPlaybook

The Historical Crashes of Gold — What Really Caused Them ?Hello Traders 🐺
Throughout history, every major bear market in gold has been deeply connected to macro factors, monetary policy, and investor psychology.
Here I’ve summarized the key factors behind gold’s biggest crashes since the 1970s 👇
🧩 Key Factors Behind Historical Gold Crashes
1️⃣ Rising Real Interest Rates (↑)
The biggest historical enemy of gold.
Since gold has no yield, when real interest rates (nominal rates – inflation) turn positive, investors prefer bonds or the U.S. dollar.
Example:
In the 1980s, Fed Chair Paul Volcker raised rates above 15% to fight inflation.
Result: gold dropped from $850 (1980) to around $300 by the mid-80s — a 65% crash, marking the longest bear market in gold’s history (1980–1999).
2️⃣ A Stronger Dollar (DXY ↑)
Gold usually moves inversely to the dollar index.
When the dollar strengthens (especially vs EUR and JPY), gold comes under pressure.
Example:
Between 2011–2015, DXY rose from 73 → 100, while gold fell from $1920 → $1050 (≈45% decline).
3️⃣ End of Crises or Return of Market Confidence
When fear fades and confidence returns (e.g., after financial crises or geopolitical tensions ease), investors move away from safe-haven assets like gold.
Example:
After the 2008 crisis, once markets stabilized, gold entered a prolonged bear market (2012–2015).
4️⃣ Central Banks Stopping Gold Purchases
When central banks reduce or halt their gold accumulation, supply pressure builds.
Example:
In the late 1990s, European central banks sold large portions of their reserves (known as the Central Bank Gold Agreement 1999), which accelerated gold’s decline.
5️⃣ Strong Stock Market Returns
When equities deliver strong real returns, capital often rotates out of gold.
Example:
From 1995–2000, the S&P 500 rallied massively, while gold suffered one of its weakest decades.
6️⃣ Low Inflation & Economic Stability
Gold thrives on uncertainty and high inflation.
When inflation is low and stable, investors see little reason to hold gold.
Example:
Between 1985–2000, inflation in the U.S. stayed low — and gold traded sideways between $250–$400 for nearly 20 years.
7️⃣ Technical & Sentiment Breakdown
When key supports break and sentiment turns bearish, fear-driven selling usually accelerates the downtrend.
Example:
In 2013, gold broke below the $1550 support, triggering a rapid 20% selloff within months.
My final thought:
Every time gold enters a euphoric phase, history reminds us that the higher it climbs, the harder it falls.
So what do you think right know ? is GOLD about to fall ? let me know in the comment section down below this idea 😉🤔
So stay disciplined, watch the macro shifts carefully — and as always remember:
🐺 Discipline is rarely enjoyable, but almost always profitable. 🐺
🐺 KIU_COIN 🐺

Gold on Support levels / #6,100.80 Medium-term TargetTechnical analysis: This week's huge red Daily candlestick pattern is an indication of increased tension and war / conflict escalation negativity as geopolitical tensions arise which invalidated Buyers intent and comforted Short-term Gold’s Sellers early on. Gold was once again on High demand as Investors used the metal as an traditional safe-haven asset where capital strongly flew into Gold, pushing the Price-action way above the #13-Month High’s however due Profit taking of most Buyers (Long-term Investors) Gold dipped on Friday's session traditional Profit taking and was testing #4,000.80 benchmark and as (by my personal opinion) DX skyrocketed and engaged Short-term Buy-off rally where Selling pressure from DX de-escalated Gold towards June #1 High’s again (currently even Lower) and currently it is the question where market will be headed next. Gold was on hard Resistance levels and current consolidation levels (historical regression analysis) points that when Trading for Long on those levels, strong downside direction comes in form of #100 to 200 point + decline. Besides this, nothing else Supports the downwards argument (except current High Impact factor) since all Charts turned critically Bearish on Short-term. #4,000.80 mark is now new / old Support and by my calculation chances for breaking it again without new news are Technically really impossible (too far fetched and without catalyst to take the Price-action towards those / current High’s).
My position: However, in each market situation, Trader has to adapt. Therefore, do not take strong bets on the market, Buy and Sell current Intra-day timeframe with aggressive Scalps (#3 to #5-points) and close your order, calling it for the week. Expect new instructions with my Monday-session commentary. Also my #6,100.80 benchmark is posing as my new Medium-term Target.


Elliott Wave Analysis – XAUUSD (October 28, 2025)
🔹 Momentum
D1 Timeframe:
The momentum lines on D1 remain intertwined. When this happens, the trend often continues with candle counts that follow Fibonacci numbers (3, 5, 8…).
Currently, there are around 3 candles, indicating a high probability of a reversal forming soon, possibly today.
H4 Timeframe:
Momentum is rising, suggesting a potential short-term upward or sideways move to push momentum into the overbought zone.
If the market consolidates at this level, once momentum reaches the overbought region, another bearish leg on H4 could still occur.
H1 Timeframe:
Momentum is currently decreasing. Price is closing lower around the liquidity zone at 3994, showing signs of a liquidity sweep.
We expect price to continue moving lower toward the next liquidity zone, in alignment with the short-term bearish structure on H1.
________________________________________
🔹 Wave Structure
D1 Timeframe:
The overall wave structure remains largely unchanged. Yesterday’s strong bearish candle fits within our prior analysis, confirming that the corrective wave is still in progress.
However, since the D1 momentum lines have already stuck together for about three candles, a potential bullish reversal candle today could mark the completion of this correction.
H4 Timeframe:
The structure has broken the previous low, suggesting that this could be the final leg of wave Y (blue).
Observing the completed 5-wave structure (1–2–3–4–5 in blue), this corrective leg has now returned to the base of the previous wave 4, achieving both price and time symmetry.
→ A short-term bullish reversal is expected from the current area.
H1 Timeframe:
The prior correction formed a triangle pattern (abcde in red), which has now broken to the downside, developing into a 5-wave sequence (black).
Wave 4 (black) appears completed, and price is likely within the final wave 5 down.
🎯 Target zones for completion of wave 5 (black):
• Target 1️⃣: 3953
• Target 2️⃣: 3927
________________________________________
🔹 Trading Plan
Scenario 1:
• Buy Zone: 3955 – 3952
• Stop Loss: 3932
• TP1: 4050
Scenario 2:
• Buy Zone: 3939 – 3927
• Stop Loss: 3907
• TP1: 3994

Bearish Pennant Chart Pattern Breakout TargetsDear traders,
The long awaited pullback has finally arrived. But it is to be traded with caution. As the market leaves traders with questions if the trend has changed short term or it's just another pullback to gather liquidity.
The bullish price action we saw on Gold gives a clear answer to this question. Carefully looking at the charts we can observe that gold maintained a faithful and upright uptrend: As it never broke a higher low. And now it has and it is not pushing back up, which is usually, hereby a declaration of the arrivals of the merciless bears.
My prediction of the price movement is simply a result of my experience of the market movement.
Also, an advise for all. if you want to short in the triangle, ensure to use the Supply zones or Bearish Order Blocks as other PD arrays are being ignored, this is visible in the current price action.
Have a fruitful week and don't forget to protect your capital guys!

Gold at Crossroads: Watch 3926–3944 vs 4060–4070This update refers to my previous post titled “When Fundamentals Mislead — Only the Chart Tells the Truth.”
Earlier today, during the Asian session, gold reached $4046, which might be a retest of the resistance zone and a possible early sign of bullish intent.
I’ve now added the 4-hour chart for a closer view. Please check it carefully.
Key short-term levels to watch:
Support: 3926–3944 (strong zone)
Resistance: 4060–4070 (strong rejection area)
A break of either side could define today’s direction.
The main idea remains: no bias — neither bullish nor bearish.
Gold can trick you at any moment, especially near major decision zones.
Stay tuned for my regular daily analysis within one hour from now.
Disclaimer:
This analysis is for educational and informational purposes only and does not constitute trading advice.
Market conditions can change rapidly with new data or headlines.

GOLD XAUUSD 4HR /3HR CHARTTHE YELLOW METAL SELLOFF CONTINUES ON FOMC FEDERAL FUND RATE OUTLOOK.
the key technicality surrounding gold trading is as follows
the 4hr EMA10,EMA20,EMA50,EMA100 are all above price supporting bearish take profit only the 4HR EMA200 IS below price acting as dynamic support on 4hr at 3945-3940 + ema 200 support for buy.
THIS WILL BE LAYER BY LAYER.
THE DOLLAR INDEX DEFENDED 98.757 SUPPORT FLOOR INDICATING A POSSIBLE BUY POSITION ON DOLLAR INDEX PENDING THE OUTLOOK OF THE FOMC .THIS PRICE ACTION PUT GOLD LONG POSITION ON CAUTIOUS MODE.
THE UNITED STATE 10 YEAR TREASURY BOND YIELD CLOSE IN MASSIVE SELLOFF TO CLOSE BELOW 4.0% MARK AT EXACTLY 3.987%
GOLD CORECTION IS PLAYING ON CAUTION AND the next demand floor will around 3767.90-3764-3760
finally the last layer by layer will be 3700-3706 my pay day zone ....at this level expect to see the hand of GOD.
NOTE;gold trading is very volatile but comes with liquidity ,pls manage your risk and i wish you good luck.
#GOLD #XAUUSD #DXY #US10Y
