XAUUSD more bullishYesterday on Friday, we hade bad NFP data, which is too good for gold. In September we are also heading to see interest rate cut. Better to look buy setups on Gold.
GOLD trade ideas

XAU/USD: "Gold Ascends Olympus: 3687 in Sight"
In the golden corridors of the market, price moves like poetry—measured, confident, yet ever delicate. Gold, the ancient keeper of value, has once again risen with purpose, carving a steady path through a well-defined "bullish channel", like a river flowing uphill.
The bulls, bold and unshaken, pressed onward, climbing higher with each candle’s breath. Supported by a strong base — a combined foundation of support (S1) — they carried the weight of momentum, fueled by conviction and chart whispers.
Now, we arrive at the present — a moment suspended between glory and caution. The price glides just above $3,636, entering what we call the "Zone in Focus". This is no ordinary zone — it is a trader’s tightrope, stretched between two poles:
* To the north: a shimmering target at $3,687.532, where dreams of continuation await.
* To the south: a shadowed guard line at $3,619.406, where hesitation may trigger retreat.
It is here the market speaks in riddles. Will the bulls surge one final time to crown a new local high? Or will they rest, allowing gravity to pull the price back into safer ground?
This, dear reader, is a Risky trade — not because it lacks potential, but because it asks for "Patience, Precision, and Respect" for market rhythm. One misstep in this zone could mean entering too late or exiting too early.
So the wise trader watches. Waits. Lets the price unfold its intention like a story yet unfinished.
Final Thought:
In trading, as in life, clarity comes not from rushing in, but from waiting for the moment that feels right. The chart is speaking — listen closely, and act with grace.
Educational Assistant to All.
Comments and Likes Shows Support always.

Gold Price: End-2025 Scenarios According to the FedThe evolution of gold prices by the end of 2025 will largely depend on the monetary policy decisions taken by the US Federal Reserve (Fed). After a year marked by a weaker dollar and falling rates that supported the precious metal, market attention is now focused on the next three key Fed meetings: September 17, October 29, and December 10. Five main scenarios can be considered, each with distinct implications for the trend of gold.
1. No Pivot: Bearish Scenario for Gold
In this first case, the Fed keeps its policy rates unchanged throughout 2025. This choice would stem from inflation returning toward 3%, prompting Powell and the FOMC members to remain restrictive.
The absence of a pivot would support bond yields and the US dollar on the FX market. Historically, both factors exert downward pressure on gold. Thus, this scenario would imply a bearish trend for the metal, with most of this year’s gains having been fueled by the dollar’s decline.
2. Technical Pivot Linked to the Labor Market: Moderate Support
The second case corresponds to a single rate cut in September or October, driven by labor market weakness. This would not constitute a true easing cycle, since inflation would remain too high to justify a series of cuts.
The impact on gold would be relatively neutral to slightly bullish. On one hand, a stable dollar would limit gold’s upside. On the other, persistent concerns about growth and employment would provide some support. This scenario would result in a trendless evolution with phases of volatility.
3. Real and Healthy Pivot: Measured Increase
A third scenario assumes the Fed engages in a true pivot from September or October, initiating a series of rate cuts. This decision would be enabled by confirmed disinflation around 2%, combined with a controlled labor market.
In this context, the impact would be bullish but measured. Falling rates and a weaker dollar would support gold, but a stable labor market would push flows toward risk assets such as equities, limiting the extent of gold’s rally.
4. Unhealthy Pivot: Strong Rise in Gold
A more critical scenario would see the Fed forced into a pivot by labor market deterioration, despite inflation persisting around 3%. Such cuts would be perceived as defensive, increasing risk aversion.
In this environment, gold would benefit massively: weaker dollar, lower yields, and, above all, safe-haven demand amid rising unemployment. The impact on gold would be strongly bullish.
5. The “Fed Put”: Explosive Scenario for Gold
Finally, the extreme case corresponds to an emergency Fed intervention. Faced with soaring unemployment and a confirmed recession in the US, the central bank would launch massive easing, combining rapid and steep rate cuts.
This situation would trigger a sharp fall in the dollar and bond yields. Gold, the ultimate safe haven, would then experience a spectacular surge to new all-time highs. The scale of the move would be amplified by the recessionary backdrop, pushing investors away from risk assets.
DISCLAIMER:
This content is intended for individuals who are familiar with financial markets and instruments and is for information purposes only. The presented idea (including market commentary, market data and observations) is not a work product of any research department of Swissquote or its affiliates. This material is intended to highlight market action and does not constitute investment, legal or tax advice. If you are a retail investor or lack experience in trading complex financial products, it is advisable to seek professional advice from licensed advisor before making any financial decisions.
This content is not intended to manipulate the market or encourage any specific financial behavior.
Swissquote makes no representation or warranty as to the quality, completeness, accuracy, comprehensiveness or non-infringement of such content. The views expressed are those of the consultant and are provided for educational purposes only. Any information provided relating to a product or market should not be construed as recommending an investment strategy or transaction. Past performance is not a guarantee of future results.
Swissquote and its employees and representatives shall in no event be held liable for any damages or losses arising directly or indirectly from decisions made on the basis of this content.
The use of any third-party brands or trademarks is for information only and does not imply endorsement by Swissquote, or that the trademark owner has authorised Swissquote to promote its products or services.
Swissquote is the marketing brand for the activities of Swissquote Bank Ltd (Switzerland) regulated by FINMA, Swissquote Capital Markets Limited regulated by CySEC (Cyprus), Swissquote Bank Europe SA (Luxembourg) regulated by the CSSF, Swissquote Ltd (UK) regulated by the FCA, Swissquote Financial Services (Malta) Ltd regulated by the Malta Financial Services Authority, Swissquote MEA Ltd. (UAE) regulated by the Dubai Financial Services Authority, Swissquote Pte Ltd (Singapore) regulated by the Monetary Authority of Singapore, Swissquote Asia Limited (Hong Kong) licensed by the Hong Kong Securities and Futures Commission (SFC) and Swissquote South Africa (Pty) Ltd supervised by the FSCA.
Products and services of Swissquote are only intended for those permitted to receive them under local law.
All investments carry a degree of risk. The risk of loss in trading or holding financial instruments can be substantial. The value of financial instruments, including but not limited to stocks, bonds, cryptocurrencies, and other assets, can fluctuate both upwards and downwards. There is a significant risk of financial loss when buying, selling, holding, staking, or investing in these instruments. SQBE makes no recommendations regarding any specific investment, transaction, or the use of any particular investment strategy.
CFDs are complex instruments and come with a high risk of losing money rapidly due to leverage. The vast majority of retail client accounts suffer capital losses when trading in CFDs. You should consider whether you understand how CFDs work and whether you can afford to take the high risk of losing your money.
Digital Assets are unregulated in most countries and consumer protection rules may not apply. As highly volatile speculative investments, Digital Assets are not suitable for investors without a high-risk tolerance. Make sure you understand each Digital Asset before you trade.
Cryptocurrencies are not considered legal tender in some jurisdictions and are subject to regulatory uncertainties.
The use of Internet-based systems can involve high risks, including, but not limited to, fraud, cyber-attacks, network and communication failures, as well as identity theft and phishing attacks related to crypto-assets.

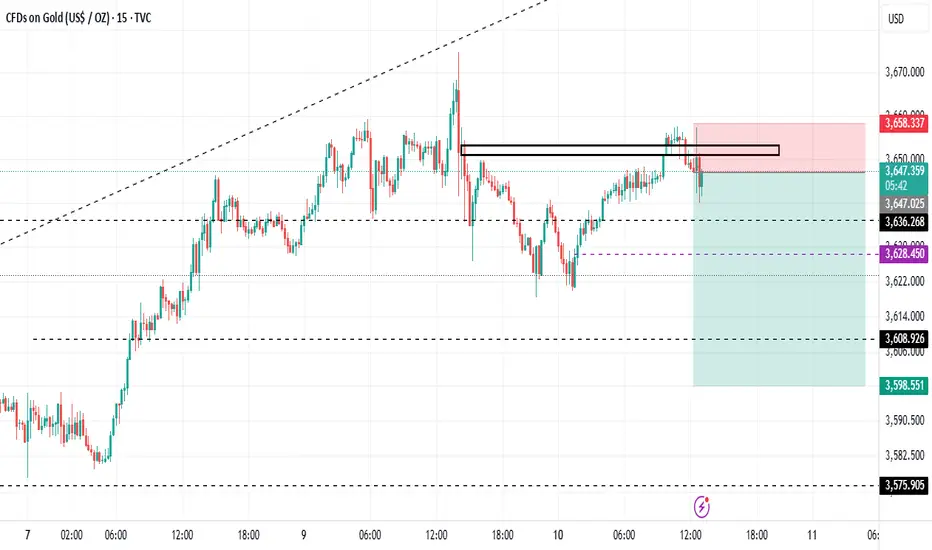
Intensifying Bear Grip: Can 3610–3600 Save the Bulls?Gold started to retreat from around 3675, and has now retreated to the lowest point of 3620-3610. According to the current market performance, we can clearly see that the rebound high point of gold after the retreat is gradually decreasing, and the control of the short position is further increasing. Yesterday, according to my trading model, my prediction that gold may usher in another 600pips retreat has been realized, and we have also won a big victory in the short transaction. It can be said that we have become the first echelon to reap the dividends from the short transaction. Then, will the high-rise building that the gold market has worked so hard to build collapse?
In fact, from a macroeconomic and technical perspective, gold's bullish trend remains intact, supported by expectations of rate cuts and safe-haven demand, which will, to a certain extent, limit any potential pullback.
From a capital perspective, some funds may be taking profits, but the current retracement is far from panic selling. Furthermore, as gold gradually retreats, a large amount of funds that have not yet entered the market in a timely manner may flow into the market, further pushing up gold prices.
From a technical perspective, after the pullback, the rebound high of gold has gradually moved down from 3655 to 3650 and 3640, while the retracement low has also moved down simultaneously. The current lowest has reached around 3620, and there are signs of further pullback. However, we need to note that in the short term, gold is still technically supported in the 3610-3600 area, while strong support is in the 3590-3580 area. Therefore, from a short-term perspective, the retracement space may not be sufficient, so I do not advocate shorting gold directly. On the contrary, we can wait for gold to rebound to the 3640-3650 area and then moderately consider shorting gold, because as gold gradually retreats, the 3635-3645 area has become the current short-term resistance area.
Therefore, for short-term trading, since gold has rebounded after touching 3620 many times, and is technically supported by the 3610-3600 area in the short term, we can consider starting to try to go long on gold in the 3620-3610 area; after gold rebounds to the 3635-3645 area, we can moderately consider shorting gold.

Gold Price Analysis – Bullish Trend Holds Above 3,440Gold is currently respecting its uptrend structure, with the price bouncing strongly from the 3,359 – 3,370 support zone and holding above the black ascending trendline. This shows buyers are actively defending the higher-low structure. Price is now around 3,474, very close to a short-term resistance zone near 3,480 – 3,500. If bulls manage to hold above 3,440 – 3,450, the bullish momentum is expected to continue, potentially pushing price toward the 3,624 extension level, which aligns with the next Fibonacci projection. On the downside, if the price fails to hold the support, it could revisit 3,370 or deeper levels near 3,256 (Fib 0.382).
At this moment, the trend is clearly bullish, as gold is forming higher lows and higher highs while moving along the upward channel.
📊 Key Levels to Watch
- Immediate Resistance: 3,480 – 3,500
- Major Upside Target: 3,624
- Immediate Support: 3,440 – 3,450
- Key Buy Support Zone: 3,359 – 3,370
- Deeper Support (if breakdown): 3,256 – 3,200
Buyers are in control as long as price holds above 3,440 and the ascending trendline.
Buy Zone: 3,445 – 3,454
Buy Trigger: A bounce/rejection from this zone with bullish candles or a confirmed breakout above 3,480 (with strong volume).
Note
Please risk management in trading is a Key so use your money accordingly. If you like the idea then please like and boost. Thank you and Good Luck!

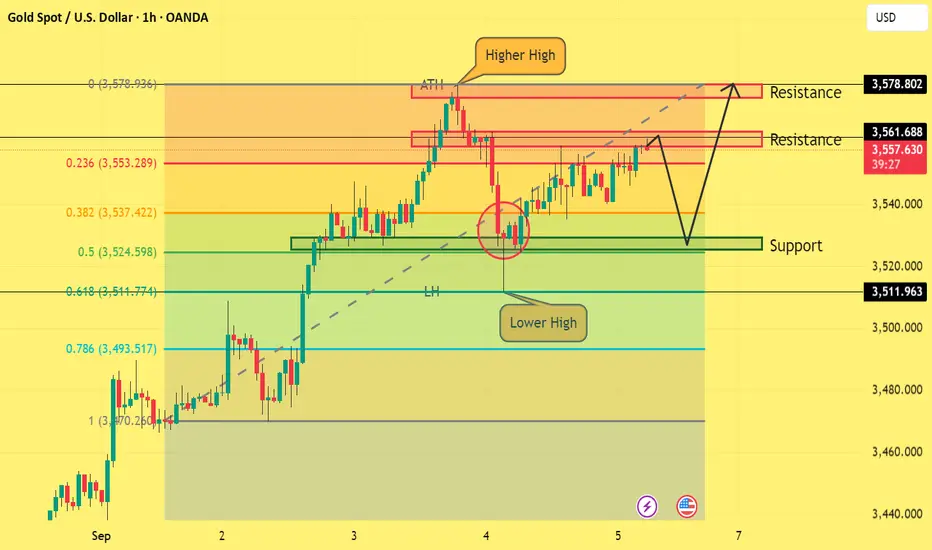
Critical Zone 3610–3620:Shorts Get Ready!After retreating to around 3579, gold rebounded again and has now reached a high of around 3614. Fortunately, the gold retracement gave us the opportunity to safely exit our previous short positions, and we accurately seized this pullback opportunity to close all our previous short positions at a break-even point.
As I said, closing my short position does not mean that I am not optimistic about the gold pullback, but in the process of executing swing trading, we need to constantly adjust to make our short entry price more favorable to us. Therefore, closing the short position entered at a relatively low price previously gives us the flexibility to enter the short position again at a higher price.
Gold was quickly pulled up to around 3614 in the short term. There was almost no headwind in the short term. Driven by the dual expectations of interest rate cuts and risk aversion demand, the bullish momentum was strong. However, in the short term, we are currently facing the 3610-3620 trend line resistance area, so I still do not advocate continuing to chase more gold; on the contrary, no matter what, I will continue to try to execute swing trading to short gold in the 3610-3615 area.
Although the bulls have risen strongly, it does not actually provide a good position to enter the market to go long on gold. Since we cannot participate in long transactions, we can only try to short gold in waves during constant adjustments. On the premise of controlling trading risks, as long as we are not afraid of short-term floating losses, once gold begins to collapse, we will be the first traders to reap the benefits of the short position. Therefore, when gold is facing the trend line resistance area of 3610-3620, I first considered and executed a short trade at 3610-3615 as planned, hoping that the gold market will have a good retracement as some unsteady funds show signs of profit-taking!

Gold | H1 Head and Shoulders | GTradingMethodHello Traders 👋
We’re finally getting a clean pattern to short Gold on.
🧐 Market Overview:
The chart is showing signs of exhaustion. We already have negative RSI divergence and decreasing volume on the right shoulder — both pointing to weakening buying momentum. I’m still waiting for confirmation before fully committing, but the setup is looking solid.
📊 Trade Plan:
Risk/Reward: 4.0
Entry: 3640.77
Stop Loss: 3652.5
Take Profit 1 (50%): 3602.4
Take Profit 2 (50%): 3581.5
💡 GTradingMethod Tip:
When trading reversal patterns like head & shoulders, volume is key. A drop in volume on the right shoulder often strengthens the case for a potential move lower.
🙏 Thanks for checking out my post!
Make sure to follow me to catch the next setup and let me know what you think — will this H&S confirm, or does Gold still have room to push higher?
📌 Disclaimer:
This is not financial advice. This content is to track my trading journey and for educational purposes only.

XAUUSD Outlook – Monday, Sept 8, 2025
Gold ended last week volatile after weak U.S. NFP data. Jobs grew only 22K vs 75K expected, while unemployment stayed at 4.3% and wages held steady. The weak labor print supports Gold, but the lack of immediate Fed easing signals capped gains at the $3,600 resistance.
Technical View
Price tested $3,600 but stalled.
Short-term projection shows a likely lower high near $3,590–3,595 before selling resumes.
Key supports: $3,580 → $3,556 → $3,530.
Outlook
Monday: Expect choppy trade, with sellers defending $3,600. A drop toward $3,580 then $3,556 is likely.
This Week: Below $3,600, bias stays bearish toward $3,530. Only a daily close above $3,600 reopens $3,615–3,630.
Trading Plan
Sell rallies near $3,590–3,595, stop above $3,605.
Targets: $3,580, $3,556, extended $3,530.

Elliott Wave Analysis XAUUSD – September 7, 2025
Momentum
• D1: Momentum is still declining → a corrective move may occur before turning bullish again.
• H4: Currently in the overbought zone → a main downward move is expected tomorrow.
• H1: About to enter the oversold zone → a short-term upward bounce may appear tomorrow morning.
Wave Structure
• D1 timeframe:
o Price is forming a 5-wave structure (i, ii, iii, iv, v) in black.
o Currently, wave iii (black) is in its final stage.
o Waves i, ii, iii were formed after a momentum cycle → the next corrective cycle will likely indicate where wave iv (black) will end.
• H4 timeframe:
o Price may be completing wave v (purple).
o Once wave v (purple) finishes → the market is expected to enter corrective wave iv (black).
• H1 timeframe:
o As in the previous plan, the ABC correction in blue looks like a 3-wave structure, but there is also the possibility of a Flat pattern forming.
o In a Flat scenario, price may break above the previous high and then reverse downward.
o Currently, price showed overlapping moves followed by a strong breakout → suggesting two possible scenarios:
Scenario 1:
o Wave v (purple) is unfolding, with price heading toward the wave v target.
o Two target zones: 3614 and 3678.
o In this case → avoid counter-trend trades, wait for corrective wave iv (black) to complete and then enter Buy positions in line with wave iii (black).
Scenario 2:
o A Flat structure is forming.
o Wait for wave C to complete wave iv (purple).
o H4 momentum supports this scenario (decline to oversold then reversal).
o Wave C targets: 3553 and 3530 → ideal Buy entry zone.
Trading Plan
1. Buy Zone 1: 3353 – 3350
o SL: 3340
o TP1: 3596
2. Buy Zone 2: 3532 – 3530
o SL: 3522
o TP1: 3552

XAUUSD (Gold) – NFP Day Setup | Fibonacci Levels in Focus.Description: Gold has created its all-time high at 3578 and is now consolidating ahead of today’s NFP release.
Using Fibonacci retracement on the 1H chart (3470 → 3578):
61.8% → 3512 (tested yesterday)
50% → 3530–3526 (double-tested support)
23% → 3558(current area)
🔎 Trade Scenarios for NFP:
Bullish case (weak NFP): Holding above 3530–3526 could push Gold towards 3578 and even 3600.
Bearish case (strong NFP): A break below 3530–3526 opens the way for 3512, and only below this level Gold may turn bearish till 3470 again.
📊 Key Notes:
Wait for the first NFP volatility spike to settle (15–30 mins).
Focus on 3530–3526 as the pivot zone today.
Risk management is crucial — NFP often creates fakeouts.
⚠️ This is my personal analysis, not financial advice. Trade safe!
Regards: Forex Insights Pro.
#XAUUSD #Gold #NFP #Fibonacci #Forex #Trading #PriceAction #DayTrading #RiskManagement #USD
GOLD SELL ON PLAYGold time for good correction, as we have touch upper trend line and give us good decline candle formation

Silver’s 14-Year High: Can the Rally Continue?Silver is currently trading at a 14-year high, and the real test begins as price approaches key resistance levels near $41.00–$41.65.
The same factors pushing gold higher are likely behind silver’s climb. Traders remain confident that the Federal Reserve will cut interest rates in September. At the same time, there’s growing concern that the Trump administration is working to undermine the Fed's independence and jeopardise the US economy.
However, short-term conditions suggest that silver may be somewhat overextended, increasing the likelihood of a pullback or consolidation before any further upside. For now, the trend remains potentially bullish as long as XAG/USD holds above the critical trendline support at $39.906. In case of any sharp dips, the safety net might sit around $37.49.

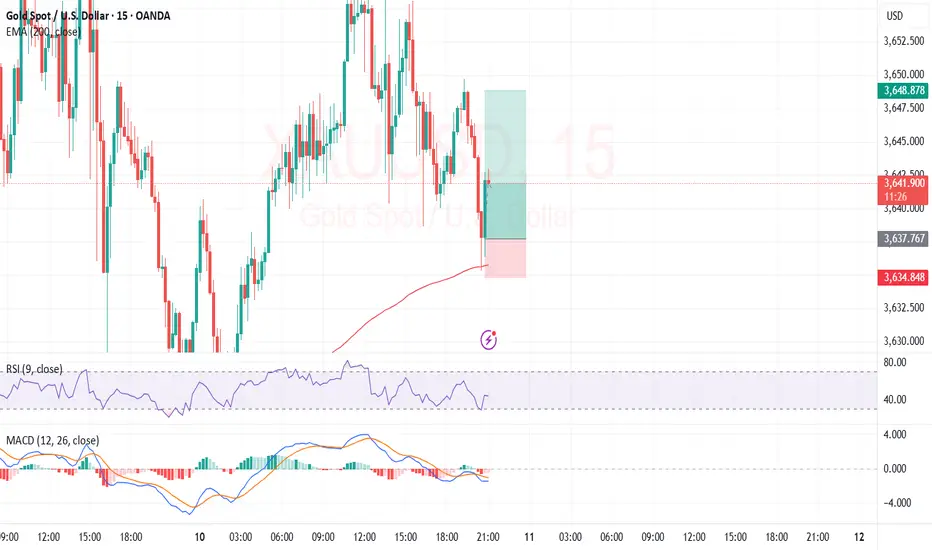
EMA200 Reject on M15 + RSI ReboundPrice was going down but reacted hard off of the EMA200. RSI was coming up from a very low c.14% on M5. 3 down liquidity spikes in a row on M5. As soon as I got into the trade momentum got behind it. Great trade so far. Also once in, MACD crossed over bullish on M5.
XAUUSD TRADE SETUPWait for retest the entry level and bullish momentum then take a trade for Buy otherwise skip this setup

XAUUSD Update After NFP, What Next ?Yesterday's NFP report sent gold prices soaring again.
We'll see how it moves next week, with the bulls likely to continue their upside movement.
Have a blessing week ahead !

XAUUSD on DROP on NFP??We have two patterns at moment head & Shoulder on H1 and Rising wedge pattern on H4. Today's NFP is comming and Expectations for this NFP aren’t high. A decent result could lift dxy and push gold lower.
What possible scenario we have?
• XAUUSD on undisputed bullish rising wedge channel,I'm expecting market will fall from 3556-3563 range and my Targets will be 3510 them 3490.
• secondly if any H1-H4 candle closes above 3580 then our analysis will be invalid
All the entires should be taken once all the rules are applied

Where will this new uptrend land ?Upon reaching previous ATHs we have seen slight retracement and consolidation varying in length before the next bull push has occurred, last consolidation lasted 4 months finally breaking last week. So where will this one land before the expected rate cut on the 15th or will it surge beyond all expections off the back of a cut ?

Gold | H1 Head and Shoulders | GTradingMethodGood morning Traders 👋
Gold... Could you please give us a head & shoulders to short? 🧐
I’m keeping a close watch here for potential shorting opportunities. An H1 head & shoulders setup would be the first prize.
After such a strong run over the past few days, surely gold owes us a relief rally at some stage...?
What do you think — are we lining up for a short, or does gold have more gas left in the tank?

Elliott Wave Analysis XAUUSD – 09/09/2025🌀
————————————-
🔹 Momentum
• D1 timeframe: Momentum is still rising but occurs in the overbought zone → the upside potential is limited.
• H4 timeframe: Momentum is also in the overbought zone and starting to reverse. Although H4 candles are still pushing up, a divergence is forming → signaling weakening bullish strength.
• H1 timeframe: Momentum remains in the overbought zone → no expectation for an extended bullish leg.
————————————-
🔹 Wave Structure
• D1 timeframe:
o Price is in the final stage of wave iii (black) and preparing for wave iv (black).
o By principle, it is better to stay patient and wait for wave iv to complete before looking for Buy entries into wave v (black), rather than trying to catch the top of wave iii.
o Current price is approaching the 2.618 Fibonacci extension of wave i (black).
• H4 timeframe:
o Price is currently within wave v (purple).
o Since it has already broken above wave iii (purple), a reversal could happen anytime.
o Completion of wave v (purple) will also complete wave iii (black).
• H1 timeframe:
o Inside wave v (purple), a full 5-wave structure (green) can be counted.
o The potential confluence zone for the end of wave 5 (green), wave v (purple), and wave iii (black) is 3669 – 3678.
o After this zone, price is expected to correct into wave iv (black), which often develops sideways and shallow.
➡️ Once wave iv (black) is complete, the market is expected to continue higher into wave v (black).
➡️ High liquidity zones highlighted by the Volume Profile will act as support, preventing a deep decline and providing momentum for wave v (black).
• Wave iv usually retraces back to the wave 4 of a smaller degree. Currently, we have two key areas:
o Wave 4 (green) around 3597
o Wave iv (purple) around 3552 – 3530
————————————-
🔹 Trading Plan
1. Buy Zone 1: 3598 – 3596
o SL: 3588 (or 3579 for wider risk tolerance)
o TP1: 3669
2. Buy Zone 2: 3553 – 3550
o SL: 3540
o TP1: 3597

Pullback or trend reversal? One article gives you the answerGold fell nearly $60 in the Asian session, providing an opportunity for a pullback. It rebounded after touching the previous top and bottom conversion position of 3520-3500. The current stage is a process of gold correction, with intraday fluctuations as the main feature. A major trend change may occur after the release of NFP data tomorrow.
Although there is a downward correction at present, the bullish momentum is still there and it has not effectively fallen below the previous top and bottom conversion positions. Both bulls and bears have opportunities in the short term. In the short term, focus on 3550-3560. If it fails to rebound effectively and stabilize above, it will continue to fluctuate today. Friends who execute long trades based on yesterday’s trading strategy can consider exiting the market near 3550-3560.
The focus today is on the release of ADP data, which will provide a certain reference direction for the possible trend of NFP data tomorrow.

XAUUSD: Ready for the Next Breakout?Hello, let’s take a broader look at OANDA:XAUUSD together.
Last Friday, gold surged strongly. The precious metal is now moving around 3447 USD and has become more attractive than ever.
So, what’s next for gold?
From an economic and market perspective, gold is benefiting from ongoing uncertainties, global conflicts, and speculation about the FED’s upcoming rate cuts. The weakening USD has been the driving force behind gold’s continued rally at this stage.
Technical outlook: Gold has just broken higher and is now facing its all-time highs. The formation of an ascending triangle is approaching its climax, and XAUUSD may break out to test higher levels. The answer is only a matter of time. A candle close above the resistance zone will be something to watch for, with the first psychological target at the 3500 USD round level.
Given the current setup, I’m waiting for XAUUSD to push through resistance.
What about you—what do you think will happen? Share your thoughts in the comments.
Good luck!

GOLD London Session Update – Sideways Before the Big MoveGold (XAUUSD) continues to consolidate within the 354x – 352x range, building a clear sideways structure after its recent strong rally.
📊 MMFLOW VIEW (London Session Focus)
The market is now in accumulation mode as the London session develops – volatility is expected to increase as liquidity builds up.
If price breaks above ATH 3546, momentum could quickly push gold towards the Liquidity Sell Zone 357x.
On the other hand, if 3526 support fails, we may see a liquidity sweep with price retracing into the FVG & Liquidity Buy Zone 3508 – 3480 before resuming the bullish trend.
🔑 Key Levels (London Watchlist)
Resistance: 3546 | 3564 | 3576
Support: 3526 | 3508 | 3494 | 3480
⚠️ During the European session, gold often builds false breaks to collect liquidity before the real move.
👉 Stay patient and wait for a clean breakout confirmation before committing to a position.
🔥 Follow MMFLOW TRADING for real-time plans into the New York session – don’t miss the big move!

GOLD BEARS ARE TACKING OVER FOR NOWGOLD Fail to 3655 RESISTANCE and trade bellow that, give me good case to take this sell