GOLD - Daily analysis🟡 Overall Structure
The chart shows a completed impulsive A-B-C corrective structure forming after a strong prior bullish rally. The key Fibonacci retracement zones are used to identify potential reversal and continuation levels.
Wave Interpretation
Wave A:
The initial decline from the top marks the start of correction.
It halted around 38.2% retracement (~4050–4065) where a temporary support was formed.
Wave B:
A counter-trend pullback toward 4200–4220 region is visible — this aligns with the 50% to 61.8% retracement of the A-leg, a common retracement level for corrective wave B.
Wave C (Expected):
The chart notes suggest that if price breaks below 4065, the decline will accelerate impulsively toward 3900, aligning with 61.8% retracement of the prior major upswing.
The final support for the full A-B-C correction could form around 3750, which is the C-wave completion zone and coincides with 78.6% retracement from the top.
Important Observations
Immediate Level to Watch:
A decisive break below 4065 will trigger an impulsive fall toward 3900, confirming C-wave progression.
Bullish Support Zone:
Around 4050–4080, price previously bounced — this area remains the last bullish defense.
Bearish Continuation Zone:
Below 4050, bearish acceleration expected toward 61.8% retracement (3900) and then 3750.
Volume Confirmation (not visible but implied):
The structure suggests momentum divergence on B-wave; lower highs indicate potential reversal strength building.
Wave Projection Summary
Wave Type Direction Target Remarks
A Corrective Down 4050 Completed
B Counter Up 4200 Likely completed or near
C Impulsive Down 3900 → 3750 Expected continuation
Conclusion
🔸 Gold’s current corrective phase appears to be in the B–C wave stage.
🔸 Trigger Zone: Fall below 4065 = confirmation of impulsive C-wave toward 3900.
🔸 Support Zones: 3900 (61.8%), 3750 (final 78.6%).
🔸 Invalidation: A move above 4230–4250 would negate the immediate bearish count and open retest of previous highs.
⚠️ Disclaimer
This analysis is for educational and informational purposes only and should not be considered as financial advice. Market conditions can change rapidly, and price movements may deviate from projections. Please conduct your own due diligence or consult a qualified financial advisor before making any trading or investment decisions. The author holds no responsibility for any losses incurred. Trade safely and manage risk responsibly.
Trade ideas

Third Gold Long AttemptSo, the crypto, especially some key altcoins on the move, more talk about ending shutdown but Hassett kill the stock market. Crpto and gold is rising despite that. There is something going on but timing seems to be hard to detirmine. I want to enter the weekned on with long position.

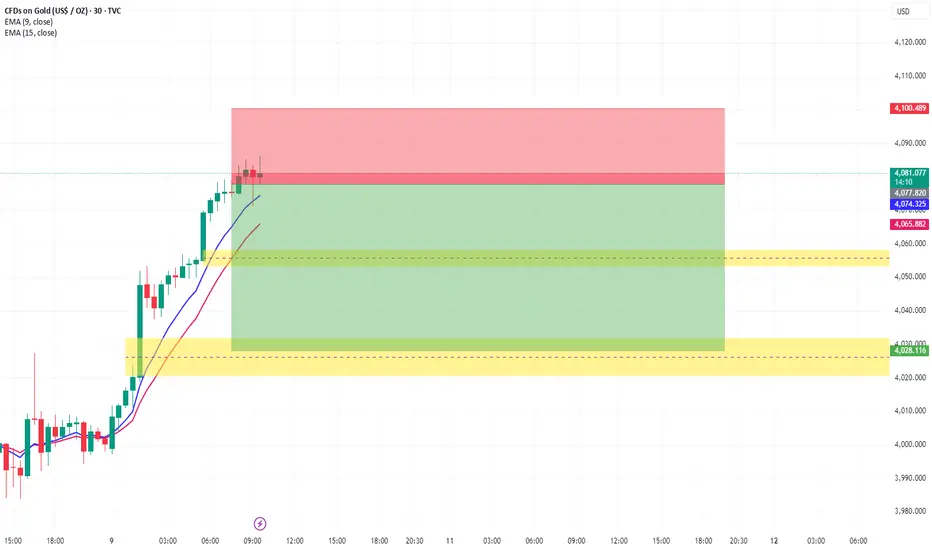
XAU/USD 30m Trend Structure and Structural Summary analysisOANDA:XAUUSD Here’s a quick breakdown of the **structure and trend** you’ve got on **GOLD (30-minute timeframe)**:
### 🔹 Trend Structure:
1. **Overall Trend:**
The chart shows a **strong bullish trend** before the current setup — a clear **impulse move up** with higher highs (HH) and higher lows (HL).
2. **Current Market Behavior:**
After a strong bullish leg, the price reached a **resistance zone around 4080–4090**, where you entered a **short (sell)** trade.
* The **red zone** marks your **stop-loss** (above recent highs).
* The **green zone** marks your **target area**, which aligns with a **previous demand zone** (yellow box below).
3. **Key Structures:**
* **Demand Zones (Yellow Boxes):**
These are areas where buying pressure previously pushed the market up — potential retracement or reaction zones.
* **EMA Cross (9 & 15):**
The EMAs are still pointing upward — showing **bullish momentum**, though short-term exhaustion is visible.
* **Possible Pullback Zone:**
Price might retrace to test the **first yellow zone (4055–4065)** or the **second one (4020–4030)** before resuming upward or breaking structure lower.
### 🔹 Structural Summary:
* **Main structure:** Bullish (higher timeframe).
* **Substructure (current 30m leg):** Potential **bearish correction** or **retracement** after overextension.
* **Key confirmation:** A break below **4060 (lower yellow zone)** would signal a **shift to bearish structure** on this timeframe.
XAUUSD Intraday Outlook - 10 Nov 2025XAUUSD Intraday Outlook - 10 Nov 2025
Gold Spot trades at 4,082 (12:00 PM UTC+4) with bullish bias into NY session.
📌 Market Context: Wyckoff phase D re-accumulation; Dow trend up; Gann 45° support at 4,050.
Daily (1D): Inside bullish pennant above Ichimoku cloud; RSI 62; harmonic bat PRZ 4,120 cap.
4H: Rising wedge testing 4,095; EMA50>EMA200; watch for bull trap if RSI diverges near 70.
1H: Cup-handle breakout at 4,086; VWAP reclaimed; Bollinger mid-band = launchpad.
30M: Sym triangle coiling; hidden bull divergence on RSI; volume contracting before move.
15M: Bull flag above 4,072; Tenkan/Kijun bull cross; anchored VWAP holding.
5M: Falling wedge breakout retest 4,078; candlestick hammer confirms demand.
Primary Long Setup: Buy 4,076-4,082 on VWAP hold; SL 4,066; TP1 4,094, TP2 4,108, TP3 4,120.
Momentum Add: Scale above 4,095 if volume >20% avg and RSI>65; trail stop 4,088.
Counter Short: Fade 4,118-4,124 only on bearish engulfing + RSI>75; SL 4,132; TP 4,098.
Breakout Confirmations: 30M close above 4,095 + volume spike + Ichimoku span green.
Key Supports: 4,072 (flag base), 4,060 (4H Kijun), 4,045 (Gann square level).
Key Resistances: 4,095, 4,108, 4,120 harmonic PRZ.
Indicators Dashboard: BB squeeze (30M), RSI rising, VWAP slope up, EMA stack bullish.
Pattern Alerts: Monitor head-and-shoulders failure if 4,060 breaks; possible bear trap.
Volatility: ATR(14) 5M = 6 pts; adjust size; expect expansion around COMEX open.
News Risk: Watch US CPI Nov 12; reduce exposure 30 minutes prior.
Risk Rules: Risk ≤1.25% per idea; lock gains after TP1; move stop to BE +2.
Trade Management: If price stalls 4,094 with declining volume, partial exit.
Sentiment: COT shows commercials short but covering; supports short-term squeeze.
Volume Profile: HVN at 4,080 acts magnet; LVN 4,092 could accelerate breakout.
Ichimoku Checklist: Price>Cloud, Tenkan>Kijun, Chikou above price = bullish alignment.
Gann Time: 90° cycle hits 16:00 UTC; expect impulse wave.
Harmonics: AB=CD targets 4,108; crab extension warns above 4,124.
Psych Levels: 4,100 round number likely liquidity sweep—wait for confirmation.
Educational outlook only; follow your plan and manage risk.

Latest Gold Analysis and Trading Strategies:
I. Fundamental Analysis
1. Safe-Haven Sentiment Supports Gold Prices
The prolonged U.S. government shutdown has sparked concerns about its economic impact. Combined with weakness in global stock markets (especially in tech and AI-related shares), market risk appetite has cooled, leading some capital to flow into defensive assets like gold.
Signs of a cooling labor market have intensified investor concerns about the economic outlook, further driving safe-haven demand for gold.
2. Monetary Policy Expectations Capping Gold's Upside
The market's reassessment of the Federal Reserve's monetary policy outlook has resulted in a lack of strong follow-through buying for gold, limiting its upward potential.
Recent economic data and cautious statements from policymakers have kept the market in a wait-and-see mode, leading gold to maintain a range-bound pattern in the short term.
II. Technical Analysis
1. Weekly and Daily Chart Structure
The weekly chart closed with a bullish doji candlestick, indicating a balance of power between bulls and bears. The price is consolidating within the familiar range of $3928 - $4030.
A break above the $4030 resistance could open the door for further upside, targeting $4075 - $4100. A break below the $3928 support could lead to a decline towards the previous low near $3887.
2. Short-Term Signals
4-Hour Chart: A small ascending triangle pattern is forming. The price is facing temporary resistance around $4030, but the K-line is gradually moving above the short-term moving averages, suggesting a slightly bullish bias in the near term.
1-Hour Chart: The previous short-term uptrend has been broken. The $4030 level now acts as key resistance, with immediate support located at $3965. Monitor volume changes closely, as a significant increase in volume could signal an impending trend reversal.
III. Gold Trading Strategy
Trading Approach:
Primary Strategy: Focus on buying on dips, with selling on rallies as a secondary tactic.
Key Levels:
Resistance: 4030 - 4050
Support: 3970 - 3950
Detailed Plan:
1. Long Strategy (Buying)
Look to enter long positions in batches if the price stabilizes within the 3970-3950 range.
Set a stop loss below 3940.
Take profit targets at 4030 and then 4050.
If the price strongly breaks above 4030, consider entering a light long position, targeting 4070-4100.
2. Short Strategy (Selling)
Consider light short positions if the price faces resistance in the 4030-4050 range.
Set a stop loss above 4060.
Take profit targets at 3980-3960.
If the price breaks directly below 3928, consider entering a short position on a pullback, targeting 3900-3887.
Risk Warning:
Closely monitor developments regarding the U.S. government shutdown, signals from the Federal Reserve, and changes in global market risk sentiment.
Be cautious of potential acceleration in the trend if there is a significant increase in trading volume accompanying a breakout from the current range.
IV. Summary
Gold is currently trading within a short-term consolidation range between 3928 and 4030. Fundamental safe-haven support and pressure from monetary policy expectations are creating a tug-of-war. The recommended trading approach is to primarily buy near support and sell near resistance within this range, then follow the breakout direction if key levels are breached. Implement strict risk management and remain flexible to adapt to news-driven market movements.
XAU/USD 07 November 2025 Intraday AnalysisH4 Analysis:
-> Swing: Bullish.
-> Internal: Bullish.
Analysis and bias remains the same as analysis dated 20 October 2025.
Price has printed as per previous intraday expectation by printing a bearish CHoCH which indicates, but not confirms, bullish pullback phase initiation.
Price is currently trading within an established internal range, however, I will continue to monitor price with regards to depth of pullback.
Intraday expectation:
Price to continue bearish, react at either discount of 50% internal EQ, or H4 supply zone before targeting weak internal high priced at 4,380.990.
Note:
The Federal Reserve’s sustained dovish stance, coupled with ongoing geopolitical uncertainties, is likely to prolong heightened volatility in the gold market. Given this elevated risk environment, traders should exercise caution and recalibrate risk management strategies to navigate potential price fluctuations effectively.
Additionally, gold pricing remains sensitive to broader macroeconomic developments, including policy decisions under President Trump. Shifts in geopolitical strategy and economic directives could further amplify uncertainty, contributing to market repricing dynamics.
H4 Chart:
M15 Analysis:
-> Swing: Bullish.
-> Internal: Bearish.
You will note how price remains contained in consolidation between a supply and demand zone. The rest of my analysis and bias remains the same as bias date 29 October 2025.
As expected, price has printed a bullish CHoCH to indicate bullish pullback phase initiation.
Price is now trading within an established internal range.
Intraday expectation:
Price to continue bullish, react at either premium of internal 50% EQ or M15 demand zone before targeting weak internal low, priced at 3,886.465.
Note:
Gold remains highly volatile amid the Federal Reserve's continued dovish stance, persistent and escalating geopolitical uncertainties. Traders should implement robust risk management strategies and remain vigilant, as price swings may become more pronounced in this elevated volatility environment.
Additionally, President Trump’s tariff announcements, particularly against China, are expected to further amplify market turbulence, potentially triggering sharp price fluctuations and whipsaws.
M15 Chart:

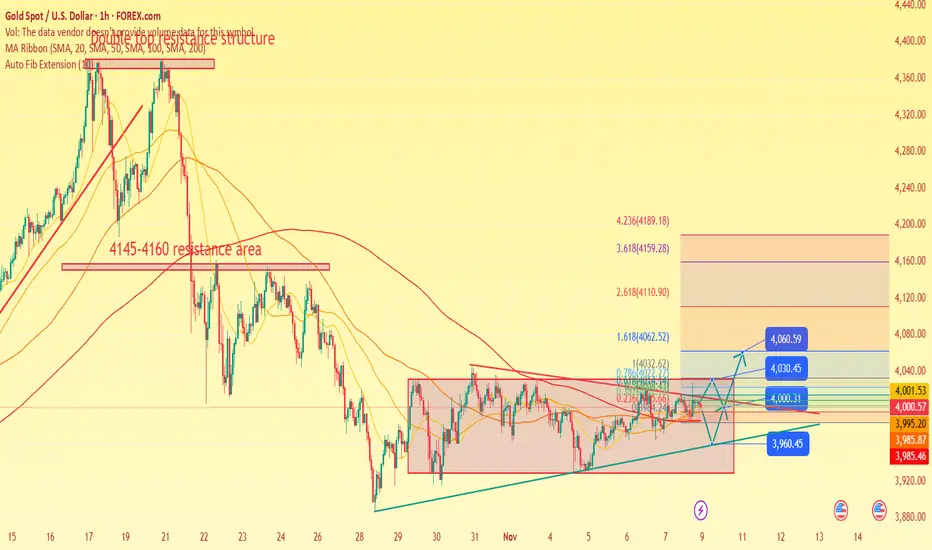
XAUUSD – WAITING FOR CONFIRMATION OF UPTREND – TARGET 4050 💛 XAUUSD – WAITING FOR CONFIRMATION OF UPTREND – TARGET 4050 🎯
🌤 1. Overview
Hello everyone 💬
Gold today is still in a phase of hesitation – waiting for signals to confirm a new trend.
On the H2 chart, the price has broken the downtrend line and is retesting this line. The structure of “higher lows” indicates that buying power is gradually gaining the upper hand.
The previous peak around 4018 is currently the decisive point for the trend – if the price confirms a breakout above, the uptrend could extend towards the 4050 area.
Currently, the market is fluctuating within the range of 3964 – 4018, and needs to break out of this range to determine a clearer direction.
💹 2. ICT Perspective
📈 The price has broken the downtrend line and retested the structure on the H2 chart – an early signal for the potential formation of an uptrend.
🟣 The 3964–4018 area is a short-term liquidity accumulation zone before the price expands.
🔹 OB 4040–4042 coincides with significant resistance, suitable for short sell (scalp) orders if there is a strong reaction.
💫 When the price exceeds 4018, the uptrend structure will be confirmed and the expansion target could head towards 4050 – 4077.
🎯 3. Reference Trading Plan
💖 BUY Scenario (priority when confirmed)
Entry: above 4018 | SL: 4011
TP: 4025 – 4033 – 4050 – 4077
💢 Short SELL Scenario (scalping)
Entry: 4040–4042 | SL: 4046
TP: 4022 – 4015 – 3998
⚠️ 4. Important Notes
Clear confirmation is needed when breaking the 4018 area before entering a buy order.
If the price continues to fluctuate within the 3964–4018 range, trading should be limited.
Today is Friday, manage risk more strictly, prioritize accuracy in each order.
🌷 5. Conclusion & Interaction with LanaM2
Gold is showing positive signals 💛
Be patient and wait for reactions around the 4018 area – this could be the start of a new uptrend if clearly confirmed.

Beware of a reversal during gold price fluctuations.
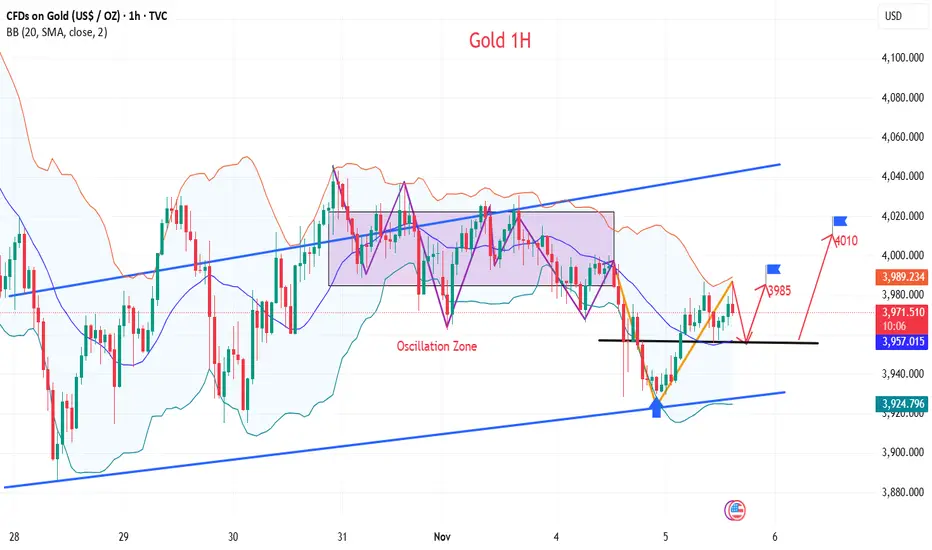
News:
On Tuesday (November 4), spot gold fell 1.7% to close at $3,931.78 per ounce, while December U.S. gold futures also declined 1.3%, settling at $3,960.50. Increased internal divisions among Federal Reserve officials and a cooling of market expectations for a December rate cut helped the dollar index break through the 100 mark, reaching a more than three-month high, significantly pressuring gold prices.
However, concerns about a U.S. stock market bubble and the longest government shutdown in history continue to provide safe-haven support for gold prices. In the short term, gold bears have a slight advantage, and gold prices face the risk of further correction. However, if Wednesday's ADP private sector employment data is disappointing, gold prices could see a dramatic reversal.
Specifically:
Gold maintains a long-term bullish tone, with prices continuing their upward trend today, holding above key moving averages. The daily chart shows that the long-term bullish outlook remains solid as gold prices hold above the key technical level of the 100-day exponential moving average (3675.95).
However, in the short term, given that the 14-day Relative Strength Index (RSI) is hovering near the midline, a further consolidation phase cannot be ruled out, reflecting that gold is currently in a neutral momentum phase.
On the upside, the first resistance level to watch is the psychological level of $4000. If upward momentum continues, spot gold is expected to retest the October 31 high of $4045. A further break above this level would target the October 23 high of $4155.
On the downside, initial support for gold is located at the lower Bollinger Band at $3850. The emergence of more bearish candlestick patterns could indicate continued downward pressure, potentially dragging prices to the next support level – the September 25 low of $3720. The bullish outlook for gold remains unchanged.
Trading strategy:
Buy:3955-3950, SL: 3945, TP: 3985-4010-4030
XAU/USD 06 November 2025 Intraday AnalysisH4 Analysis:
-> Swing: Bullish.
-> Internal: Bullish.
Analysis and bias remains the same as analysis dated 20 October 2025.
Price has printed as per previous intraday expectation by printing a bearish CHoCH which indicates, but not confirms, bullish pullback phase initiation.
Price is currently trading within an established internal range, however, I will continue to monitor price with regards to depth of pullback.
Intraday expectation:
Price to continue bearish, react at either discount of 50% internal EQ, or H4 supply zone before targeting weak internal high priced at 4,380. 990.
Note:
The Federal Reserve’s sustained dovish stance, coupled with ongoing geopolitical uncertainties, is likely to prolong heightened volatility in the gold market. Given this elevated risk environment, traders should exercise caution and recalibrate risk management strategies to navigate potential price fluctuations effectively.
Additionally, gold pricing remains sensitive to broader macroeconomic developments, including policy decisions under President Trump. Shifts in geopolitical strategy and economic directives could further amplify uncertainty, contributing to market repricing dynamics.
H4 Chart:
M15 Analysis:
-> Swing: Bullish.
-> Internal: Bearish.
You will note how price remains contained in consolidation between a supply and demand range. The rest of my analysis and bias remains the same as bias date 29 October 2025.
As expected, price has printed a bullish CHoCH to indicate bullish pullback phase initiation.
Price is now trading within an established internal range.
Intraday expectation:
Price to continue bullish, react at either premium of internal 50% EQ or M15 demand zone before targeting weak internal low, priced at 3,886.465.
Note:
Gold remains highly volatile amid the Federal Reserve's continued dovish stance, persistent and escalating geopolitical uncertainties. Traders should implement robust risk management strategies and remain vigilant, as price swings may become more pronounced in this elevated volatility environment.
Additionally, President Trump’s tariff announcements, particularly against China, are expected to further amplify market turbulence, potentially triggering sharp price fluctuations and whipsaws.
M15 Chart:

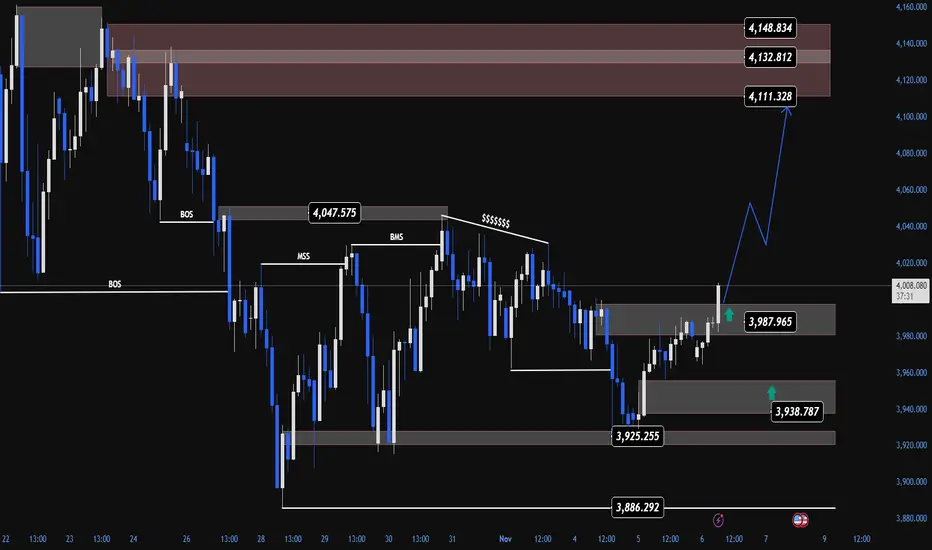
GOLD Smart Money Might Be Preparing for Bullish Structure ShiftGold (XAU/USD) is showing early signs that Smart Money may be shifting from a distribution phase into a short-term accumulation phase.
After a strong bearish leg marked by multiple Breaks of Structure (BOS), recent price behavior now suggests the potential formation of a Market Structure Shift (MSS) — an early indication that institutional flow could be changing direction.
💭 1️⃣ Market Structure – When the Market “Whispers” About Reversal
On the H1 timeframe, we can clearly observe a chain of consecutive BOSs since the 4,150 zone, but what’s intriguing is the reaction around 3,925 – 3,940.
Here, price failed to make new lower lows and began rejecting strongly — leaving several rejection wicks that reveal smart money absorption at discounted prices.
This area represents the discount zone of the current range — where institutions often collect liquidity from trapped sellers before pushing price toward premium levels for redistribution.
The latest Break of Market Structure (BMS) around 3,987 confirms that bearish momentum is weakening, and buyers may be starting to reclaim control in the short term.
🩶 2️⃣ Supply & Demand Zones – Footprints of Smart Money
Karina is currently watching three key zones shaping this market phase:
Demand Zones:
3,938 – 3,925: A strong demand base formed after the initial push upward — acting as a key support if price retraces.
3,986 – 3,988: A minor demand zone formed post-BMS, serving as a potential “reaccumulation point” for the next bullish leg.
Supply Zones:
4,111 – 4,149: Unmitigated Bearish Order Block from the previous decline — the most probable upside target for Smart Money in the current swing.
The projected SMC scenario: Smart Money accumulates at demand → builds liquidity → drives price into the upper supply zones.
🧭 3️⃣ Liquidity Context – Quiet but Purposeful Movement
Gold currently sits within a liquidity equilibrium — a transitional area where both buy- and sell-side liquidity coexist.
Below, 3,886 remains a pocket of sell-side liquidity, while above, large buy-side liquidity pools rest around 4,110 – 4,150.
Smart Money may first collect the remaining sell-side liquidity before triggering a strong upward displacement toward the upper supply zones — following the familiar pattern:
liquidity sweep → displacement → continuation.
🌙 4️⃣ Trade Scenario – Flow With Smart Money, Not Against It
As long as price holds above 3,938 – 3,987, the short-term bias for Karina is bullish.
If price retests these demand zones and forms bullish confirmations (e.g., bullish engulfing or clear order flow shift), it may set the stage for a push toward the 4,111 – 4,148 region.
Entry: 3,938 – 3,987
Stop Loss: 3,925
Take Profit: 4,111 – 4,148
This setup presents roughly a 1:4 R:R, consistent with a buy-side liquidity grab strategy under SMC principles.
🌷 5️⃣ Reflection – When the Market Moves in Silence
After an extended bearish phase, Gold now seems to be accumulating strength in quiet preparation.
This is not a loud reversal — it’s a subtle rebalancing of institutional flow.
To Karina, the market right now feels like a slow, gentle rhythm — calm, deliberate, and full of hidden intent. Sometimes, the key isn’t chasing volatility, but listening to the whispers of Smart Money in the silence of price action. 🌸
This analysis reflects Karina’s personal perspective and is not financial advice.
Do you see the same structure forming? Could this be the early stage of a bullish cycle, or just another liquidity grab? Let’s discuss below 💬
Gold's downtrend – Bears Aiming for 3700!OANDA:XAUUSD remains locked in a clear downtrend, respecting EMA resistance and forming consistent lower highs and lower lows. Every rally has been rejected at the upper EMA bands, confirming sellers are still in control.
🔻 Bearish Confluences
EMA Ribbon Rejection – Price continues to close below all key EMAs; bearish structure remains intact.
Fibonacci Retracement Zone – The recent pullback into 38.2–61.8% (3969–3995) aligns with strong resistance.
Market Structure – Series of lower highs and lower lows continue to confirm trend direction.
Momentum Confirmation – Weak bullish candles and upper-wick rejections signal exhaustion.
Downward Fib Channel – Projection points toward continuation toward extended downside targets.
🎯 Fibonacci Targets
TP1 (38.2%) → 3928.34 – Initial support / first partial close area.
TP2 (61.8%) → 3887.19 – Mid-range target aligning with previous structural support.
TP3 (161.8%) → 3700.00 – Extended bearish target if momentum continues; full move projection.
Entry Zone: 3969 – 3995 (Fib retracement + EMA resistance)
Stop-Loss: Above 4036

Gold (XAU/USD) Technical Analysis based on your 15-minute chart:Support Level: 4,100 – 4,106
Resistance Zone: 4,120 – 4,125
Target Point: 4,147
Trend Bias: Short-term corrective upward trend within a broader pullback phase.
📈 Scenario 1 – Bullish Setup
If price continues to hold above the support zone (4,100 – 4,106):
Expect a rebound toward 4,120 (minor resistance).
A breakout above 4,120 could trigger further buying toward the target point at 4,147.
This move aligns with the projected ascending channel shown on the chart.
Confirmation Trigger: Bullish breakout and sustained candle close above 4,120.
📉 Scenario 2 – Bearish Continuation
If g RUS:SI1! RUS:GD1! RUS:MX1! RUS:USDRUB.P RUS:RI1! RUS:IRUS.P RUS:SV1! RUS:CR1! RUS:CNYRUB.P RUS:HS1! old breaks below 4,100:
Selling pressure could resume, driving price down to 4,085 – 4,080.
A break below 4,080 would confirm deeper correction and invalidate the bullish setup.
⚖️ Summary
Bias Entry Zone Target Stop Loss
Bullish (Buy) 4,106 – 4,112 4,145 – 4,150 4,095
Bearish (Sell if break below) < 4,100 4,085 – 4,080 4,120
💬 Analyst Note
The market is showing short-term accumulation after a selloff. Watch for volatility around 4,110–4,120; momentum confirmation is key before taking a position. RUS:NG1! RUS:BR1!

XAUUSD Scalp IdeaPlan this trade SL will be 60 pips from entry. Wait for 1 minute green candle inside zone. If break zone without green candle then avoid

GOLD (XAUUSD) Daily Outlook – Bears Eyeing Major Drop Ahead!After a short-term bullish push, Gold is now testing a strong supply zone around $4,130–$4,200 where price previously rejected sharply. If buyers fail to break above this level, we could see fresh bearish momentum kicking in.
🔻 Key Zones:
Resistance (Sell Zone): $4,130 – $4,220
Support (Buy Zone): $3,650 – $3,720
📊 Scenario:
I’m watching for rejection candles or bearish confirmation around the red zone. If price reacts strongly, I expect a drop toward $3,700, completing a clean supply-to-demand move.
💡 Trading Idea:
Wait for confirmation before short entries — patience pays!
Target the green zone for potential long opportunities once we reach strong demand.
⚙️ Bias: Bearish until we see a clear breakout above $4,220.
What’s your take? Do you see Gold holding the supply zone or breaking through it? 🤔
👇 Drop your thoughts below!
#XAUUSD #GoldAnalysis #PriceAction #SmartMoneyConcept #ForexTrading #TradingView #Frank


Gold Correction Setup – Watch 4,060 Zone📊 Market Structure
After completing the structure break (ChoCH + BoS) at the 4,080 USD zone, gold has sustained a strong upward momentum and created Equal High 4,140 – 4,145 USD , corresponding with the short-term resistance Order Block .
Currently, the price is technically reacting in this area, indicating short-term profit-taking pressure from buyers after a prolonged rally.
The H1 structure remains bullish as the main support zones have not been broken.
A potential scenario is that the price will adjust to FVG zones or support to absorb liquidity before bouncing towards the Liquidity Zone 4,197 USD — the upper liquidity peak.
💎 Key Technical Zones
• OB & Resistance: 4,127 – 4,140 USD
• Support Zone: 4,104 – 4,107 USD
• FVG Zone #1: 4,060 – 4,067 USD
• FVG Zone #2: 4,031 – 4,037 USD
• Liquidity Target: 4,197 USD
🎯 Trading Plan
1️⃣ SELL Setup – Pullback Scalping
If the price reacts sharply downward at the OB zone 4,127 – 4,140 USD:
• Entry: 4,132 – 4,137
• SL: 4,150
• TP1: 4,104
• TP2: 4,067
→ Short-term trade, leveraging the pullback to the support zone to prepare for the next BUY setup.
2️⃣ BUY Setup – Continuation
When the price completes its adjustment to the FVG or Support Zone and a bullish signal appears (rejection / engulfing):
• Entry: 4,067 or 4,037
• SL: 4,020
• TP1: 4,140
• TP2: 4,197
• TP3: 4,210
→ Main setup in the current trend. Prioritize buying at the discount zone after sufficient liquidity is absorbed at the lower zone.
🧠 Vincent’s View
The H1 structure remains buyer-favored. Current adjustments are technical, not reversals.
The FVG zone around 4,060 USD is a key point to observe price behavior — if a clear reaction occurs, this could be the starting point for the next upward wave to 4,197 USD .
“Liquidity fuels the next move — let the market breathe before the impulse.” ⚜️
⏰ Timeframe: 1H
📅 Updated: 11/12/2025
✍️ Analysis by: Captain Vincent

Nov 12, 2025 - XAUUSD GOLD Analysis and Potential Opportunity📊 Analysis:
From the daily close, price shows signs of hesitation — the market seems to be waiting for a clear breakout.
Today, I’ll be closely watching for a decisive move above 4149 or below 4097 to determine direction.
In the short term, keep an eye on 4133:
If price fails to hold above 4133, momentum may shift to the downside, giving bears the upper hand.
If price breaks below 4125, bearish momentum will likely accelerate, and I’ll switch to selling rallies into resistance.
If price breaks and holds above 4133, I’ll re-evaluate the structure for a potential continuation setup.
🔍 Key Levels to Watch:
• 4162 – Resistance
• 4150–4155 – Resistance zone
• 4145 – Resistance
• 4138 – Resistance
• 4125 – Key support
• 4116 – Support
• 4106 – Support
• 4097 – Support
• 4089 – Support
📈 Intraday Strategy:
SELL: If price breaks below 4125 → target 4120, with further downside toward 4116, 4110, 4106
BUY: If price holds above 4133 → target 4138, with further upside toward 4145, 4149, 4154

GOLD (XAUUSD) – Strong Rejection Zone Holding | Possible 200–250Gold just tapped into a major H1 supply zone (highlighted in red), a level that previously caused a sharp sell-off. Price is showing early signs of exhaustion and rejection again from this same area.
📌 Key Observations:
🔴 Supply Zone (Strong Resistance)
Price has returned to the same rejection block where sellers aggressively pushed the market down last time. This area remains unbroken, showing that smart money is defending this level.
⚠️ Weakening Bullish Momentum
Even though Gold climbed up with a clean structure, the candles entering the zone are slowing down — showing smaller bodies and more wicks. This often signals absorption by sellers.
🟥 Liquidity Taken Above Previous Highs
Gold swept the minor highs above the zone, grabbed liquidity, and immediately rejected. This is a classic SMC setup.
🟢 Demand Target Below
If sellers take control, the next major liquidity zone is the 3,850–3,780 support area (green zone). This is where the previous strong rally began — meaning there is unmitigated demand waiting there.
📍 My Projection:
If price continues rejecting the current supply zone, I expect a clean drop into the demand zone below.
This gives a potential 200–250 pip sell setup.
---
Bias: Bearish Reversal from Supply Zone
Sell Range: Inside the red zone
Targets:
• TP1: 3,950
• TP2: 3,880
• TP3: 3,800 (full mitigation area)
Invalidation:
A strong H1 candle closing above the red supply zone.
---
Summary
Gold is respecting the supply zone with clear rejection. If momentum shifts bearish, we could see a corrective leg down into the demand area. Watching for confirmation before entering

Gold prices continue to rise, with a target price of $4200.Gold prices continue to rise, with a target price of $4200.
As shown in the 4h chart:
1: Gold prices remain strong.
2: The current resistance level is $4150.
3: Once $4150 is broken, gold prices will continue to rise, with the next target price range being $4200-$4300.
4: If the price experiences a significant drop near $4150, forming a structural correction, we can wait for the price to fall back to the $4060-$4080 range, forming a right-side bottom pattern, before continuing to go long.
November 11th, Intraday Trading Strategy:
Aggressive Strategy:
Buy (1): $4135-$4140
Buy (2): $4120-$4125
Stop Loss: $4115
Take Profit (1): $4160-$4180
Take Profit (2): $4200
Trade with the trend, allocating order proportions appropriately.
Conservative Strategy: Observe and wait for the market to fully test the resistance level near $4150 before making a decision. If the $4150 resistance level holds, wait for the price to retrace to the $4060-$4080 range before considering going long.
If the price breaks through $4150 directly, consider establishing a small long position, with a stop loss similar to the aggressive strategy.
I have already adopted an aggressive buying strategy.

15 minutes time frame buy position Hi guys as you see I published an Idea with buy position at 15 minutes time frame.
Please getting action after approval candle is ready over top zone of 5 minutes chart

Xauusd And GC1! Advanced manipulation During pairs like gc1!, we swept the 4124.6 low meanwhile on xauusd we didn’t. Since xauusd is the pair that shows higher accuracy of the pair the sweep on gc1!, mgc1! Are manipulation and created a liquidity pool that’s waiting to get taken out after taking out the accumulated range high. On the 1h timeframe we tapped into an imbalance then displaced internally since we formed a liquidity pool and formed an imbalance we’re likely going to change our trajectory to shorting the market and we might make an early reversal.

XAUUSD 2 scenariosXAU/USD – Gold Outlook (Two Scenarios)
Today I’m watching two possible scenarios for gold:
1️⃣ Technical View: After yesterday’s strong rally, gold may need a pullback to collect liquidity before continuing higher — no real correction has occurred yet. A retracement could offer better long entry opportunities around support zones.
2️⃣ Fundamental View: Despite the overextended move, bullish momentum could continue, driven by optimism over a potential U.S. Senate deal to end the government shutdown. Such an agreement could weaken the USD and boost risk sentiment, favoring further gains in gold.
💡 Summary: Technically expecting a short correction, but fundamentals remain bullish, keeping the 4,100 level in sight if positive news confirms.

ANFIBO | XAUUSD - Effort to Breakout??? [11.10.2025]Hi guys, Anfibo's here!
XAUUSD Analysis – Daily Trading Plan
Overall Picture:
OANDA:XAUUSD is currently trading at the upper boundary of its sideways H1 channel, a key decision point where market sentiment is being tested. This resistance zone has repeatedly acted as a ceiling for price during the current consolidation phase. The question now is whether this level will once again trigger a technical pullback, or if bullish momentum—supported by ongoing geopolitical uncertainty—will be strong enough to deliver a clean breakout and start a new impulsive leg upward. Price action today will be crucial in determining whether gold continues ranging or transitions into a breakout phase.
Trading Plan for Today:
>>> BUY ZONE:
(1) ENTRY: 4040 - 4050
SL: 4030
TP: 4135 – 4150 - 4200
(2) ENTRY: 4070 - 4080 (small vol)
SL: 4065
TP: 4135 – 4150 - 4200
Risk Management:
- Stick to small-to-medium positions within the range; increase size only on confirmed breakouts.
- Keep stops tight, as sideways phases tend to trigger false signals.
- Maintain Risk:Reward ≥ 1:2 and avoid overtrading in choppy conditions.
- Reassess market bias once the H1 channel is decisively broken.
Conclusion:
Gold is sitting right at the “make-or-break” zone of its sideways channel. This area will tell us whether the market plans to reject and pull back, or gather enough momentum for a powerful breakout. As always, we remain flexible: trade the range until it breaks, and prepare to shift bias immediately if a confirmed breakout occurs.
HAVE A WONDERFUL NEW WEEK GUYS!
