GOLD Trading Opportunity! BUY!
My dear friends,
My technical analysis for GOLD is below:
The market is trading on 4192.2 pivot level.
Bias - Bullish
Technical Indicators: Both Super Trend & Pivot HL indicate a highly probable Bullish continuation.
Target - 4210.4
Recommended Stop Loss - 4182.6
About Used Indicators:
A pivot point is a technical analysis indicator, or calculations, used to determine the overall trend of the market over different time frames.
Disclosure: I am part of Trade Nation's Influencer program and receive a monthly fee for using their TradingView charts in my analysis.
———————————
WISH YOU ALL LUCK
Trade ideas

Gold (XAUUSD) Prices Poised to Break Higher, Targeting 4358Gold (XAUUSD) continues to exhibit a bullish sequence from the 28 October low, suggesting further upside potential. The rally from that low is unfolding as a five‑wave impulse, with wave 1 concluding at 4245.22, as reflected in the one‑hour chart. Following this, wave 2 developed into a zigzag Elliott Wave structure. From the peak of wave 1, wave ((a)) ended at 4144.97, while the subsequent rally in wave ((b)) terminated at 4211.31. The decline in wave ((c)) reached 3996.25, thereby completing wave 2 at a higher degree.
The metal has since resumed its upward trajectory in wave 3, decisively breaking above the prior wave 1 peak. This confirms that the next leg higher has commenced. From the conclusion of wave 2, wave ((i)) ended at 4132.81. The corrective pullback in wave ((ii)) finished at 4022.07, forming a double three structure. One more leg higher is anticipated to complete wave ((iii)), after which a modest pullback in wave ((iv)) should occur. The market is then expected to advance again in wave ((v)), thereby concluding wave 3.
The potential target for this advance lies within the 100% to 161.8% Fibonacci extension of wave 1, calculated at 4358–4579. In the near term, as long as the pivot at 3996.25 remains intact, any pullback should find support within a sequence of 3, 7, or 11 swings, paving the way for continued strength. This structure reinforces the bullish outlook and highlights the importance of maintaining the key pivot level to sustain momentum.

STRONG BULLISH MOMENTUM
This month is a good month for bulls and with fed rate cut on the way , gold is going to continue with it long term bullishness ,
we will have a good buy later today or lately by tomorrow so be around
Bullish Momentum Builds: XAUUSD Long Setup ActivatedGold (XAUUSD) is showing bullish momentum after holding above the key support zone, making it favorable for a long position. A buy entry is suggested from 4252, where price has shown strength and potential for continuation to the upside.
If bullish momentum sustains, gold could move toward the next resistance levels, with the primary upside target set at 4300.
To manage risk effectively, a Stop Loss (SL) at 4215 is placed below the recent support area to protect against downside volatility
KEY LEVELS
Entry 4252
Target 4300
Stop Lose 4215

XAU/USD Bullish Continuation Setup Toward 4,223 After Liquidity 1. Market Structure
The chart highlights a COCH (Change of Character) followed by a BOS (Break of Structure), signaling a shift from bearish to bullish structure.
Several smaller coch points confirm internal bullish structure building.
2. Liquidity & POI Zones
There is a clear liquidity sweep near the PDL (Previous Day Low), where price dipped into a demand zone to collect orders.
An Extreme POI (Point of Interest) sits below current price — this acted as the strong reaction zone for the bullish move.
PDH (Previous Day High) is marked as an early short-term target/liquidity area.
3. Expected Move
The projection (zig-zag line) indicates bullish continuation after a pullback into the POI zone.
The target is marked around 4,223.629, matching the red horizontal resistance line.
The EMA (9) serves as dynamic support, showing price respecting the bullish trend.
4. Probability Outlook
As long as price stays above the trendline and POI, the bias remains bullish.
A break below the POI would invalidate the setup and open the lower liquidity region again.

Be careful! Gold is likely to experience significant fluctuationGold continues to trade within a short-term ascending channel and is now approaching the upper boundary, which aligns with a major resistance zone formed by the previous swing high. This creates a strong confluence area where sellers may become active.
As price enters this resistance cluster, we expect selling pressure and a potential rejection. Based on the current momentum, a clean breakout above this zone does not seem likely in the short term.
Most Probable Scenarios
1-A final upward push toward the upper boundary of the channel
2-A rejection from the resistance zone
3- A move back toward the lower boundary of the ascending channel
4- If the channel breaks to the downside, an extended decline toward the next key support level becomes likely
This week includes several high-impact events—most importantly:
The U.S. Federal Reserve interest rate decision,
which may significantly increase volatility in gold.

XAUUSD Excellent week closing As i discussed throughout my Friday's session
What was my stance & Postions:
I took buy in my early trade before NY session and target was 4236 which xauusd delivered
I have waited for Gold to deliver decent pullback from supply area which i mentioned 4245-46 and I found such on $4245-4250 Structural supply test. I have engaged big Lot set of Selling orders ($4265 Stop) and closed my orders on $4204 & 4200 in extension .
I want to take this moment to congratulate the traders who followed my calls and patiently held their orders. Great job — enjoy the profits and have a great weekend.

Bullish Continuation Setup on Gold Toward 4255This chart shows Gold (XAU/USD) moving within a recovering bullish structure after breaking out of a descending trendline. Price has retested the breakout zone, highlighted by the blue support area, and is holding above the Ichimoku cloud, which signals improving momentum. Recent candles show buyers defending the 4200–4210 region, confirming this zone as a key support level. The upward arrow indicates a possible continuation move toward the upper trendline if buying pressure remains steady. Overall, the chart reflects stabilization after a period of volatility, with price attempting to build higher highs and higher lows. With this momentum holding, the next potential upside level is 4255, which stands as the logical target for the current bullish move.
If you found this XAUUSD analysis helpful, don’t forget to LIKE 👍 and COMMENT 💬!

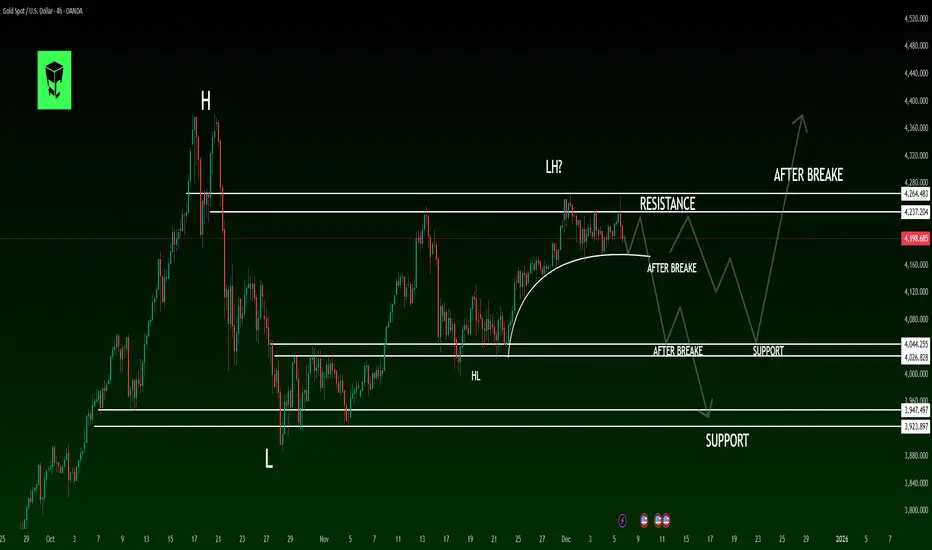
GOLD Technical Analysis: Multi-Layer Structure & Key Scenarios 4H Timeframe Analysis ⏰
Gold has entered a structural corrective phase after a strong bullish trend that formed a Higher High (HH). This correction is visible in momentum, volume, and market structure with a confirmed Lower High (LH) formation. The combination signals a powerful Decision Point that will determine gold's medium-term direction. 🔄
🔶 Market Structure Breakdown
◼️ 1. Main Bullish Wave 🚀
After breaking October resistance, price formed a HH
HH showed buyer strength, but first weakness appeared:
Sharp rejection from top → Declining bullish momentum 📉
◼️ 2. Correction Phase ⬇️
Initial correction formed a Higher Low (HL)
Price failed to break previous high → Valid LH formed
Market entered neutral-to-bearish structure
◼️ 3. Current Status 🎯
Price is trapped between two key zones:
Resistance:4270
Support: 4022
Key Levels:
🔸 Resistance Zone: LH formation area, multiple rejections
Breakout = Correction end + New bullish wave 🟢
🔸 Mid Support: Trend anchor level
Break = First confirmation of bearish structure 🔴
🔸 Major Support:4170
Break = Medium-term correction activation 📉
🔶 Probable Scenarios
🟢 BULLISH SCENARIO (Resistance Break)
Break & close above LH zone
R→S conversion
New bullish wave with volume increase
Targets:4440
🔴 BEARISH SCENARIO (Support Break)
Failure at resistance + Mid support break
Deep correction wave + New LL formation
Targets: 3950
🔶 Market Psychology 🧠
Current price action shows:
Buyer caution ⚠️
Gradual sell orders accumulation at resistance
Limited seller power in corrections
High sensitivity to fundamental news 📰
Typical pre-breakout/breakdown consolidation
📢 Your Thoughts?
Comment below with your analysis! 👇
⚠️ RISK DISCLAIMER:
Trading carries high risk. Always educate yourself and use proper risk management. Not financial advice. 📚
Gold risky scalpVery risky scalp am holding. Gold is bullish overall. Counter trend trade.
You can join me if you can. Risk little and manage trade well. Breakeven at 1:3RR

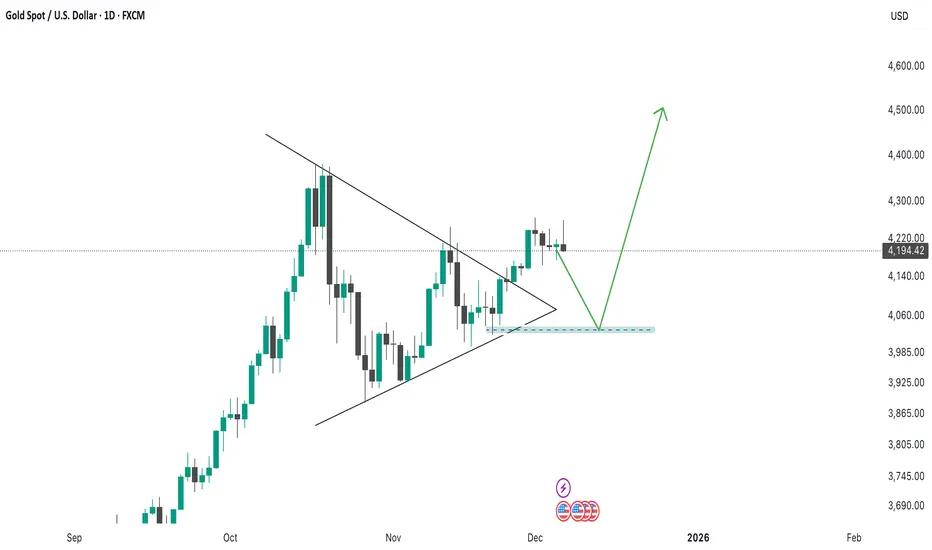
Daily Time Frame AnalysisAs you can see gold has already breakout in daily time frame so it is the time to retest. In a weekly time frame market already made a CRT setup for which 50% target is 4131-4135 and final target for CRT is 4040 so if we consider CRT will be played till 50% then this is also a good demand zone to throw market upwards a lot and if we think 100% then final demand zone is also a good zone so play accordingly.In december market will be sideways as it will expand in Q1 of 2026. For now 4252-4262 is strong resistance to break for 8 dec till 50% CRT so you can look for short with sl 4272 and target can be 4131-4133.
Gold Weekly Summary and Forecast 12/6/2025Gold has closed with another 2W candle with a bullish green bar. I am still expecting it to rise for the next two weeks. Buying is still my main strategy.
For next week, I will expect price to test 4152 and rise from there. Ultimate target will be 4400.

XAUUSD H1 | Bullish Bounce Off SupportMomentum: Bullish
Price is currently above the ichimoku cloud.
Buy entry: 4,225.37
- Pullback support
- 38.2% Fib retracement
Stop Loss: 4,215.10
- Swing low support
Take Profit: 4,241
- Multi-swing high resistance
High Risk Investment Warning
Stratos Markets Limited (tradu.com/uk ), Stratos Europe Ltd (tradu.com/eu ):
CFDs are complex instruments and come with a high risk of losing money rapidly due to leverage. 70% of retail investor accounts lose money when trading CFDs with this provider. You should consider whether you understand how CFDs work and whether you can afford to take the high risk of losing your money.
Stratos Global LLC (tradu.com/en ): Losses can exceed deposits.
Please be advised that the information presented on TradingView is provided to Tradu (‘Company’, ‘we’) by a third-party provider (‘TFA Global Pte Ltd’). Please be reminded that you are solely responsible for the trading decisions on your account. Any information and/or content is intended entirely for research, educational and informational purposes only and does not constitute investment or consultation advice or investment strategy. The information is not tailored to the investment needs of any specific person and therefore does not involve a consideration of any of the investment objectives, financial situation or needs of any viewer that may receive it. Past performance is not a reliable indicator of future results. Actual results may differ materially from those anticipated in forward-looking or past performance statements. We assume no liability as to the accuracy or completeness of any of the information and/or content provided herein and the Company cannot be held responsible for any omission, mistake nor for any loss or damage including without limitation to any loss of profit which may arise from reliance on any information supplied by TFA Global Pte Ltd.

Gold Buy - Set upGold has been bullish for the month of December, price action is observed. Trading is being reactive and not predictive, use proper risk management and Happy trading. OANDA:XAUUSD FOREXCOM:XAUUSD CAPITALCOM:DXY

XAU/USD LongM & W: Uptrend, respecting the lows
D: Uptrend, price retraced 88.6%
4H: Downtrend, price made a higher low trending long
1H: Uptrend, price hit -61.8 on H1 FIB + RSI showing oversold and bearish divergence.
CURRENTLY: I'm looking for price to go short to retest H1 trendline, @previous resistance, and continue long.

XAUUSD H1 BULLISH REVERSAL SETUP Bias: Short-term Bullish as long as support holds Key Levels to Watch Support Zone: (Use your chart’s demand level — price is currently reacting from a bullish zone) Resistance Zone: (Your chart’s previous swing high / supply) Buying Idea If Gold stays above the support zone and shows bullish confirmation (H1 bullish candle / rejection wick), you can look for buy setups. Possible Targets: TP1: Nearest H1 resistance TP2: Previous swing high TP3: Fresh supply zone on the H1 chart Selling Idea If Gold breaks below the support zone with strong bearish momentum, a short-term drop is possible. Possible Targets: TP1: Nearest minor support TP2: Previous H1 low TP3: Strong demand zone below

XAUUSD Near Key Support – Bounce or Breakdown?Gold is currently trading around 4188, pulling back from the strong supply zone between 4220–4268, which aligns with:
The November High zone,
A daily close level from the start of the month,
A repeated rejection area seen multiple times on the chart.
This region remains a heavy supply area, and the market is struggling to break and hold above it.
At the same time, gold still respects the mid-range ascending structure, holding above the trendline and staying within the broader bullish channel. This creates two possible outcomes based on whether buyers defend nearby support levels.
PLAN A – Bearish Correction Into Last Week’s 50% Zone
Scenario:
If the current support fails, gold can slide toward the stronger demand area at 4143–4134, which also aligns with:
50% retracement of last week’s candle,
The lower boundary of the grey demand box,
A previously untested bullish accumulation region.
This zone is a logical liquidity magnet and would complete the deeper correction.
Possible Entries:
Wait for price to hit 4143–4134
Look for bullish reversal candles inside this zone
Targets for a bounce:
TP1: 4175
TP2: 4200
TP3: 4220
(If buyers reclaim structure, a retest of 4250+ becomes possible later)
If selling:
Early confirmation = 4H break below 4170
Downside Targets: 4143 → 4134 → (extension) 4100
Invalidation:
Sharp reclaim above 4205.
PLAN B – Bullish Recovery From Mid-Level Support
Scenario:
Price wicks down into the light-grey support zone around 4175–4185, finds buyers, and pushes back toward 4200–4220, eventually retesting the supply at 4226–4268.
Why it makes sense:
This zone acted as previous resistance turned support.
It lines up with the ascending channel midline, which has been respected multiple times.
Buyers may defend this level before the market decides direction.
Possible Entries:
4180–4175 on bullish rejection
Confirmation: bullish engulfing or higher-low formation
Targets:
TP1: 4200
TP2: 4220
TP3: 4250–4268 (major supply)
Invalidation:
Clean 4H close below 4170.

Report 4/12/25Report summary
Global markets are rotating around a single macro hub: Japan. Super-long JGB yields keep pressing higher as the Bank of Japan signals it will “thoroughly discuss” another rate increase at the Dec. 18–19 meeting; 30-year JGBs hit fresh records and 10-year JGBs are referenced near ~1.9%, while the 10-year U.S. Treasury closed about 4.09% earlier in the week. A BOJ that tightens sooner forces a partial un-wind of yen carry, softens the broad dollar, and supports duration and gold. Into today’s close the WSJ Dollar Index is lower on the week (around 96.4–96.8), U.S. equities are firmer, spot gold is near record territory, and oil stays heavy.
Market reactions
The risk complex leaned risk-on even as rates volatility remained elevated. The S&P 500 and Dow added to recent gains (S&P ~6,829–6,849; Dow ~47,474–47,883), while the WSJ Dollar Index slipped (≈96.39–96.82), reflecting yen and euro strength at the margin. Gold futures settled around $4,215–$4,273/oz, maintaining a powerful up-trend. WTI January futures remain under pressure near the high-$50s per barrel (~$58.6), underscoring the demand/discipline standoff in energy.
Japan remains the global swing factor. Tokyo core CPI is running at 2.8% y/y, and BOJ guidance has pulled forward market expectations for another hike. That has driven super-long JGB yields to multi-decade highs and nudged U.S. 10-year yields back above 4%. The key transmission is via reduced appetite for foreign duration by Japanese lifers/pensions and the prospect of a gradual carry-trade un-wind.
Strategic forecasts (1–3 months)
Baseline. A “firm-but-not-frantic” BOJ path and fading U.S. recession odds keep global growth on a modest expansion track. With BOJ normalization proceeding and the Treasury term premium contained, the dollar’s broad trend tilts lower; risk assets oscillate but avoid a disorderly de-risk. In this base case, S&P 500 makes incremental highs on breadth improvement while gold consolidates above the $4,000 handle as real rates top out. WTI stabilizes in a $55–65 range absent new supply shocks.
Upside scenario. If BOJ proceeds cautiously and U.S. data moderate without cracking, the dollar leg lower extends and equities rerate further; Dow leadership broadens beyond mega-cap tech, and gold grinds higher on central-bank demand and currency diversification flows.
Downside scenario. A quicker BOJ hiking cadence or a liquidity air-pocket in global rates could force a sharper carry un-wind (USDJPY lurches lower), tighten global financial conditions, and hit cyclicals and small caps. Oil would likely weaken first on growth angst before rebounding on OPEC+ discipline headlines; gold would catch a haven bid.
Fiscal and political implications
Japan’s mix of rising local yields and hints of additional policy support limits outbound demand for U.S./EU duration at the margin, a quiet tightening of global financial conditions that the U.S. Treasury must navigate through a heavy auction calendar (e.g., steady bill/coupon issuance shown in the WSJ borrowing schedule). If BOJ normalization persists, Treasury will lean more on domestic real-money and banks to absorb supply, keeping the long end range-bound rather than collapsing.
In Europe, the policy mix is still growth-light and bank-friendly at the margin. The BoE’s decision to relax elements of bank capital requirements into 2027 (as reported this week) and constructive commentary around U.K. banks’ earnings capacity reduce the odds of an aggressive fiscal “tax raid” and bolster loan growth optics, supportive for U.K. financials and London listings into 2026.
Principal risks
Policy error at the BOJ remains the near-term macro swing risk. A step-change in Japanese rates could spark a disorderly carry exit and Treasury-market illiquidity just as U.S. refunding needs stay sizable. Secondary risks include any surprise U.S. data that re-accelerate inflation (re-steepening in real rates), or an energy-market supply disruption that turns WTI’s drift into a spike.
Opportunities
Positioning for a softer dollar while hedging rate volatility is the most robust cross-asset expression. That favors quality global equities funded by a modest underweight to the dollar, selective long duration via the belly if 10-year USTs hold ~4–4.25%, and strategic gold exposure while oil is cheap versus history and OPEC+ optionality. In regional terms, selective Japan financials benefit from a steeper local curve; U.K. banks screen better on regulatory optics and earnings leverage after the shift in capital stance.
Asset-by-asset impacts and levels
XAUUSD (Gold). Momentum remains constructive with futures near $4,215–$4,273/oz as the dollar softens and real yields stall. Base case: consolidation above $4,000 with breakout risk if BOJ tightening coincides with any U.S. growth wobble. Risk: a sharp real-rate back-up would cap gains.
S&P 500. The index holds near highs (~6,829–6,849). A softer dollar/benign real-rate path supports earnings translation for multinationals and risk appetite. Watch breadth, small-cap participation, and any funding-stress spillovers from Japan.
Dow Jones. The Dow trades ~47.5k–47.9k, reflecting cyclical leadership and bank strength. If U.K./U.S. bank policy optics keep improving and rates volatility calms, industrials and financials can extend.
USDJPY. The pair trades around ¥156 per dollar this week, with risk skewed to yen strength if BOJ guidance hardens at the Dec. 18–19 meeting. A measured grind toward ¥150 is plausible on carry normalization; a disorderly dash through ¥150 would imply broader deleveraging.
DXY / WSJ Dollar Index. The WSJ Dollar Index is down on the week (≈96.4–96.8), consistent with firmer yen/euro. Baseline is a gentle drift lower if BOJ tightens and U.S. data cool. Upside dollar risk revives with a U.S. inflation surprise.
Crude Oil (WTI). Front-month WTI sits in the high-$50s (~$58.6). Demand concerns and ample non-OPEC supply keep a lid on rallies, but position-cleaning looks advanced; risk/reward improves on dips toward mid-$50s with OPEC+ supply management as the catalyst.

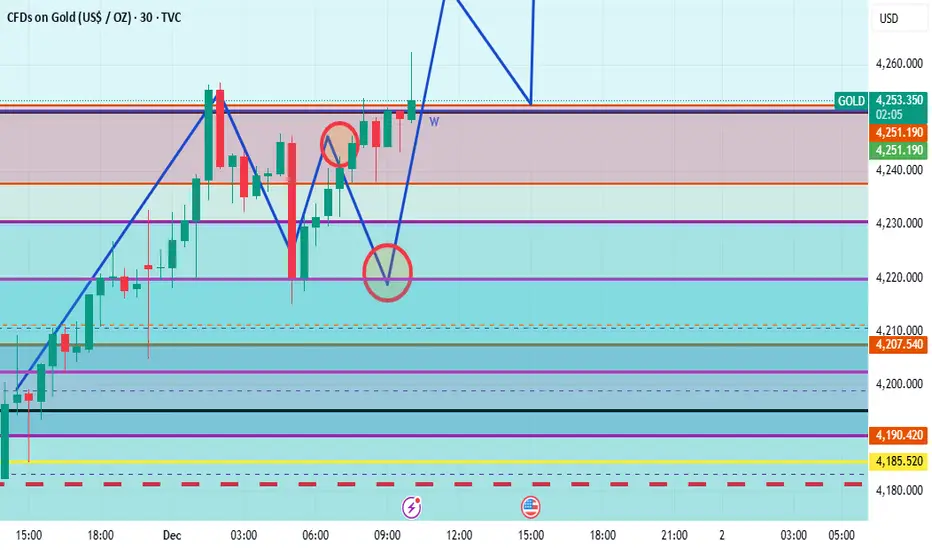
XAU/USD – Recovery structure testing 4,239 – 4,2611. Market Context
On the M30 timeframe, the previous downtrend has started to weaken. The price has formed a series of Equal Lows patterns, indicating that the short-term bottom is protected, followed by a Change of Character (ChoCH) and a slight Break of Structure (BOS). This reflects that the selling pressure has decreased in intensity and the market is transitioning into an accumulation phase, preparing for a recovery.
The downtrend line is still valid, but the price is approaching the breakout area. Closing candles above this line will confirm a phase transition.
2. Key Price Areas
Upper Supply Zone
4,239 – 4,240: the nearest strong reaction area, acting as the main resistance.
4,261: coincides with the 1.272 Fibonacci of the correction wave, a notable liquidity area.
4,282 – 4,283: expansion target, corresponding to Fibonacci 1.618.
These areas will be points where the market may show counter-reactions during the uptrend.
Lower Demand Zone
4,168 – 4,154: the Demand Zone formed from the previous strong reversal. This is the area where the market effectively absorbed selling pressure and may continue to act as support during corrections.
3. Fibo and Price Action
The current uptrend is following a standard pullback structure: from the 4,168 bottom, the price recovers to Fibonacci levels like 0.236 – 0.382, then forms a small correction before approaching the downtrend line again.
If the price surpasses the trendline, the next targets will be:
4,213 (Fibo 0.618),
then the main supply zone 4,239 – 4,240.
Closing candles above this area will pave the way for the next targets at 4,261 and 4,282.
4. Trading Plan
Buy Scenario – prioritize during correction
Early buy position: 4,188 – 4,195
(retest small structure and trendline)
Optimal buy zone: 4,168 – 4,154
(Demand Zone + deep Fibo correction)
Stop loss: below 4,150
Targets:
4,213
4,239 – 4,240
4,261
expanding to 4,282
Short-term Sell Scalp Scenario
Reaction zone: 4,227 – 4,230
(near resistance + 0.786 Fibo)
Stop loss: 4,236
Target: 4,205 – 4,195
Note: This is only a short-term strategy, not the main trend.
5. Summary
• The market structure is transitioning from a downtrend to an accumulation – recovery phase.
• If the price surpasses and holds above the trendline, the nearest target will be 4,239 – 4,240.
• The supply zones 4,239 – 4,261 – 4,282 will play a decisive role in the next uptrend.
• The most effective trading strategy remains to wait for a buy during corrections to the strong support zone 4,168 – 4,154.

XAUUSD Intraday Plan|Will Buyers Defend the Reaction Zone?Gold once again failed to reclaim the 4232 resistance yesterday.
Price tested the level but reversed sharply as sellers stepped in. We now have another test of the Reaction Zone, and price is also trending below the MA50, with the MA200 likely to be tested next.
The 4232 resistance remains the key level buyers must reclaim to attempt another push higher.
On the downside, if the MA200 and the First Reaction Zone fail to hold, watch the Support Zone. If selling pressure continues, the HTF Support Zone becomes the next area where buyers may show a stronger reaction.
📌Key levels to watch:
Resistance:
4232
4274
4322
Support:
4185
4141
4102
4049
4014
3966
🔎Fundamental focus:
High-impact news on the calendar today — expect volatility. Manage risk accordingly.

XAUUSD Bullish Reversal Setup from Extreme POI – SSS Liquidity SChart Analysis
1. Market Context
The chart shows XAUUSD after a decline, now tapping into an EXTREME POI (Point of Interest).
Price reached a previous demand zone where strong reactions occurred before.
2. Liquidity Structure
Multiple areas are labeled “SSS” (Sell-Side Liquidity / Sell-Side Sweep).
Price appears to have:
Swept liquidity beneath local lows (SSS).
Tapped the extreme POI.
Shown an immediate rejection wick, indicating buyers stepping in.
This suggests the market may be exhausting sellers and preparing for a bullish leg.
3. Execution Zone
The grey region represents the entry zone (likely a demand imbalance / mitigation area).
The large blue box above marks the risk-to-reward projection for a long position.
4. Targets
You’ve placed two clear targets:
Target 1
A mid-range liquidity level at approximately 4217.279.
Represents a logical first take-profit based on prior structural inefficiencies.
Target 2
The upper area (labeled “TARGET”), aligning with:
Prior swing highs
A supply zone
A premium pricing zone (after retracement)
This would be the full TP for the bullish move.
5. Bias Summary
Bias: Bullish
Reason: Liquidity sweep + POI tap + structure showing potential for upside displacement.
The setup aligns with Smart Money Concepts:
Sweep → Mitigation → Displacement → Targeting Imbalances & Liquidity Pools

OUTLOOK XAUUSD 15m Analysis(4th December 2025)Hey guys, this is just a trade idea not a financial advise
BUY/SELL SCENARIOS:
BUYS:
1) Body Candle Close above the 4216.90 level.
2) Retest the 15m Bullish CHOCH at the 4216.90 level.
3) Create a 3/5m Bullish Engulfing Candle to capitalise on BUYS towards the 4241.60 level.
SELLS:
1) Body candle close below the 4202.31 level.
2) Retest the 15m Bearish CHOCH at the 4202.31 lev/el.
3) Create a 3/5m Bearish Engulfing Candle to capitalize on SELLS towards the 4183.00 level.
Trade smart, trade according to trading plan!

[WEEKLY] ANFIBO | Gold XAUUSD - Purple or Gray? [11.24 - 11.28]Hi guys, Anfibo’s here!
XAUUSD Weekly Trading Plan
Overall Picture:
OANDA:XAUUSD is entering a critical phase as price continues to consolidate within a tightening structure, signaling that a major directional move is likely to occur next week. After a period of strong volatility, the market is now compressing energy between the upper and lower boundaries of the current range. This setup is textbook for a break–retest–continuation model, and that’s exactly why my strategy for the upcoming week revolves around two clear scenarios: the “purple arrow” plan and the “grey arrow” plan.
The market will reveal its next major direction once either the upper boundary is broken or the lower boundary gives way. Until that happens, there is no reason to pre-commit to a biased direction — we trade what price confirms, not what we predict.
Trading Plan for Next Week:
We will react based on breakout confirmation:
>>> Scenario #1: Break ABOVE the range – Follow the “Purple Arrow” plan (BUY)
If gold pushes through the upper boundary with strength and confirms a retest, we will switch to a bullish continuation plan.
Key Resistance Levels to Watch: 4147, 4243, 4340, 4356, 4377.
A clean break above structure opens the path back into macro bullish territory, where gold may attempt to revisit or even surpass recent highs.
>>> Scenario 2: Break BELOW the range – Follow the “Grey Arrow” plan (SELL)
Once price breaks and retests the lower boundary, we will look for sell setups targeting the ladder of support levels outlined below.
Key Support Levels to Watch: 4000, 3917, 3890, 3862, 3820, 3793, 3760
A bearish breakout from the range could trigger a multi-wave continuation pattern, giving us multiple opportunities to scale in according to structure.
Risk Management:
Trade only after confirmed breakouts — avoid guessing tops and bottoms.
Keep tight SLs on retests to avoid liquidity hunts common during range boundaries.
Maintain Risk:Reward ≥ 1:2 across all setups.
Prioritize clean structure; avoid trading inside the choppy middle zone of the range.
Reassess bias immediately if the breakout fails or re-enters the range.
Conclusion:
Next week’s market will be all about patience and reaction, not prediction. With gold coiling tightly, a breakout is imminent, and both the “purple arrow” (bullish) and “grey arrow” (bearish) plans give us a clear and disciplined roadmap. Whether price breaks upward or downward, we already know exactly where our key levels are and how we will execute. Stick to structure, wait for confirmation, and let the market choose the direction for us.
HAVE A POWERFUL NEW WEEK, GUYS!
