THE KOG REPORT THE KOG REPORT:
In last week’s KOG Report we said we would continue with the chart we shared for Jackson Hole as it was going to plan and the move was expected to continue. We said we would be looking for the red box to be tapped and as long as it didn’t break, a move downside into the lower red box defence was likely. This move worked nearly to the pip giving traders a nice short trade. We then said, as long as we’re above the defence box, we’ll continue the range and look for more upside, which as you can see again played well between the boxes and then the break occurred, giving us the move upside.
A decent week in Camelot, not only on Gold but the numerous other pairs we trade and apply the algo to.
So, what can we expect from the week ahead?
Many traders will be looking at this and thinking we’re too high and stretched here to attempt a long, which is the right plan for now. Having said that, we’re not discounting a move upside during the early session, with the first level above being the 3455-60 region. It’s this region, if rejected, that can give traders the potential opportunity to attempt the short trade initially into the 3440-35 region which is the level that needs to be watched if attacked for a break.
Above, that key level 3460 is the region bulls need to push us over with volume in order for us to then look at targeting higher pricing with levels above 3468 and above that 3485-90
There isn’t a lot on the fundamental front this week apart from NFP on Friday so expect there to be a lot of choppy price action and ranging towards the middle of the week pre-event.
KOG’s bias of the week:
No bias for the week, we’ll release the daily bias instead and play level to level
RED BOX TARGETS:
Break above 3450 for 3455, 3462, 3468 and 3480 in extension of the move
Break below 3440 for 3436, 3430 and 3422 in extension of the move
Please do support us by hitting the like button, leaving a comment, and giving us a follow. We’ve been doing this for a long time now providing traders with in-depth free analysis on Gold, so your likes and comments are very much appreciated.
As always, trade safe.
KOG
GOLD trade ideas

GOLD 1H CHART ROUTE MAP UPDATE & TRADING PLAN FOR THE WEEKHey Everyone,
Please see our updated 1h chart levels and targets for the coming week.
We are seeing price play between two weighted levels with a gap above at 3593 and a gap below at 3562. We will need to see ema5 cross and lock on either weighted level to determine the next range.
We will see levels tested side by side until one of the weighted levels break and lock to confirm direction for the next range.
We will keep the above in mind when taking buys from dips. Our updated levels and weighted levels will allow us to track the movement down and then catch bounces up.
We will continue to buy dips using our support levels taking 20 to 40 pips. As stated before each of our level structures give 20 to 40 pip bounces, which is enough for a nice entry and exit. If you back test the levels we shared every week for the past 24 months, you can see how effectively they were used to trade with or against short/mid term swings and trends.
The swing range give bigger bounces then our weighted levels that's the difference between weighted levels and swing ranges.
BULLISH TARGET
3593
EMA5 CROSS AND LOCK ABOVE 3593 WILL OPEN THE FOLLOWING BULLISH TARGETS
3613
EMA5 CROSS AND LOCK ABOVE 3613 WILL OPEN THE FOLLOWING BULLISH TARGET
3638
EMA5 CROSS AND LOCK ABOVE 3638 WILL OPEN THE FOLLOWING BULLISH TARGET
3658
BEARISH TARGETS
3562
EMA5 CROSS AND LOCK BELOW 3562 WILL OPEN THE FOLLOWING BEARISH TARGET
3528
EMA5 CROSS AND LOCK BELOW 3528 WILL OPEN THE SWING RANGE
3492
3470
EMA5 CROSS AND LOCK BELOW 3470 WILL OPEN THE SECONDARY SWING RANGE
3438
3408
As always, we will keep you all updated with regular updates throughout the week and how we manage the active ideas and setups. Thank you all for your likes, comments and follows, we really appreciate it!
Mr Gold
GoldViewFX

Lingrid | GOLD Weekly Price Outlook: $3500 Target in FocusThe price perfectly fulfilled my previous weekly outlook . OANDA:XAUUSD surged to $3,447 this week, successfully breaking through critical resistance zones that had capped prices since April. The breakout above the $3,420 level represents a significant technical milestone, with the metal now eyeing the all-time high of $3,500. The TVC:DXY 2.19% weekly decline provided crucial tailwinds, despite posting its strongest monthly gain (+4.78%) since April.
Chart reveals gold has completed a classic triangle consolidation pattern and is now trading within an upward channel. The recent price action shows a decisive break above the descending resistance trendline, with strong ETF inflows supporting the rally alongside growing expectations of Federal Reserve rate cuts. The monthly timeframe confirms the long-term bullish trajectory remains intact, with the market demonstrating remarkable resilience after testing lower support levels earlier in the cycle.
The technical picture shows gold emerging from a prolonged consolidation phase, with the upward channel providing a clear roadmap for future price movement. Price action suggest institutional accumulation continues, while the break above the triangle formation indicates potential for sustained momentum. Market sentiment has shifted decidedly bullish following the resistance breakthrough.
Key support now sits at the former resistance zone around $3,400 - 3,420 zone, while the immediate target remains the psychological $3,500 level. The combination of technical breakout momentum, weakening dollar dynamics, and institutional accumulation suggests gold's uptrend has room to extend further into September.
If this idea resonates with you or you have your own opinion, traders, hit the comments. I’m excited to read your thoughts!

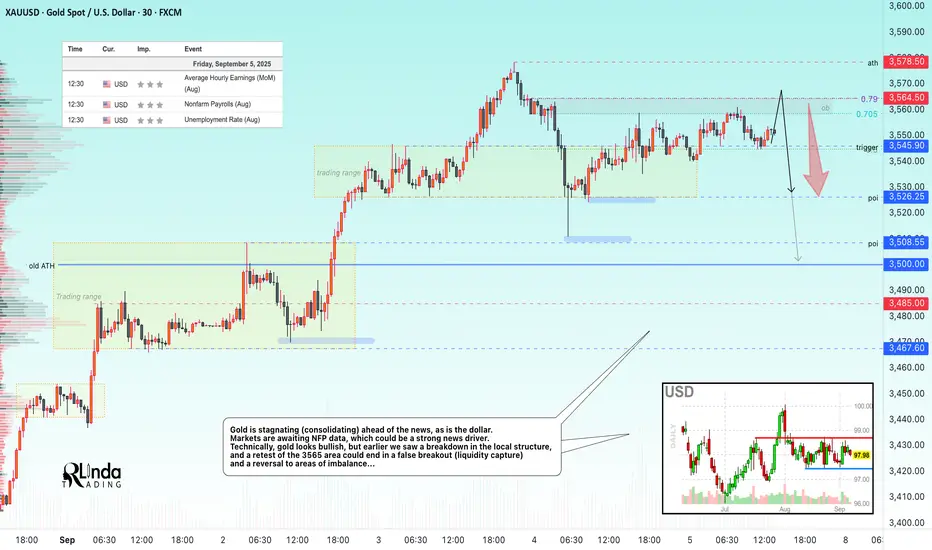
GOLD → ATH retest before NFP. High risk level...FX:XAUUSD remains in a bullish trend, but short-term dynamics depend on NFP. A break above $3578 will open the way to new highs, but profit-taking at record levels could increase volatility.
Gold remains strong ahead of US NFP data, which may confirm the Fed's policy easing. Weak data (forecast: +75K new jobs) will reinforce expectations of a rate cut and support gold. However, the risk of a correction is quite high, and any nuances could trigger liquidation. Weak employment data, namely rising unemployment and low ADP figures, are strengthening bets on a Fed rate cut, which overall only increases interest in the metal.
Resistance levels: 3564.5, 3578.5
Support levels: 3545.9, 3526, 3508
NFP data will determine the short-term trend. A weak report will lead to growth to $3600+, while a strong report will lead to a correction to 3450-3400. Technically, I expect a correction after the local bullish structure breaks down. It is not worth trading on the news; it is better to wait 20-40 minutes after the release to make decisions based on fundamental data.
Best regards, R. Linda!
Gold Keeps Searching for New HighsHello everyone, what are your thoughts on OANDA:XAUUSD ?
Gold continues to surprise us one move after another. As the new week opened, the precious metal recorded a historic breakout, trading near the $3,500 level amid ongoing global economic turbulence.
From a technical perspective, XAUUSD maintains a solid bullish structure, breaking past key resistance levels. The EMA 34 and 89 both confirm that there is still plenty of room for further upside. This rally not only reflects the market’s “gold hunting” sentiment but also opens major opportunities for traders who can catch the right wave.
So, how should we trade? At this sensitive stage, buyers may find it difficult to identify an ideal entry point. For sellers, no new top has yet been confirmed. That’s why it may be safer to wait for clearer signals—whether gold sets a new high or establishes fresh support. For short-term traders, make sure you set both SL and TP with a ratio of 1:1 or 1:2.
In addition, there are several news events this week and in the near future that could further impact gold’s trend. I’ll cover these in upcoming analyses, so stay tuned.
And you—what do you think about XAUUSD’s direction? Leave a like if you agree with my view, and drop a comment if you’d like to share your thoughts.
Good luck!

Gold 30Min Engaged ( Buy And sell Reversal Entry Detected )Time Frame: 30-Minute Warfare
Entry Protocol: Only after volume-verified breakout
🩸Bearish Reversal : 3557
🩸Bullish Reversal : 3484
➗ Hanzo Protocol: Volume-Tiered Entry Authority
➕ Zone Activated: Dynamic market pressure detected.
The level isn’t just price — it’s a memory of where they moved size.
Volume is rising beneath the surface — not noise, but preparation.
🔥 Tactical Note:
We wait for the energy signature — when volume betrays intention.
The trap gets set. The weak follow. We execute.
XAU/USD (Gold Spot vs US Dollar) on the 1D timeframe.XAU/USD (Gold Spot vs US Dollar) on the 1D timeframe.
---
Gold has broken above a long-term descending trendline.
Volume profile shows strong accumulation on the right-hand side.
The arrow is pointing upwards, suggesting a bullish breakout target.
---
🎯 Target Point
The chart clearly marks the target zone around 3,580 – 3,600 USD.
That’s the next major resistance area after the breakout.
---
⚠ Stop-Loss Idea
Below the breakout zone (~3,420 – 3,450 USD) to protect against a false breakout.
---
✅ Summary
Bullish breakout of long-term downtrend.
Target: 3,580 – 3,600 USD
Stop-loss: ~3,420 – 3,450 USD

Gold Hits Resistance – USD Strikes Back!Gold rallied strongly toward $3,575/oz, but heavy selling pressure emerged right at this key resistance. The pressure came after fresh U.S. economic data: the ISM Services PMI came in at 50.9, beating expectations of 50.1, signaling that the services sector – the backbone of the U.S. economy – remains solid. This strengthened the USD and weighed on gold, preventing it from holding its bullish momentum.
From a technical perspective, gold printed a strong rejection candle at the $3,575 resistance, confirming sellers’ dominance. After an extended rally, price is now stretched far above the EMA 34 and 89, often a signal of a likely pullback to equilibrium.
The nearest support lies at $3,473; if broken, the decline could extend further toward $3,423 . In the short term, the main scenario favors gold staying below $3,575 and correcting down toward $3,473. On the other hand, if an H4 candle surprisingly closes above $3,575 , the bullish trend could resume – but this is less likely while the USD remains supported by positive economic data.
What do you think about this trend?

THE KOG REPORT - UpdateEnd of day update from us here at KOG:
Yesterday we wanted price to come down, support and give us the move upside but we ideally wanted to RIP at the red box defence. As you can see, price broke through and completed the move into the red box above also hitting all the bullish target levels in one move.
Price up here is stretched but sentiment is still insistent on the bearish move, hence it's likely we may just support during the Asia session around the 3460-5 region and again attempt to target that high. There is a wick up there and if there is to be a reversal we need to remain below that 3475 bias level tomorrow.
We'll stick with the boxes at the moment and expect price to play them until the close.
RED BOX TARGETS:
Break above 3450 for 3455✅, 3462✅, 3468✅ and 3480✅ in extension of the move
Break below 3440 for 3436, 3430 and 3422 in extension of the move
Please do support us by hitting the like button, leaving a comment, and giving us a follow. We’ve been doing this for a long time now providing traders with in-depth free analysis on Gold, so your likes and comments are very much appreciated.
As always, trade safe.
KOG

THE KOG REPORT - NFP UpdateEnd of day update from us here at KOG:
We published the NFP report earlier together with the red boxes and the targets above the key level which as you can see have worked very well today. We're not approaching the final destination but we're too high for anyone to attempt going long here! We're also too late in the session on a Friday to attempt any more trades so we'll leave it there and mark it completed.
Support now stands at the 3570-5 level with resistance 3600-10.
RED BOXES:
Break above 3555 for 3561✅, 3568✅, 3576✅ and 3588✅ in extension of the move
Break below 3540 for 3533, 3530, 3520, 3506 and 3490 in extension of the move
Wishing you all a great weekend ahead, and we'll see you on Sunday for the KOG Report and our view for the week.
Please do take some time to hit that boost button on the reports we share, without your support there is no point in us sharing this for free.
As always, trade safe.
KOG

XAUUSD Long: Upward Trend ContinuesHello, traders! The prior market structure for XAUUSD was dominated by a large consolidation wedge pattern. This period of balance was resolved with a decisive bullish breakout, which was subsequently confirmed by a retest of the 3440 demand zone. This successful test of former resistance as new support confirmed a structural shift in control to the buyers and initiated the current bullish phase.
Currently, the price has entered an acceleration phase. Following the breakout, a strong, impulsive rally has developed, which is now being guided by a steep ascending trend line. This indicates that the bullish initiative is in full control and the market is in a clear expansion phase, having left the prior consolidation area behind.
The primary scenario anticipates a continuation of this bullish momentum. Any minor corrective pullback towards the ascending trend line is expected to be met with renewed buying pressure, providing an opportunity to join the trend. A successful hold of this dynamic support would be the trigger for the next leg higher. The take-profit for this trend continuation is therefore set at 3600 points. Manage your risk!

GOLD 4H CHART ROUTE MAP UPDATEHey Everyone,
After wrapping up our 1H chart idea, here’s the update on the 4H chart we shared Sunday. Absolute perfection. We saw the EMA5 cross and lock above 3424, which opened 3499, target hit. Then another EMA5 cross and lock above 3499 opened 3561, also hit perfectly, right to the point.
We were able to map a range target without any historical data, relying on the law of averages and it played out beautifully.
From here, we now need an EMA5 cross and lock above 3561 to open 3615. Failure to lock will likely see lower Goldturns tested for support and bounce.
We will keep the above in mind when taking buys from dips. Our updated levels and weighted levels will allow us to track the movement down and then catch bounces up.
We will continue to buy dips using our support levels taking 20 to 40 pips. As stated before each of our level structures give 20 to 40 pip bounces, which is enough for a nice entry and exit. If you back test the levels we shared every week for the past 24 months, you can see how effectively they were used to trade with or against short/mid term swings and trends.
The swing range give bigger bounces then our weighted levels that's the difference between weighted levels and swing ranges.
BULLISH TARGET
3424 - DONE
EMA5 CROSS AND LOCK ABOVE 3424 WILL OPEN THE FOLLOWING BULLISH TARGETS
3499 - DONE
EMA5 CROSS AND LOCK ABOVE 3499 WILL OPEN THE FOLLOWING BULLISH TARGET
3561 - DONE
BEARISH TARGETS
3347
EMA5 CROSS AND LOCK BELOW 3347 WILL OPEN THE FOLLOWING BEARISH TARGET
3277
EMA5 CROSS AND LOCK BELOW 3277 WILL OPEN THE SWING RANGE
3234
3171
EMA5 CROSS AND LOCK BELOW 3171 WILL OPEN THE SECONDARY SWING RANGE
3089
2996
As always, we will keep you all updated with regular updates throughout the week and how we manage the active ideas and setups. Thank you all for your likes, comments and follows, we really appreciate it!
Mr Gold
GoldViewFX

GOLD Breakout Done , Long Setup Valid To Get 200 Pips !Here is My 15 Mins Gold Chart , and here is my opinion , we finally above 3500.00 With Daily Candle ! and we have a 4H Candle closure above it And Perfect Breakout and this give us a very good confirmation , so we have a good confirmation now to can buy after the price go back to retest the broken area 3500.00 , and we can targeting 100 to 300 pips . if we have a daily closure below this area this mean this idea will not be valid anymore .
Reasons To Enter :
1- Perfect Touch For The Area .
2- Clear Bullish Price Action .
3- Bigger T.F Giving Good Bullish P.A .
4- The Price Take The Last High .
5- Perfect 15 Mins Closure .

Next Target for Gold: $3600?👋Hello everyone, what do you think about the trend of OANDA:XAUUSD ?
Gold has just made a powerful breakout, breaking through the old resistance zone and forming new support. Currently, the price is hovering around $3530 with signs of a minor top forming. The area around the Fib 0.5–0.618 is considered the Expected Retracement Zone where buyers are waiting to accumulate.
The EMA34 and EMA89 continue to support the trend, acting as dynamic support levels. The new resistance zone at $3,580 – $3,600 will be the next target if price sustains its rebound.
With the Fed likely to cut rates and the USD weakening, gold is once again being viewed as a top safe-haven asset. Each pullback now seems more like a springboard for the next rally.
So, what do you think? Will gold sustain this bullish trend? Share your thoughts in the comments💬!

Gold - Here we have the textbook breakout!📖Gold ( TVC:GOLD ) currently breaks out:
🔎Analysis summary:
After we saw Gold rejecting the previous all time high multiple times over the past couple of months, we are now witnessing a bullish breakout. If this breakout is confirmed in the near future, Gold will head for another parabolic rally higher, repeating the 2011 blow off top.
📝Levels to watch:
$3.500
SwingTraderPhil
SwingTrading.Simplified. | Investing.Simplified. | #LONGTERMVISION

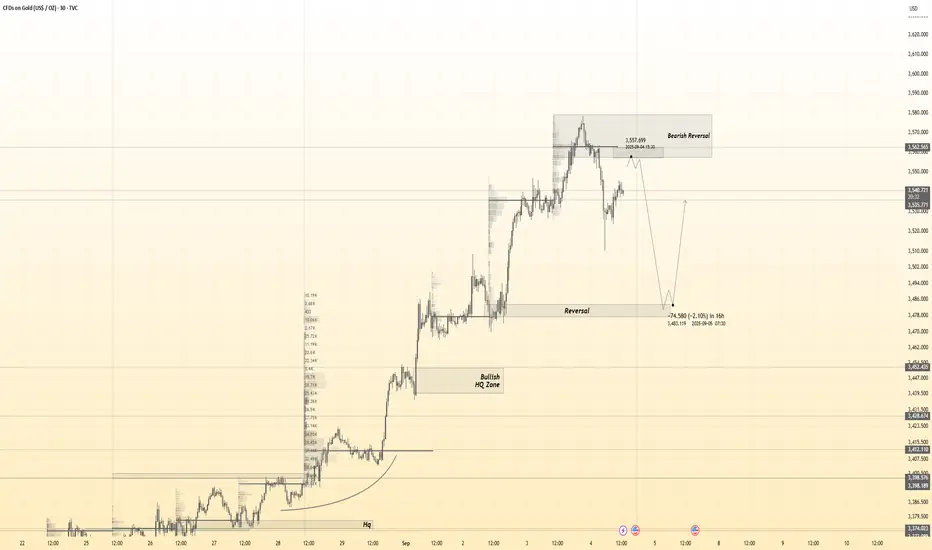
Gold Analysis – ATH Again, But Correction Ahead?1. Yesterday’s Move
Yesterday, after a small intraday correction to the 3470 zone, Gold quickly reversed and pushed higher, printing a new all-time high near 3550. The bullish trend remains intact, but the latest surge looks overextended.
2. Key Question
Has Gold finished its run for now, or will we see another immediate push higher without a deeper correction?
3. Why a Correction is Probable
• The recent move is stretched, with limited room for risk-reward on the long side at these highs.
• 3470 stands out as a confluence support, and markets often retest such levels before continuation.
• Chasing longs at ATHs leaves traders vulnerable to sharp pullbacks.
4. Trading Plan
The best setup is to wait for price to retrace into 3470 and look for buying opportunities in that zone, aiming to rejoin the broader uptrend.
Selling here is very risky – high probability of upside spikes could easily hit stop losses before any meaningful retracement.

Gold remains in a bullish A sustained move above 3500 Gold prices resumed their upward trend at the start of the week, supported by expectations of a more dovish U.S. Federal Reserve policy. However, trading activity remains subdued due to the U.S. and Canadian holidays, alongside weakness in Asian markets and ongoing uncertainty surrounding former President Trump's trade policies.
Despite the low volume, gold remains a preferred safe-haven asset amid broader market caution. If the price holds above the key support levels, a retest of the $3,500 resistance zone appears likely.
Technical Outlook:
Gold remains in a bullish consolidation phase. A sustained move above 3500 could trigger further upside, with the next resistance level seen near 3520. If bullish momentum continues, we may see gold push beyond this level in the near term.
You may find more details in the chart.
Trade wisely best of Luck.
Ps; Support with like and comments for better analysis Thanks for supporting.

Gold September Seasonality (Last 10 Years: 2015–2024)Gold is heading into September after a monster run in 2024/25. Unlike the “September slump” you hear about in crypto, gold’s last decade shows mostly mild, tactical moves in September—often driven by real yields, the dollar, and physical demand cycles. Once any early-month wobble plays out, dips have tended to be opportunities within the prevailing trend.
📊 Gold September Seasonality (Last 10 Years: 2015–2024)
Yearly September Returns
Year 📈 Return
2024 🟢 +4.99%
2023 🔴 −3.73%
2022 🔴 −2.32%
2021 🔴 −4.59%
2020 🔴 −3.70%
2019 🔴 −2.55%
2018 🔴 −1.93%
2017 🔴 −1.44%
2016 🟢 +1.02%
2015 🔴 −0.27%
📌 At-a-glance stats (2015–2024)
📉 Mean (10-yr): −1.45%
⚖️ Median: −2.13%
🔴 Red months: 8 out of 10
❌ Worst September: 2021 (−4.59%)
✅ Best September: 2024 (+4.99%)
📅 Recent Performance (last 3 years)
2024: 🟢 +4.99% → strongest September in the set
2023: 🔴 −3.73% → higher real yields weighed on bullion
2022: 🔴 −2.32% → strong USD + aggressive Fed hikes
➡️ Average of last 3 years: 🔴 −0.35%
➡️ Average of last 5 years (2020–2024): 🔴 −1.87%
________________________________________
🔎 Key Insights
• Gentle September bias: Over the last decade, September has skewed slightly negative for gold (mean −1.45%), but the drawdowns are modest compared to risk assets.
• Cycle matters more than calendar: 2020–2023 saw consistent reds as the dollar firmed and real yields rose; 2024 flipped green as rate-cut expectations and central-bank demand underpinned prices.
• Long-term seasonality ≠ last-decade reality: Multi-decade studies often show gold firming into late summer/early autumn (festival/jewelry demand, restocking), but the last 10 years were dominated by policy and yields—diluting that classic pattern.
________________________________________
🚀 Macro & Market Context
• 2019–2020: Trade tensions into COVID—gold corrected in Sep ’19 (−2.6%) and more so in Sep ’20 (−3.7%) after August’s spike to new highs.
• 2021: Fed taper talk + rising real yields → weakest September (−4.6%).
• 2022: King Dollar & rapid hikes → another red September (−2.3%).
• 2023: Real yields kept pressure on bullion (−3.7%).
• 2024: Sentiment flipped on policy expectations and persistent central-bank demand → solid +5.0% September.
________________________________________
🧭 Takeaway
Gold’s September over the last decade has leaned slightly bearish, but mostly in controlled, single-digit moves. The signal isn’t “sell September,” it’s “watch real yields, the USD, and physical flows.” When those line up, the calendar fade loses its bite—as 2024 showed.

GOLD - false breakout of 3500 and correction to 3400 Ahead lies strong resistance and a psychologically important price level: 3500. The closer the price gets to this zone, the more the market will manipulate before large players take profits, which may begin after a false breakout...
In addition, the 3435-3410 zone is also of interest to MM, since after the breakout of global consolidation resistance and the formation of a rally, there has been no correction yet.
Scenario: The breakout of resistance may be deep, and within the upward movement, the market may test 3510-3525 before the spark fades. A return below 3500 will confirm the false breakout, which will trigger profit-taking and a reversal in traders' actions. There may be a correction to the specified levels.

XAUUSD – Gold Trading Plan Before NFP | MMFLOW TRADINGGold (XAUUSD) has been consolidating in a sideway range (355x–354x) after several days of sharp gains. Yesterday, price reacted strongly at the 357x liquidity zone, triggering a short-term correction before stabilising back into balance.
Now, the market is narrowing its range while waiting for the Non-Farm Payrolls (NFP) release later today — the key driver that will likely set the next directional move.
📊 Macro Context
If NFP comes in better than expected, Gold could extend its correction lower, filling liquidity gaps towards 352x – 350x before offering fresh long opportunities.
If NFP data disappoints, Gold may break ATH (357x) and push higher toward the next liquidity & FIBO extension levels near 3594+.
🔑 Key Resistance Levels
3560 – 3576 - 3594
🔑 Key Support Levels
3540 - 3528 – 3514 - 3502 – 3488 – 3478
📌 Trade Setups (MMFLOW Trading Plan)
🔵 BUY Zone: 3488 – 3486
🔴 SL: 3480
✔️ TP: 3492 – 3496 – 3500 – 3510 – 3520 – 3530 – 3540 – ????
🔵 BUY Scalp: 3528 – 3526
🔴 SL: 3520
✔️ TP: 3532 – 3536 – 3540 – 3550 – 3560 – ????
🔴 SELL Scalp: 3574 – 3576
🔴 SL: 3580
✔️ TP: 3570 – 3565 – 3560 – 3550 – 3540 – 3530 – ????
🔴 SELL Zone: 3593 – 3595
🔴 SL: 3600
✔️ TP: 3588 – 3584 – 3580 – 3570 – 3560 – 3550 – ????
📊 MMFLOW Trading View:
Gold is sideway ahead of NFP, and today’s breakout from the 3540–3565 range will decide the next major move. Liquidity remains key — watch how price reacts at 3515–3528 on the downside or 3576–3595 on the upside.

Gold Shines Amid USD Pressure?Gold is maintaining its bullish momentum as the market finds little additional support for the USD from the latest data. Average hourly earnings rose 0.3%, exactly in line with forecasts, creating no surprises.
Nonfarm Payrolls came in at 75k, slightly higher than the previous 73k but still matching expectations, suggesting the U.S. labor market is not particularly strong. More importantly, the unemployment rate climbed from 4.2% to 4.3%, a negative signal for the USD as it increases the likelihood of a more dovish Fed, thereby supporting gold prices.
On the H1 chart, gold is trading around $3,550, with key support at $3,500 (aligned with the EMA34 and EMA89). The nearest resistance stands at $3,590, which is also the next upside target if the current trend holds. Overall, as long as gold remains above $3,500, the scenario of testing $3,590 in the coming sessions remains the primary outlook.

GOLD ROUTE MAP UPDATEHey Everyone,
We kicked off the week strong with our bullish targets at 3458 and then 3477 getting hit. Price is now facing rejection at this zone.
If EMA5 breaks above this level and locks, we could see an extension toward 3497.
If not, we may revisit lower Goldturns to test support before the weighted level bounces.
We will keep the above in mind when taking buys from dips. Our updated levels and weighted levels will allow us to track the movement down and then catch bounces up.
We will continue to buy dips using our support levels taking 20 to 40 pips. As stated before each of our level structures give 20 to 40 pip bounces, which is enough for a nice entry and exit. If you back test the levels we shared every week for the past 24 months, you can see how effectively they were used to trade with or against short/mid term swings and trends.
The swing range give bigger bounces then our weighted levels that's the difference between weighted levels and swing ranges.
BULLISH TARGET
3458 - DONE
EMA5 CROSS AND LOCK ABOVE 3458 WILL OPEN THE FOLLOWING BULLISH TARGETS
3477 - DONE
EMA5 CROSS AND LOCK ABOVE 3477 WILL OPEN THE FOLLOWING BULLISH TARGET
3497
EMA5 CROSS AND LOCK ABOVE 3497 WILL OPEN THE FOLLOWING BULLISH TARGET
3513
BEARISH TARGETS
3439
EMA5 CROSS AND LOCK BELOW 3439 WILL OPEN THE FOLLOWING BEARISH TARGET
3417
EMA5 CROSS AND LOCK BELOW 3417 WILL OPEN THE FOLLOWING BEARISH TARGET
3395
EMA5 CROSS AND LOCK BELOW 3395 WILL OPEN THE SWING RANGE
3369
3352
EMA5 CROSS AND LOCK BELOW 3395 WILL OPEN THE SECONDARY SWING RANGE
3336
3315
As always, we will keep you all updated with regular updates throughout the week and how we manage the active ideas and setups. Thank you all for your likes, comments and follows, we really appreciate it!
Mr Gold
GoldViewFX

Gold All Time High and want to Hitting Resistance PointsGold prices are trading near all-time highs as investors continue to rush into safe-haven assets. While the uptrend remains strong, the risk of profit-taking is increasing, which could trigger short-term pullbacks. Nonetheless, the metal is likely to remain close to record levels, supported by underlying demand.
The rally reflects market expectations of a more dovish U.S. Federal Reserve, a weaker U.S. dollar, and robust central bank purchases year-to-date. These factors provide a solid fundamental backdrop for gold despite elevated prices.
Technical Outlook
Immediate key level: 3558 –
If price breaks above 3558, the next resistance is seen near 3620.
Support levels to watch remain at recent breakout areas, which may act as buffers if profit-taking emerges.
You may find more details in the chart,
Trade wisely best of Luck,
Ps; Support with like and comments for better analysis.
