Weekly WatchlistMy analysis on gold is buy, and I think it’s a good opportunity to go long now. A long position can be opened on Monday.
Of course, the stop should be set properly because the market has been quite volatile in the past few days. If your target is more medium- to long-term, and you’re entering now aiming for a break above the historical high, make sure the stop is set reasonably.
Trade ideas

XAUUSD H4 high probability is to break the previous high(XAUUSD H4)Let's Break Down this Chart👇
XAUUSD is following a Bullish trend line since October 28th ,And Yesterday market close Above a H4 Bearish OB that has become a Breaker.
And below, we see a strong H4 order block that was able to break the internal structure.
The volume profile shows us that it was at this level that the large orders were opened.
SENARIO 1 : XAUUSD retests the Breaker which could become a support and breaks the previous High.
SENARIO 2 : XAUUSD retests the H4 Order Block, which could act as support, and breaks the previous high.

GOLD NICE SELL SET UPGold RESTEST nicely to a FVG AREA and give BEARISH FORMATION
I have take SELL from here and will HOLD to a target

XAUUSD – Ascending channel in play, eyes on the 4,240 regionXAUUSD – Ascending channel in play, eyes on the 4,240 region
Brian – Buying the dip within structure, watching for a fade at higher resistance
Market overview & structure
On the H4 chart, gold is trading neatly inside a well-defined ascending channel, printing higher highs and higher lows. The current leg is pushing up towards the 4,237–4,240 area, which lines up with:
The upper boundary of the channel
A key resistance zone
The 1.618 Fibonacci extension and resting liquidity above recent highs
So for now, the broader bias remains bullish, but as price creeps closer to 4,240, the risk of profit-taking and short-term selling naturally increases.
Wave & technical context
This move is an extension of the previous bullish structure after price broke out of the old descending channel and started to build a new bullish one.
Liquidity levels around 4,193 and above suggest the market has been building positions and still has room to drive price into the higher resistance band.
The buy zone around 4,154–4,157, near the lower edge of the channel, is where buyers are likely to step back in to defend the trend.
As long as price holds above 4,150–4,154, the continuation scenario towards 4,240 remains the higher-probability path.
Key zones & trading plan
Primary scenario – Buy with the trend
Buy zone: 4,154–4,157 (channel support + marked buy zone).
Idea: Wait for a pullback towards the lower boundary of the channel, or a brief liquidity sweep into this region, then look for a clear rejection candle on H1/H4 before going long.
Targets:
Short term: 4,190–4,200 (mid-channel / interim liquidity).
Extended: 4,237–4,240 (major resistance + 1.618 Fib extension).
This is a trend-following “buy the dip” setup, more suited to swing and short-term position traders rather than scalpers.
Secondary scenario – Short-term fade from 4,237–4,240
Sell zone: 4,237–4,240 – confluence of strong resistance and the 1.618 Fibonacci extension.
Idea: If price tags this zone and shows clear rejection (long upper wicks, bearish reversal pattern on H1/M15), it may offer a counter-trend short back towards the middle of the channel or the 4,190–4,200 support area.
As this is a counter-trend play:
Keep position size smaller than the main long idea.
Use a tight stop above 4,240 and avoid widening it out of emotion.
Macro and liquidity backdrop
Liquidity is likely to thin out towards the end of the session with the US Thanksgiving period in play, which can lead to the odd sharp spike or stop-hunt, especially around obvious liquidity pools.
On the political front, headlines such as Mr Trump’s comments about “permanently suspending immigration from third-world countries” add to broader policy uncertainty, but the impact on gold is indirect via risk sentiment rather than a direct driver.
It’s also worth noting that silver has been rallying strongly, supported by solar-related demand and supply concerns – a bit of a “silent workhorse” at the moment. That doesn’t remove gold’s role, but it does show that precious metals as a whole are attracting capital.
Strategy & risk management
For now, my focus is on buying dips around 4,154–4,157 in line with the ascending channel, and only looking for tactical shorts if price clearly rejects the 4,237–4,240 band.
I prefer not to open fresh trades when US liquidity is extremely thin or straight into major holiday sessions, as spreads can widen and price can behave erratically.
If we see a decisive close below the buy zone and a clean break of the channel structure, this bullish plan is invalidated – at that point it’s better to step aside and reassess rather than forcing trades.
What do you reckon – does this structure still favour the bulls, or are you leaning towards a deeper correction from the 4,240 region? Feel free to share your view in the comments.

XAUUSD (GOLD) – Current Market Analysis
📑XAUUSD (GOLD) – Current Market Analysis
Date: 28 November 2025
Time: 09:20 AM (GMT+6)
---
🖥️ Trend Direction:
Higher Timeframe is still clearly in a bullish structure. Price continues to form Higher Highs, and several protected Strong Lows remain intact below. The 4000–3950 region is a major Higher Timeframe demand zone.
However, in the short-term, the market is positioned where a deeper correction is highly possible. Price has swept the 4185–4200 weak-high liquidity zone. Usually after such a sweep, the market collects liquidity and begins a short-term retracement.
So, the overall HTF bias is bullish, but the intraday bias is currently corrective.
---
🖥️ Technical Analysis:
On the 15M and 1H charts, a strong impulsive bullish rally pushed price directly into 4185–4195.
Below this impulsive move, clean demand zones exist at 4150 and 4120.
Price is currently overextended, where a pullback is normally expected.
The rejection candle at the top indicates buyers are losing momentum (buyer exhaustion).
---
🖥️ Smart Money Concept (SMC):
There is a clear weak-high liquidity pool at 4185–4200.
Price has already swept this liquidity, which is typically a strong signal for reversal or correction.
Draw-to-liquidity zones below:
4150 – fresh Order Block + imbalance
4120 – deeper discount area + equal lows liquidity
According to SMC principles, price is most likely to collect this downside liquidity and retest the demand zones next.
---
🖥️ Fibonacci:
Applying Fibonacci on the impulsive leg from 4120 → 4190:
0.382 retracement = 4150
0.618 retracement = 4125
Both Fibonacci levels align perfectly with the existing demand zones.
This confirms the correction setup from both Fibonacci and SMC perspectives.
---
🖥️ RSI & Volume:
RSI has touched above the 70 overbought zone and then rejected, signaling exhaustion.
During the liquidity sweep, volume spiked, followed by a volume drop — this pattern strongly indicates a correction phase.
---
🖥️ Fundamental Analysis:
Because today is US Thanksgiving, overall liquidity is low and sudden spikes or wicks are more likely.
During low-liquidity days, liquidity sweeps and sharp retracements are common —
which aligns perfectly with today’s technical structure.
---
🖥️ Trading Plan:
⭐ High Probability Sell Setup (Short-Term Correction)
Price has swept the weak-high. Downside correction is now highly probable.
Sell only after CHoCH downside confirmation on the 5M or 15M chart.
Sell Entry Zone: 4185–4200
Take Profit 1: 4150
Take Profit 2: 4125
Stop Loss: 4205 (structure-based)
---
⭐ High Probability Buy Setup (Continuation)
Buy only after a demand-zone retest combined with a bullish CHoCH.
Buy Zone 1: 4150
Buy Zone 2: 4120
Take Profit 1: 4180
Take Profit 2: 4200
Stop Loss: 4110 (structure-based)
Both setups follow the market structure and provide high-probability trading opportunities.
---
Analysis Short Summary:
Gold swept the 4185–4200 weak-high liquidity zone.
The structure is overextended and RSI is overbought, meaning a short-term correction is almost confirmed.
First major support and buy zone is 4150.
Below that, the strong discount zone is at 4120.
The market is likely to follow a clean path:
liquidity collection → correction → demand retest → bullish continuation.

Taking profit on gold Hello guys! I’ll be taking profit now. Possible chance of a retracement and falling down. Be careful!

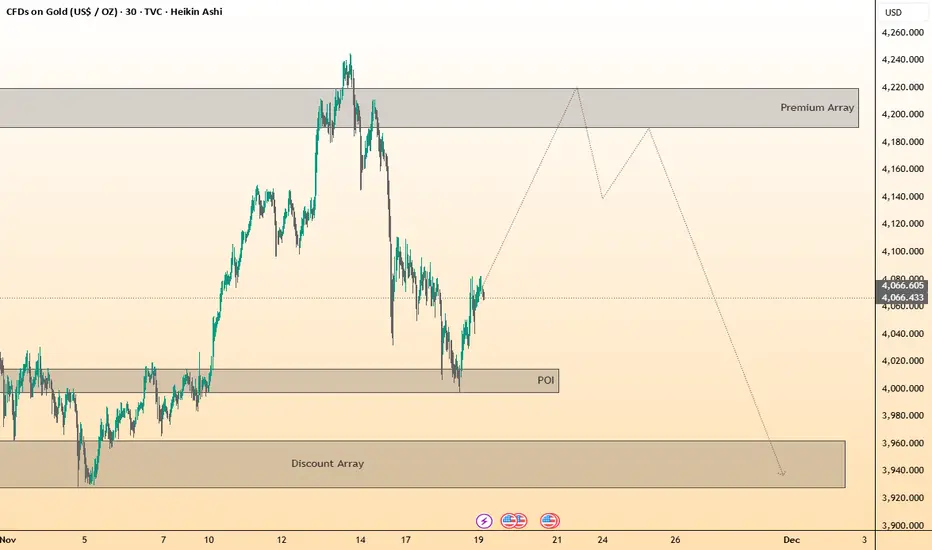
ICT-based structures and expected price projections.Key Elements Visible:
🔹 Current Market Price:
Price is trading around 4066.
🔹 Previous Swing High Zone:
A Premium Array is drawn as a large grey zone around the 4180–4220 area, indicating a potential distribution or sell zone where price may react after grabbing liquidity.
🔹 Previous Swing Low / POI:
A Point of Interest (POI) is marked below, around the 4000–4020 region. This is shown as a discount area where buyers may step in.
🔹 Discount Array:
At the bottom of the chart, a large Discount Array box is shaded, around the 3920–3980 zone, suggesting a deeper liquidity pool or bearish objective if the lower POIs are taken.
🔹 Projected Price Path:
A speculative line (market structure projection) is drawn showing:
A move upwards toward the Premium Array zone
Followed by a sharp reversal downward, targeting the Discount Array
🔹 Market Structure Context:
The current price appears in a retracement phase, attempting to recover from a previous sharp decline.
ElDoradoFx – GOLD ANALYSIS (28/11/2025, ASIA SESSION)1. Market Overview
Gold continues to trade inside a narrowing compression zone, with price hovering around 4156–4158 after reclaiming structure and maintaining support above the prior liquidity sweep 4136–4142. The current positioning suggests indecision beneath macro resistance, with momentum leaning bullish as long as structure remains intact.
Next directional leg will be defined by whether price breaks 4172 or falls back below 4147.
⸻
2. Technical Breakdown
🔸 Daily (D1)
• Price holds a strong base above 4136, rejecting deeper breakdowns.
• Market remains compressed under trendline resistance drawn from swing high.
• Bulls remain controlled while above 4114, with upside continuation on a break above 4172.
• RSI mid-level — expansion potential exists.
🔸 H1
• Trend structure bullish above 4147 with BOS sequence intact.
• Price currently retesting the median zone under 4166–4172 Supply Block.
• A successful breakout here exposes continuation toward 4186–4200.
• Breakdown below 4147 shifts momentum into correction phase.
🔸 15M–5M
• Lower-timeframe push formed a BOS long leg into resistance.
• MACD shows buy momentum but weakening — suggesting pullback before continuation.
• Current intraday range: 4150–4172.
• A liquidity sweep into FVG + Golden Area offers best long entries.
⸻
3. Fibonacci Analysis
Swing Range: 4136 → 4172
Level Price
38.2% 4157
50.0% 4154
61.8% 4150
🟩 Golden Re-Entry Zone → 4157 – 4150
Ideal area for bullish continuation if respected.
⸻
4. High-Probability Trade Scenarios
📈 BUY SETUPS (Primary Bias)
Condition Entry TP Targets SL
Pullback to Golden Zone 4157–4150 4166 → 4172 → 4186 → 4200 4147
Break & Retest Break + Hold above 4172 4186 → 4200 → 4215 4154
⚡ Confirmation Required: BOS + momentum continuation on LTF.
⸻
📉 SELL SETUPS (Countertrend)
Condition Entry TP Targets SL
Reaction from Supply Block 4166–4172 4157 → 4154 → 4150 → 4142 4179
Breakdown Continuation Break + Retest below 4147 4142 → 4136 → 4128 4157
🔻 Valid only if momentum shifts down — no early shorts.
⸻
5. Fundamental Watch
• Asia accumulation suggests London & NY will define expansion leg.
• DXY flat which increases breakout probability later in the session.
• Expect volatility around structural borders — reaction zones more important than prediction.
⸻
6. Key Technical Levels
Resistance Support
4166 / 4172 / 4186 / 4200 4157 / 4154 / 4150 / 4142
Break Buy Trigger: > 4172
Break Sell Trigger: < 4147
⸻
7. Analyst Summary
Gold remains bullish while trading above 4150–4147, with continuation potential to 4172 → 4186 → 4200.
If sellers reject the high block again, price may retrace into 4154–4150 before reloading.
Structural failure below 4147 invalidates the long sentiment and opens downside targets.
⸻
8. Final Bias Summary
Bullish Outlook holds above 4150–4147
Break → 4172 = Expansion.
Break ↓ 4147 = Correction.
⸻
🥇 ElDoradoFx PREMIUM 3.0 – PERFORMANCE 27/11/2025 🥇
⚡ Low-volatility session — still closed green.
📈 BUY +100 PIPS
📈 BUY +40 PIPS
❌ BUY LIMIT -40 PIPS (SL)
⚖️ SELL - BE
📉 SELL +20 PIPS
━━━━━━━━━━━━━━━
▶️ LIVE TRADING SESSION
📉 SELL +70 PIPS
📉 SELL +45 PIPS
📈 BUY +70 PIPS
❌ SELL -40 PIPS (SL)
━━━━━━━━━━━━━━━
💎 SWING TRADES – STILL FLOATING
🔵 BUY → +2,850 PIPS
🟣 BUY → +1,600 PIPS
━━━━━━━━━━━━━━━
📊 PERFORMANCE SUMMARY
💰 Total Pips Gained: +265 PIPS
📈 Win Rate: 75% (6 Wins / 8 Signals)
⚠️ Low volume due to U.S. Bank Holiday, still profitable.
━━━━━━━━━━━━━━━
Even slow markets pay those who stay patient & trade with skill.
Congratulations if you profited! 🔥
— ElDoradoFx PREMIUM 3.0 Team 🚀

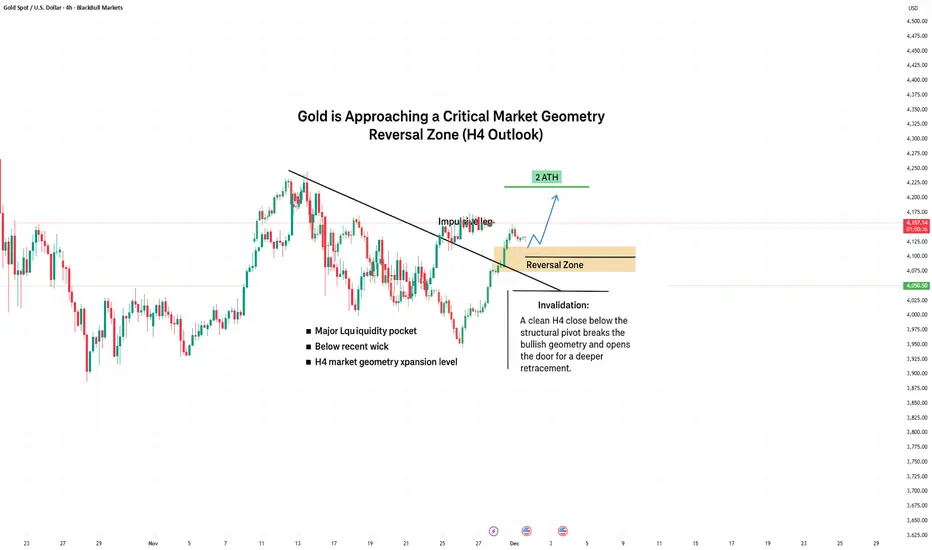
Gold: Geometric Reversal Zone Tested — Market Preparing for the Gold has just reacted strongly from a Major Market Geometry Reversal Zone on the H4 timeframe.
This area combines three powerful technical elements:
• A liquidity pocket below the last corrective wick
• A clean retest of the structural trend axis
• A geometric confluence cluster based on expansion angles
The reaction from this zone signals that buyers are defending the structure with precision.
If price continues to hold above the geometric pivot, the bullish continuation scenario becomes dominant, targeting
2418 → 2440 → 2475, with the possibility of extending toward a new ATH.
What strengthens the bullish case:
• Imbalance creation on the upside
• Liquidity stacked above the previous impulse high
• Shift in momentum after a controlled correction
• Clean, readable structure — something editors love
Invalidation:
A clean H4 close below the geometric pivot breaks the bullish scenario and opens the way for deeper retracement.
This setup is currently one of the cleanest structural opportunities on Metals, and I will update the chart as soon as expansion begins.
Heading into key resistance?Gold (XAU/USD) is rising towards the pivot and could reverse to the 1st support, which acts as an overlap support.
Pivot: 4,221.15
1st Support: 4,027.94
1st Resistance: 4,364.63
Disclaimer:
The opinions given above constitute general market commentary and do not constitute the opinion or advice of IC Markets or any form of personal or investment advice.
Any opinions, news, research, analyses, prices, other information, or links to third-party sites contained on this website are provided on an "as-is" basis, are intended to be informative only, and are not advice, a recommendation, research, a record of our trading prices, an offer of, or solicitation for, a transaction in any financial instrument and thus should not be treated as such. The information provided does not involve any specific investment objectives, financial situation, or needs of any specific person who may receive it. Please be aware that past performance is not a reliable indicator of future performance and/or results. Past performance or forward-looking scenarios based upon the reasonable beliefs of the third-party provider are not a guarantee of future performance. Actual results may differ materially from those anticipated in forward-looking or past performance statements. IC Markets makes no representation or warranty and assumes no liability as to the accuracy or completeness of the information provided, nor any loss arising from any investment based on a recommendation, forecast, or any information supplied by any third party.

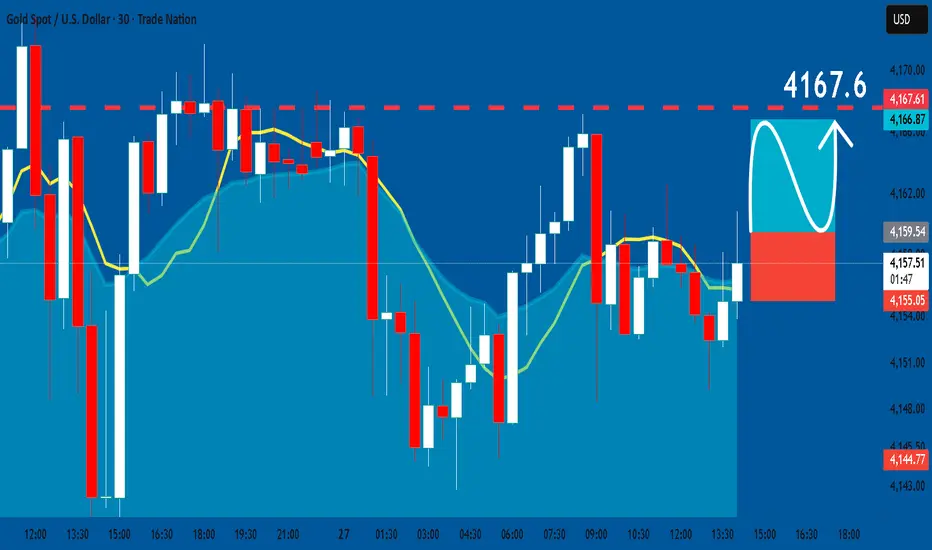
GOLD: Long Trade with Entry/SL/TP
GOLD
- Classic bullish formation
- Our team expects growth
SUGGESTED TRADE:
Swing Trade
Buy GOLD
Entry Level - 4159.5
Sl - 4155.0
Tp - 4167.6
Our Risk - 1%
Start protection of your profits from lower levels
Disclosure: I am part of Trade Nation's Influencer program and receive a monthly fee for using their TradingView charts in my analysis.
❤️ Please, support our work with like & comment! ❤️
Gold Trade Set Up Dec 4 2025Price swept PDL and SSL to the left also tapping into 1h and 15m demand zones so i will be targeting higher BSL and PDH for a continuation higher

GOLD Sellers In Panic! BUY!
My dear followers,
I analysed this chart on GOLD and concluded the following:
The market is trading on 4192.4 pivot level.
Bias - Bullish
Technical Indicators: Both Super Trend & Pivot HL indicate a highly probable Bullish continuation.
Target - 4205.9
Safe Stop Loss - 4184.7
About Used Indicators:
A super-trend indicator is plotted on either above or below the closing price to signal a buy or sell. The indicator changes color, based on whether or not you should be buying. If the super-trend indicator moves below the closing price, the indicator turns green, and it signals an entry point or points to buy.
Disclosure: I am part of Trade Nation's Influencer program and receive a monthly fee for using their TradingView charts in my analysis.
———————————
WISH YOU ALL LUCK

Gold Under Pressure, Watch the 4207 LevelIn recent days, gold has continued to fluctuate within the 4250–4160 range. Lifted briefly by the positive ADP report yesterday, the price broke above the 4228 resistance and spiked to 4240, only to retreat shortly after. During the subsequent swings, the 4216–4228 zone once again acted as a firm resistance, and as of today, the price has still failed to break above it.
On one hand, U.S. Treasury selling has pushed yields higher, Liquidity in the gold market has decreased. On the other hand, easing tensions between Russia and Ukraine have reduced safe-haven demand. The combination of these factors has kept the bullish momentum suppressed. Meanwhile, the stability of downside support comes from rising expectations of Federal Reserve rate cuts. These conflicting forces have led to the current range-bound price action.
From a technical perspective, the key level to watch remains the 4230 resistance. Should the price continue to face pressure here—without support from upcoming news or data—it may pull back to test the 4152–4133 zone. Trend support on the daily chart has now risen to around 4096.
For short-term trading, keep an eye on the 4203–4207 resistance area, which serves as the immediate barrier before another attempt toward 4216–4228. As long as the price can hold above 4206, upward pressure is likely to ease, opening the door for a move toward 4250–4270.
Strategically, the focus remains on buying dips, especially if the price pulls back below 4160, which offers a relatively favorable entry within a ranging market. If the price fails to break above 4216, short-term selling opportunities may appear, but traders should manage timing and risk carefully.

XAU/USD – Recovery structure testing 4,239 – 4,2611. Market Context
On the M30 timeframe, the previous downtrend has started to weaken. The price has formed a series of Equal Lows patterns, indicating that the short-term bottom is protected, followed by a Change of Character (ChoCH) and a slight Break of Structure (BOS). This reflects that the selling pressure has decreased in intensity and the market is transitioning into an accumulation phase, preparing for a recovery.
The downtrend line is still valid, but the price is approaching the breakout area. Closing candles above this line will confirm a phase transition.
2. Key Price Areas
Upper Supply Zone
4,239 – 4,240: the nearest strong reaction area, acting as the main resistance.
4,261: coincides with the 1.272 Fibonacci of the correction wave, a notable liquidity area.
4,282 – 4,283: expansion target, corresponding to Fibonacci 1.618.
These areas will be points where the market may show counter-reactions during the uptrend.
Lower Demand Zone
4,168 – 4,154: the Demand Zone formed from the previous strong reversal. This is the area where the market effectively absorbed selling pressure and may continue to act as support during corrections.
3. Fibo and Price Action
The current uptrend is following a standard pullback structure: from the 4,168 bottom, the price recovers to Fibonacci levels like 0.236 – 0.382, then forms a small correction before approaching the downtrend line again.
If the price surpasses the trendline, the next targets will be:
4,213 (Fibo 0.618),
then the main supply zone 4,239 – 4,240.
Closing candles above this area will pave the way for the next targets at 4,261 and 4,282.
4. Trading Plan
Buy Scenario – prioritize during correction
Early buy position: 4,188 – 4,195
(retest small structure and trendline)
Optimal buy zone: 4,168 – 4,154
(Demand Zone + deep Fibo correction)
Stop loss: below 4,150
Targets:
4,213
4,239 – 4,240
4,261
expanding to 4,282
Short-term Sell Scalp Scenario
Reaction zone: 4,227 – 4,230
(near resistance + 0.786 Fibo)
Stop loss: 4,236
Target: 4,205 – 4,195
Note: This is only a short-term strategy, not the main trend.
5. Summary
• The market structure is transitioning from a downtrend to an accumulation – recovery phase.
• If the price surpasses and holds above the trendline, the nearest target will be 4,239 – 4,240.
• The supply zones 4,239 – 4,261 – 4,282 will play a decisive role in the next uptrend.
• The most effective trading strategy remains to wait for a buy during corrections to the strong support zone 4,168 – 4,154.

XAUUSD Bullish Reversal Setup from Extreme POI – SSS Liquidity SChart Analysis
1. Market Context
The chart shows XAUUSD after a decline, now tapping into an EXTREME POI (Point of Interest).
Price reached a previous demand zone where strong reactions occurred before.
2. Liquidity Structure
Multiple areas are labeled “SSS” (Sell-Side Liquidity / Sell-Side Sweep).
Price appears to have:
Swept liquidity beneath local lows (SSS).
Tapped the extreme POI.
Shown an immediate rejection wick, indicating buyers stepping in.
This suggests the market may be exhausting sellers and preparing for a bullish leg.
3. Execution Zone
The grey region represents the entry zone (likely a demand imbalance / mitigation area).
The large blue box above marks the risk-to-reward projection for a long position.
4. Targets
You’ve placed two clear targets:
Target 1
A mid-range liquidity level at approximately 4217.279.
Represents a logical first take-profit based on prior structural inefficiencies.
Target 2
The upper area (labeled “TARGET”), aligning with:
Prior swing highs
A supply zone
A premium pricing zone (after retracement)
This would be the full TP for the bullish move.
5. Bias Summary
Bias: Bullish
Reason: Liquidity sweep + POI tap + structure showing potential for upside displacement.
The setup aligns with Smart Money Concepts:
Sweep → Mitigation → Displacement → Targeting Imbalances & Liquidity Pools

XAUUSD M15 SELL SETUPSell Setup Sell Entry Zone: 4210 – 4215 (This is where buyers weaken and liquidity sits above) Stop-Loss (SL) Above the supply zone SL: 4216– 4220 Targets (TP) TP1: 4180 TP2: 4160 Final Target: 4158 (your given target)

OUTLOOK XAUUSD 15m Analysis(4th December 2025)Hey guys, this is just a trade idea not a financial advise
BUY/SELL SCENARIOS:
BUYS:
1) Body Candle Close above the 4216.90 level.
2) Retest the 15m Bullish CHOCH at the 4216.90 level.
3) Create a 3/5m Bullish Engulfing Candle to capitalise on BUYS towards the 4241.60 level.
SELLS:
1) Body candle close below the 4202.31 level.
2) Retest the 15m Bearish CHOCH at the 4202.31 lev/el.
3) Create a 3/5m Bearish Engulfing Candle to capitalize on SELLS towards the 4183.00 level.
Trade smart, trade according to trading plan!

[WEEKLY] ANFIBO | Gold XAUUSD - Purple or Gray? [11.24 - 11.28]Hi guys, Anfibo’s here!
XAUUSD Weekly Trading Plan
Overall Picture:
OANDA:XAUUSD is entering a critical phase as price continues to consolidate within a tightening structure, signaling that a major directional move is likely to occur next week. After a period of strong volatility, the market is now compressing energy between the upper and lower boundaries of the current range. This setup is textbook for a break–retest–continuation model, and that’s exactly why my strategy for the upcoming week revolves around two clear scenarios: the “purple arrow” plan and the “grey arrow” plan.
The market will reveal its next major direction once either the upper boundary is broken or the lower boundary gives way. Until that happens, there is no reason to pre-commit to a biased direction — we trade what price confirms, not what we predict.
Trading Plan for Next Week:
We will react based on breakout confirmation:
>>> Scenario #1: Break ABOVE the range – Follow the “Purple Arrow” plan (BUY)
If gold pushes through the upper boundary with strength and confirms a retest, we will switch to a bullish continuation plan.
Key Resistance Levels to Watch: 4147, 4243, 4340, 4356, 4377.
A clean break above structure opens the path back into macro bullish territory, where gold may attempt to revisit or even surpass recent highs.
>>> Scenario 2: Break BELOW the range – Follow the “Grey Arrow” plan (SELL)
Once price breaks and retests the lower boundary, we will look for sell setups targeting the ladder of support levels outlined below.
Key Support Levels to Watch: 4000, 3917, 3890, 3862, 3820, 3793, 3760
A bearish breakout from the range could trigger a multi-wave continuation pattern, giving us multiple opportunities to scale in according to structure.
Risk Management:
Trade only after confirmed breakouts — avoid guessing tops and bottoms.
Keep tight SLs on retests to avoid liquidity hunts common during range boundaries.
Maintain Risk:Reward ≥ 1:2 across all setups.
Prioritize clean structure; avoid trading inside the choppy middle zone of the range.
Reassess bias immediately if the breakout fails or re-enters the range.
Conclusion:
Next week’s market will be all about patience and reaction, not prediction. With gold coiling tightly, a breakout is imminent, and both the “purple arrow” (bullish) and “grey arrow” (bearish) plans give us a clear and disciplined roadmap. Whether price breaks upward or downward, we already know exactly where our key levels are and how we will execute. Stick to structure, wait for confirmation, and let the market choose the direction for us.
HAVE A POWERFUL NEW WEEK, GUYS!

Gold Analysis & Trading Strategy | December 3–4✅ 4H Chart (H4) Trend Analysis
1️⃣ Clear high-level consolidation on H4
During today’s U.S. session, gold surged to 4241.55, then pulled back quickly.
It failed to break the previous high 4264, indicating weakening bullish momentum.
The decline touched 4195, then rebounded strongly, showing solid institutional buying below, a typical high-level sideways + two-way washout phase.
2️⃣ Bollinger Bands Structure:
Middle band (≈4204–4206) is now the key support & bull-bear divider.
Upper band near 4256 was approached but not broken → strong resistance remains.
Lower band at 4181 has held multiple times → short-term bottom strengthening.
➡️ As long as H4 holds above the middle band 4204, gold maintains a bullish bias.
✅ 1H Chart (H1) Trend Analysis
1️⃣ Sharp rise → sharp drop → secondary rebound pattern
Gold was rejected at 4241, dropped straight to 4195 → bearish pressure released.
Then it quickly rebounded to 4210 → short-term bulls are fighting back.
This is a classic “stop-hunt spike → bottoming rebound” structure, not a bearish reversal.
2️⃣ Bollinger Bands (H1)
▪ Lower band (≈4194) successfully supported the price → valid support
▪ Middle band (≈4212) is the first resistance for short-term bulls
▪ Upper band (≈4230–4235) remains strong resistance
🔴 Resistance Levels:
▪ 4215–4220 (H1 MA20 + H4 moving-average cluster)
▪ 4230–4234 (H1 Bollinger upper band)
▪ 4250–4256 (H4 upper band + major resistance area)
🟢 Support Levels:
▪ 4195–4188 (strong U.S. session demand zone)
▪ 4185–4175 (key support; break = bearish)
▪ 4163 (confirmed swing low)
✅ Trading Strategy Reference
🔰 Main Strategy: Buy on Dips (short-term bullish bias)
🟠 First Buy Zone: 4195–4188
🎯 Targets: 4215 / 4230
⛔ Stop-loss: below 4178
🟠 Second Buy Zone: 4185–4175
🎯 Targets: 4230 / 4250
⛔ Stop-loss: below 4168
🔰 Secondary Strategy: Short on Rejections (short-term only)
🟠 First Sell Zone: 4215–4220
Enter light shorts if ANY of the following appear:
▪ Long upper wick
▪ Bearish 1H candle
▪ Weak breakout with low volume
🎯 Targets: 4195 / 4185
⛔ Stop-loss: above 4228
🟠 Second Sell Zone: 4230–4250 (major resistance zone)
🎯 Targets: 4195 / 4185
⛔ Stop-loss: above 4265
📌 Trend Summary
1️⃣ Today’s high 4241.55 = major resistance confirmed
2️⃣ Strong rebound after dropping to 4195–4188 → buyers active
3️⃣ Short-term structure = range-bound but bullish-tilted
4️⃣ 4215–4220 is the key breakout zone
5️⃣ Break above 4220 → targets 4234 / 4250
6️⃣ Break below 4175 → retest 4163
7️⃣ Medium-term bullish structure remains solid; current move is strong consolidation correction
🔥Trading Reminder: Trading strategies are time-sensitive, and market conditions can change rapidly. Please adjust your trading plan based on real-time market conditions.

XAUUSD Intraday Plan|Bulls vs. 4232 — Break or Reject?Gold dropped into the Reaction Zone as outlined in yesterday’s analysis and bounced back, currently trading around 4206. Price is sitting between the two moving averages and still below the 4232 resistance, waiting for a fresh catalyst.
For buyers to take price higher, we need a clean break above 4232, which would open the path toward 4274, and if momentum is strong, a possible move toward 4322.
If we see another failed attempt at 4232, price is likely to revisit the Reaction Zone.
If this zone gives way, watch the Support Zone and the HTF Support Zone, where buyers are likely to step back in.
📌Key levels to watch:
Resistance:
4232
4274
4322
Support:
4185
4141
4102
4049
4014
3966
🔎Fundamental focus:
Today brings several high-mid-tier U.S. data releases - all of which may add short bursts of volatility. With major events still ahead later in the week, markets may stay reactive and sensitive to headlines.

Gold Strategy Focus: Rising Rate Cut Expectations Fuel Gold's TuGold Strategy Focus: Rising Rate Cut Expectations Fuel Gold's Tug-of-War and the Poised for a New Offensive!
Tonight, the market will face the test of the ADP non-farm payroll data, but before the data release, market sentiment seems to be dominated by another force—expectations of a Fed rate cut are heating up at an unprecedented rate! 😯 Currently, the market's probability of a 25 basis point rate cut at the December meeting has surged to 89%, more than double what it was a week ago. This frenzy not only reflects economic concerns under weak data but also foreshadows a potential turning point in global liquidity.
🔥 Fundamentals: Multiple Engines Ignite, Strengthening Gold's "Long-Term Bull Market" Logic
Rate Cut Expectations Take Center Stage
The market is almost certain that the Fed will begin cutting rates this month. If this comes true, it will completely reverse the interest rate narrative. The dollar weakened in response, and US Treasury yields fell, creating a perfect financial environment for gold.
Policy Variables Add Dramaticity
Trump's latest hints, coupled with rumors of Hassett's (a dovish representative) possible appointment, further suppress the dollar's prospects. Once policy direction becomes clearer, gold's role as a currency substitute will become significantly more prominent.
Structural buying remains strong. With the global central bank gold-buying spree continuing, geopolitical volatility unresolved, and the long-term target of $5,000/ounce by 2026 gaining traction, gold is no longer just a safe-haven asset, but also a "ballast" in asset allocation.
Author's Note: The market's shift from "higher for longer" to "interest rate cut frenzy" has been swift and unexpected. Gold has become a core battleground in this process, a key battleground for expectations! ✨
📊 Technical Analysis: Pullbacks as Buying Opportunities? Key Levels Defined; Positive Daily Signals. Yesterday's candlestick formed a classic "hammer" pattern, indicating strong buying pressure on dips! Prices are holding firm within the upward channel, the moving average system is nearing completion of its repair, and the overall structure is bullish. Key resistance is seen in the 4245/4250 area; a break above this level could open up new upside potential. The MACD and KDJ indicators have completed their repair, and the area around 4180 has become a crucial support level in the near term. Hourly chart analysis: Tracking the oscillation rhythm. The short-term pattern has formed a rounded top and pulled back. Pay attention to the support strength of the 120-day moving average (4193). If the oscillation range breaks upwards, the trend continuation is worth anticipating.
Technical Summary: A tug-of-war ≠ weakness; rather, it's a normal state of bullish accumulation. The market is currently digesting profit-taking through oscillations and accumulating energy for the next offensive! ⚡
🎯 Trading Strategy: Focus on support areas, primarily through phased entry.
Long Positions: Plan to enter long positions in batches in the 4160/4170 area, with a stop-loss below 4150, targeting the previous high and even a breakout of the range.
Short Positions: Avoid actively shorting. If the price rises to the key resistance levels of 4230 and 4250 and stalls, then consider a short-term short strategy based on the real-time chart pattern.
Friendly Reminder: If the ADP data tonight is weak again, it may directly push gold to break through resistance! It is recommended that those holding positions keep their stop-loss orders in place, and those with light positions patiently wait for a pullback opportunity. The market always respects risk, but it also rewards keen patience! 🛡️
✍️ Conclusion: The stage for gold has shifted from "whether it will rise" to "at what pace." With the resonance of interest rate cut expectations and technical structures, every pullback could be an invitation for trend investors to enter. Closely monitoring the Fed's direction and holding onto your long positions may be the beginning of gold's shining moment! 🌟

XAUUSD: Focus on the 4280 Resistance LevelGold moved in line with my analysis. After falling to the 4160 support level, it rose again. The short-selling signal brought profits, and the subsequent long-selling signal also generated profits. Next, we will continue to focus on the 4280 resistance level; once it is reached, we can short-sell again.
I send out accurate signals every day to help you gain more profits. Don’t miss out!
