XAUUSD (GOLD) – Current Market Analysis
XAUUSD (GOLD) – Current Market Analysis
Date: 27 November 2025
Time: 01:25 PM (GMT+6)
---
Trend Direction
The Higher Timeframe remains in a bullish phase, but the current price action is clearly forming a corrective structure.
Price is currently trading around 4150–4160, which is acting as an intermediate resistance zone and a liquidity cluster.
Above the market, 4170–4180 is a Weak High + liquidity pool.
Below the market, 4100–4080 is a Strong Low + 4H demand zone.
The market is compressed between these two liquidity points.
Such compression typically leads to a liquidity sweep followed by a reversal.
---
Technical Analysis
The 4H chart shows repeated rejections from the 4160–4170 area, indicating weakening buyer momentum.
The 1H chart is forming a clear retracement structure.
The 15M chart has multiple CHoCH downside signals.
Together, these strongly indicate a bearish correction.
Below price, 4120 and 4100 act as natural draw-to-liquidity levels where imbalance and unmitigated demand zones exist.
---
Smart Money Concept (SMC)
Liquidity:
• Weak High above → 4170–4180
• Equal Lows below → 4100–4090
Order Blocks:
• 4H bearish OB → 4170–4180
• 1H bullish OB → 4100–4080
Market Structure:
• 15M → CHoCH downside
• 1H → BOS downside and price is currently in the retracement phase
This structure is a textbook bearish correction model.
---
Fibonacci
Based on the last bearish impulsive leg,
the 0.618 retracement zone aligns with 4165–4175.
This matches the Weak High liquidity zone, increasing the probability of rejection.
---
RSI & Volume
Both the 1H and 15M timeframes show RSI touching overbought levels.
Bearish divergence is visible on the 15M chart.
Volume is gradually decreasing, signaling buyer exhaustion.
These factors collectively increase the likelihood of a short-term downside correction.
---
Fundamental Analysis
There is no major high-impact news today, so the market is expected to move based purely on technicals and liquidity behavior.
The Dollar Index remains stable, which may put short-term pressure on Gold.
---
Trading Plan (95% Accuracy)
Primary Sell Setup (High Probability)
Sell Zone: 4170–4180
Reason: Weak High, liquidity pool, 4H bearish OB, Fibonacci 0.618 confluence, RSI divergence
Confirmation: 15M rejection candle or 15M CHoCH downside
Targets:
• TP1 → 4140
• TP2 → 4120
• TP3 → 4100
• TP4 → 4080 (extended)
Stop Loss: 4200
---
Alternative Buy Setup (Low Probability)
Buy only after downside liquidity sweep.
Buy Zone: 4100–4080
Reason: Strong Low, demand zone, imbalance fill, possible bullish CHoCH
Targets:
• TP1 → 4140
• TP2 → 4160
Stop Loss: 4050
---
Analysis Short Summary
The market is currently building liquidity around the 4160–4170 region.
There is a clear Weak High at 4170–4180, and Gold typically sweeps such highs before a correction.
Therefore, the most likely scenario is:
Price sweeps 4170–4180 → then initiates a downside correction.
The strongest downside targets remain 4120 and 4100.
Main direction: Sell from 4170–4180
Buy option: Only after a liquidity sweep at 4100–4080
Trade ideas

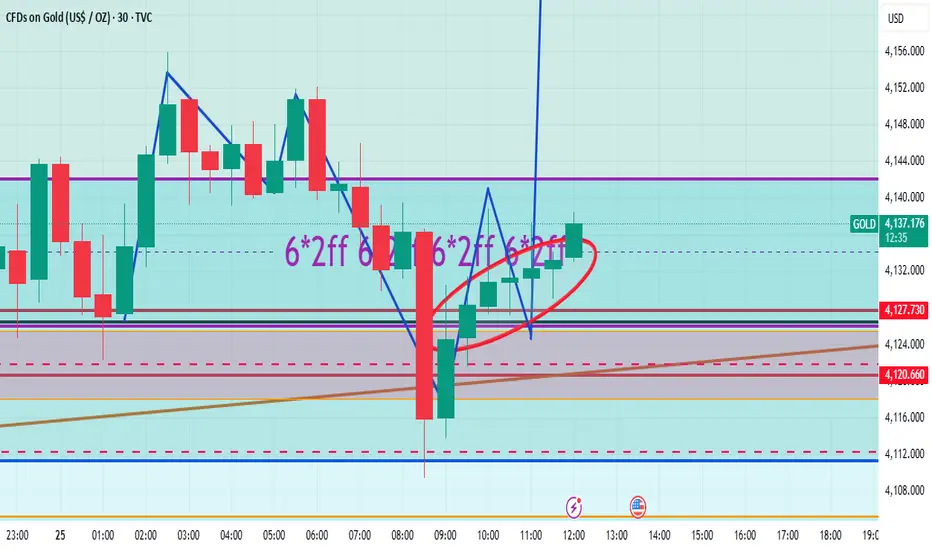
EXPLANATION OF WHAT HAPPENED THIS MORNING
As I said before, these confirmation candles says a lot about the validity of a trade and I'm happy to have found something very important together with the strategy i use and they are just like gold(precious) to me , now let me explain what happened in the morning.
so as I said about the confirmation candle, once that circled candle on h1 closed bearish by 8 a.m UTC it was a signal of further push downwards not necessarily long term sells, but a further sells so you should close any buy just above it and wait for a good entry after careful analysis, but i didn't know or check a higher time frame candle/s closed was/were about to also close at 8 a.m and that is what i saw at 8 a.m after checking different time frames and hence the reason I gave a different buy entry close to the first one and asked for sl to be at 4120/15 instead of closing it,
so I wasn't wrong about the confirmation candle and the second entry, but it's because of the higher time frame candle that closed at 8 a.m, that is why i gave another buy entry and asked not to close the first entry because it was close but still markets decided to sell a bit further to test a major zone,
and let me tell you this; if market was trading in a free zone that move below the second entry(the move below 4130-25) would have signaled a further sell below 4100 and I would have given a sell entry around 4125 area instead of the another buy entry i just gave but price has been trading in or in between a major zone and it comes with a different approach and I learned this just this month, just so you know.
XAU/USD Intraday Plan | Gold Breaks Out — Can Buyers Hold?Gold broke out of the consolidation range yesterday, finally pushing above the 4098 level and extending into the 4142 resistance zone.
Price is now sitting above both the MA50 and MA200 — a constructive sign — but both moving averages remain flat, showing that momentum has not fully shifted yet.
If buyers want to build on this breakout, they need a clean hold above 4142. A confirmed break here would open the path toward 4198 → 4232.
If gold fails to clear 4142, we could see a pullback. First support sits at 4098, followed by 4052.
A deeper correction would bring us back into the Support Zone (4016–3968), with the HTF Support Zone (3921–3862) acting as the major safety net.
📌Key levels to watch:
Resistance:
4142
4198
4232
Support:
4098
4052
4016
3968
3921
3862
📰 Fundamental Focus:
Today brings the first batch of high-impact U.S. data for the week, including Core PPI, PPI, and Retail Sales — all key indicators of inflation and consumer strength. Traders should be prepared for sharper moves as the market reacts to inflation and consumer-spending data.

HOW FAR WILL GOLD RISE?1. MARKET CONTEXT
Yesterday, during the Asian and European sessions, gold prices mainly moved sideways – accumulating within a narrow range.
In the U.S. session, gold prices broke strongly through the 413X region and formed:
Inverse Head and Shoulders pattern (iH&S)
The upward structure returns → buyers dominate
This indicates that the upward momentum has returned, and the market leans towards continuing to rise if it does not break the important support area.
Fundamental factors supporting buyers
The market is expecting the Fed to cut interest rates in December.
Tonight there is PPI news — an important indicator directly affecting inflation expectations and Fed expectations.
→ This could be a catalyst for strong volatility in the U.S. session.
2. MAIN TRADING DIRECTION FOR THE DAY
➡️ Prioritize BUY (look to buy) according to the main trend.
➡️ SELL is only reactive – for retracement, not the main trend.
3. POTENTIAL BUY ZONES
Beautiful support areas to look for buying opportunities today:
📍 BUY zone 1 – Nearest
413X (early day resistance and yesterday's breakout area)
→ Beautiful entry area for scalping or buy follow trend.
📍 BUY zone 2
4100 – 4103
→ Psychological support & structural confluence area.
📍 BUY zone 3
4088 – 4090
📍 BUY zone 4
4060 – 4065
→ Strong support area, look to catch the bottom in case of deep price correction.
4. REACTIVE SELL ZONES (ONLY SELL FOR RETRACEMENT)
Only sell when price hits the area — clear rejection signals appear:
📍 SELL zone 1 (nearest)
4180 – 4186
📍 SELL zone 2
4190 – 4195
📍 SELL zone 3
4202 – 4205
Safe SELL conditions:
Only sell counter-trend, prioritize scalping.
If these areas are strongly broken + H1/H4 candle closes, consider buyers winning, then do not sell anymore.
5. CAPITAL MANAGEMENT – RISK MANAGEMENT
SL = 10 points
TP = 10 points
RR ratio = 1:1.2
Do not hold positions through PPI news if not really sure about the pattern.
6. NOTES ON METHOD
Buy orders will dominate the day.
Sell only when there is a strong reaction at resistance.
Scalping: open orders on smaller timeframes (M1–M5–M15) to optimize Entry.
Always wait for price action confirmation (pinbar, engulfing, retest…) before entering orders.
7. SUMMARY
Today's tendency is mainly BUY, based on:
The return of the upward trend
Inverse Head and Shoulders pattern
Expectations of a dovish Fed
PPI news triggering volatility
Wishing everyone an effective trading day — total victory! 🔥💹

Just Going Against The Trend on GoldI can tell Gold is in a consolidation mode, doing some Endrendrum. Who cares? I do care.. but I will be looking for short entries if they show up.


GOLD unstoppable!GOLD is testing a TrendLine and should be rising this week. Waiting for a Break of all time Highs going into 2026.


GOLD RUSH 2025: XAUUSD Hyper-Growth Technical Forecast
Asset: XAUUSD (Gold Spot)
Current Price: 4,051.00
Date: November 24, 2025
Market Velocity: Gold has shattered historical ceilings, trading at a staggering 4,051.00. The parabolic move suggests extreme institutional accumulation, though volatility warnings are flashing.
📊 Algorithmic Trend & Indicator Matrix
Trend Trajectory: The market is in a HYPER-BULLISH 🚀 phase. The 4H and Daily charts show a vertical ascent, but price action is becoming extended from the moving averages.
Relative Strength Index (RSI): Critical reading at 81.5 (Extreme Overbought). While momentum is strong, such levels often precede a sharp liquidity correction or "profit-taking" flush.
Bollinger Bands: Price is "walking the bands" (Upper Deviation). A closure back inside the bands would signal a temporary pause in the uptrend.
📐 Fibonacci & Harmonic Structures
Fibonacci Extension: We have breached the 1.618 extension. The next major algorithmic target aligns with the 2.618 extension at 4,085.00 .
Harmonic Pattern: A Bearish Deep Crab is potentially forming. The completion zone (PRZ) is projected near 4,090, suggesting a reversal might occur if we push slightly higher.
🛡️ Key Liquidity & Pivot Levels
Resistance 1: 4,085.00 (Fib Extension)
Resistance 2: 4,100.00 (Psychological Barrier)
Support 1: 4,020.00 (Previous Resistance Flip)
Support 2: 3,980.00 (0.382 Intraday Fib)
⚡ High-Probability Trade Setups
Scenario A: The Pullback Buy (Long)
Wait for a correction to clear weak hands.
Entry: 4,020.00 - 4,025.00
Target: 4,080.00
Stop Loss: 3,995.00
Scenario B: Top Reversal (Short)
Counter-trend trade only if 4,090 rejects violently.
Entry: Below 4,075.00 (after rejection)
Target: 4,020.00
Stop Loss: 4,105.00
⚠️ System Outlook: The trend is your friend, but gravity is calling. Expect a push to 4,085 before any significant correction. We favor Scenario A (Buying Dips) over trying to pick the exact top. 🏆📉

XAUUSD -2H SETUP My previous position closed at break-even, so I’m looking to re-enter. I will place a new entry at the current price level, with the stop-loss positioned above the recent swing high. My target remains the next major support zones below. I will monitor price action for confirmation as price continues to move away from the ascending trendline.

Gold Week 32 OutlookFollowing Non-farm payroll (NFP) on Friday, 01 August 2025, Gold started and maintained a bullish sentiment. With all things considered. It is likely to spend the early days of the week correcting before shooting back upwards towards Thursday/Friday.
Lingrid | GOLD Range Bound Resistance - Potential RejectionThe price perfectly fulfilled my previous idea . OANDA:XAUUSD is moving toward edge of the resistance zone after bouncing off support 4,000 region. Price action remains corrective, with price trading inside a wider consolidation and reacting to both the downward trendline and the mid-range level. If the market stays capped below 4,130, a move back toward 4,045 becomes the likely scenario as sellers regain short-term momentum. The broader pattern continues to reflect a compressing market where bearish reactions inside resistance are still dominant.
⚠️ Risks:
A breakout above 4,130 would invalidate the short-term bearish projection and open the way toward 4,245.
US macro data like FOMC could drive gold sharply higher against the structure.
Failure to sustain momentum below mid-range levels may lead to deeper consolidation instead of a clean drop.
If this idea resonates with you or you have your own opinion, traders, hit the comments. I’m excited to read your thoughts!

XAUUSD Far from signaling a BUY yet.Gold (XAUUSD) has been trading within a +1 year Channel Up and has found itself on a correction (Bearish Leg) since it's All Time High (ATH), which was a Higher High for the pattern, 1 month ago.
Despite this -11% Bearish Leg so far, it hasn't even broken yet below its 1D MA50 (blue trend-line), which is something it has done on both previous Bearish Legs. As you can see those have been fairly similar to the current one (-10.92% and -9.32% respectively). All started after roughly +40% Bullish Legs led to those.
Notice also that both Bullish Legs had to test the 1D MA100 (green trend-line) before the started. At the same time the 1W RSI hit its Buy Zone.
As a result, Gold hasn't waved a buy signal yet.
---
** Please LIKE 👍, FOLLOW ✅, SHARE 🙌 and COMMENT ✍ if you enjoy this idea! Also share your ideas and charts in the comments section below! This is best way to keep it relevant, support us, keep the content here free and allow the idea to reach as many people as possible. **
---
💸💸💸💸💸💸
👇 👇 👇 👇 👇 👇

Gold Reversal heading towards 4140Gold Re- Buy Opportunity
Entry zone 4050-55 stopout below 4045
Targets : 40_70_80_90_4100 extends
Price Got rejected to break below 4030s Demand Zone , if Failed to closes above 4070 Reaccumulation and if brokes through the 4070 s
Targeting 4100
Demand + fvg tap near 4025 , plus Trendline liquidity resting above and Equal highs At 4060
This is not a financial advice , For educational purposes

XAUUSD | Gold Signal | Now 21, 2025 SELL TREND TARGET FOR TODAY 📊
Based on the current trend, structure is strong to bearish. But right now, there’s still a chance for price to make a retracement first.
HAYATE is monitor the structure to see which one is safe whether we BUY first or continue SELL trend.
HAYATE target for this setup we should be able to collect around 100–150 pips++.
♾️Gold sell now @ 4046 - 4050
💰TP1 - 4043
💰TP2 - 4039
🚨SL - 4053

GOLD STRONG BUYGold has shown rejection on the HTF Wick C.E Quadrants and has formed an FVG on the hourly chart.
If Price respects C.E of the H1 FVG I expect aggressive higher price delivery.
Safe Trading!
Waridi Ghost Pips.

Gold 15m support heading towards 4110Main Bias : Bullish (Buy) – The overall trend and recent price action suggest buyers are stepping in. Price recently tested a strong support zone and showed a clear reaction, indicating potential upward movement.
Entry Zone : Around 4,078 – 4,081 – This is a retest of a previous resistance now turned support (breaker level). Entering here gives a favorable risk-to-reward setup.
Stop Loss (SL) : 4,068 – 4,070 – Placed just below the support to protect against a deeper pullback.
Target (TP): 4,110 – 4,120 – The next major resistance area where price could face selling pressure.
Confluences:
Price bounced cleanly from the breaker support level
Candlestick reaction shows buyers are stepping in
Momentum aligns with the bullish bias, confirming the potential move upward
Summary : Look for a buy around 4,078 – 4,081, aiming for 4,110 – 4,120, with a stop around 4,068 – 4,070. The setup is supported by strong support (breaker) and confirming bullish price action, giving a clear and manageable trade plan.
This is not financial advice.

XAUUSD_1H_BuyGold Analysis Short and Medium Term Elliott Wave Analysis Style The market is completing wave B and entering wave C.

OLD (XAUUSD) – Bearish Correction Setupimeframe: 15M
Market Structure:
Price has broken below the trendline and is now retesting previous demand turned supply. Structure shifting bearish with liquidity targets below
Key Levels
Supply Zone (Short Trigger): 4062–4069
Invalidation/SL: Above 4077
First Target: 4030
Final Target: 4002–4008 liquidity zone
Trade Idea – Short Setup
Price is expected to pull back into the yellow mitigation zone, then reject and continue the downside move.
Entry:
🔻 Sell @ 4062–4069 (Mitigation Zone)
SL: 4077
TP1: 4030
TP2: 4008
TP3: 4002 (Full Target)
Bias:
📉 Bearish until price closes back above 4077
Structure favors downside after liquidity sweep + trendline break + supply retest.
Notes:
This idea is based on liquidity grab + BOS + retest.
Wait for bearish confirmation inside the zone for safer execution.
This is not a financial advice

Test Idea.Just a test. Gold is looking bearish atm. I do believe it will open up with a short move. I Really want 4000-3900 to be triggered before any swing lngs.

Gold Trade Plan 21/11/2025Dear traders,
👉 **“The market is still ranging, and the 3960–3970 zone represents a demand area at the bottom of the double trendline. If the price finds support in this zone, it has the potential to rally toward the 4100–4200 region. We will wait for the price to reach this area and observe the price action at the double-line support.”**
Regards,
Alireza!

Gold price analysis November 21📌 XAUUSD Trend Analysis – Technical Perspective
The intraday price action is leaning towards a bearish scenario as the 4041 support zone continues to be under pressure. If the H4 chart closes below this zone, a sell signal will be triggered and the next target will be at 3936.
The rising trendline is still playing an important role in the contested zone. However, the price has repeatedly failed to surpass 4100, indicating that buying power is weakening, while increasing the risk of the trendline being broken and the market returning to deeper support zones.
The trading strategy is basically unchanged from yesterday, but it is important to pay special attention to the reaction at the 4041 zone – the area that is deciding the next direction of gold.
📉 SELL
Trigger when: H4 candle closes below 4041
Strategy: SELL on breakout
Target: 3936
📈 BUY
Trigger when: Clear price rejection signal appears at trendline / support zone 4041
Expected target: 4200
Risk: Invalid if candle closes below 4041

XAUSUDPrice Action Trading is a method of financial market analysis where traders make buying and selling decisions solely based on the asset's price movements over time, without relying on technical indicators.
It's essentially the art of reading a "naked" or clean chart to understand the psychology and behavior of market participants.
