Gold waits for a pullback to support before considering buyingYesterday, as the U.S. market was closed for Labor Day, market liquidity and volatility decreased, and gold basically did not fluctuate.
Gold prices rose again at the open today, pushing the all-time high to 3508, but only barely breached it, remaining under pressure from the 3500 level.
Yesterday I said that 3500 is crucial and if it cannot break through, there will be a correction. This view is currently being verified.
In addition, I am determined not to chase high prices anymore, especially when it approaches the 3500 mark. If you want to continue buying gold, I believe you should wait until the price retraces to support around 3450 or 3430 before considering it.
📣If you have different opinions, please leave a message below to discuss
GOLD trade ideas

Gold 15M Analysis | Key Triggers Ahead💀 Hey , how's it going ? Come over here — Satoshi got something for you !
⏰ We’re analyzing AAVE on the 4-Hour timeframe timeframe .
👀 On the 15-minute timeframe, gold can be traded using these alarm zones.

XAU/USD 1H | Correction in the Cards… or More Bullish Run Ahead?Have we reached peak gold… or is the rally just taking a rest?
Gold has climbed to record highs, but the charts may be flashing warning signs. With RSI pushing into extreme overbought territory and a rising wedge pattern forming, is this the moment where bulls take a breather… or are we about to see another explosive move?
Technical Overview
Timeframe: XAU/USD – 1H
Trend: Overall Bullish (confirmed on higher timeframes)
Divergence: Significant Bearish Divergence spotted on 1H; no divergence on 4H
RSI Level: At 79.6 — indicates overbought conditions that often precede a pullback at 4H TF.
Pattern: Rising Wedge forming on the 1H
Harmonics: NIL
Bias: Bearish
Strategy: Sell Short Entry at breakout of previous Higher Low (HL)
Trade Setup
Entry: Short Sell @ 3465
Stop Loss: 3512
Take Profit: 3418
Supporting Fundamentals:
All-Time Highs Reached: Gold has surged above $3,500, supported by inflation concerns, Fed rate cut expectations, and safe-haven demand
Institutional Demand: Ongoing central bank accumulation and ETF inflows are fueling price strength
Macro Tailwinds: Heightened geopolitical risks and weakening USD sentiment continue to benefit gold as a refuge asset.
These fundamentals may remain bullish long-term, but with overbought conditions and chart warning signs, a temporary correction looks more probable first.
Will gold finally take a breather from the rally, or is this overbought signal just a minor pause?
Drop your thoughts below!
Like, share, and follow for more high-confluence trade setups.
#XAUUSD #GoldTrading #Forex #TradingView #TechnicalAnalysis #BearishDivergence #RSIOverbought #RisingWedge #SafeHaven #GoldCorrection #HarmonicPattern #CommodityTrading #GoldPrice #TradeSetup #ForexSignals #SwingTrading #MacroTrading #RiskManagement #TradeSmart #MarketAnalysis #SafeHavenAsset #GoldPullback #FedPolicy #Geopolitics #CentralBank #ETFInflows #PriceAction #ChartPatterns #1HChart #TradingStrategy
⚠️ Disclaimer: This is not financial advice. Always assess your own risk before trading.

XAUUSD (1D) Bullish Breakout Above Range|BULLISH SCENARIO HH/HLFOREXCOM:XAUUSD
Structure | Trend | Key Reaction Zones
Gold has broken out of a long-term accumulation range between 3243 – 3499, showing strong momentum. Current structure favors bulls while staying above 3430 key support.
Market Overview
Price spent weeks consolidating, defending demand zones, and now buyers have regained control with a clean breakout. As long as gold sustains above 3430 pullback support, momentum suggests upside continuation. However, overextension near resistance may cause short-term pullbacks before continuation.
Key Scenarios
✅ Bullish Case 🚀 →
🎯 Target 1: 3499
🎯 Target 2: 3540
🎯 Extended: 3600
❌ Bearish Case 📉 →
🎯 Downside Target 1: 3430
🎯 Downside Target 2: 3243
Current Levels to Watch
Resistance 🔴: 3499 – 3540
Support 🟢: 3430 – 3243
⚠️ Disclaimer: This analysis is for educational purposes only. Not financial advice.

XAUUSDGold is in a correction phase, with prices likely to retest the support zones of 3321 and 3269.
However, if gold prices can hold above 3249, we expect the gold trend to be in an uptrend, consider buying the red zone.
(Very Risky Trade)
🔥Trading futures, forex, CFDs and stocks carries a risk of loss.
Please consider carefully whether such trading is suitable for you.
>>GooD Luck 😊
❤️ Like and subscribe to never miss a new idea!

Whether gold can break through 3500 becomes the keyGold fell at the opening today before rising. Following the US Court of Appeals for the Federal Circuit's ruling that Trump's tariffs were illegal, the market rebounded strongly, reaching a high of 3489, edging closer to its all-time high.
Our sell order on Friday was hit by the stop loss of 3460 because we did not close the profit in time, which unfortunately ended our continuous profit streak.
As the gold price approaches its historical high, the resistance it faces from above will certainly become stronger. It is very critical whether it can break through 3500 in the next two days. If it fails to break through, it will face a decline.
Therefore, you must not chase the current rise in gold, at least before it breaks through 3500 or retreats to the support below.
The US market is closed today for Labor Day, reducing liquidity and volatility. Therefore, I don't anticipate many good trading opportunities. Everyone should relax and take it easy. I'll notify you if I see a good opportunity.
Reaccumulation. Breakout. Distribution.
Gold. 120 days of reaccumulation.
The cT scenario looks like the base case — aiming for 3550–3600.
I’m working this setup.
What comes next is likely years of volatile distribution OANDA:XAUUSD COMEX:GC1!

GOLD M15 DIRECTION Hello Welcome Back 🙏
Gold Selling Area > 3485
Reason > Strong Resistance & CRH Strategy
Gold Buying Area > 3354, 3345
Reason > Bullish FVG , CISD Strategy
Hope You Got It , Dont Forget To Follow Us And Boost The Post

Gold Surges Above Expectations, Reaches 5-Week Highs!👋Hello everyone, let’s take a look at OANDA:XAUUSD !
📍Gold continues its impressive rally, even surpassing our previous expectations and reaching the highest levels in 5 weeks. Currently, the bullish momentum is intact, trading around $3412 and surpassing the key psychological level of $3400, gaining over 300 pips from the previous session.
The recent surge in gold is largely driven by concerns over the Fed. Pressure from Trump is fueling speculation that the central bank could cut rates faster and keep them low for a longer period. The CME FedWatch tool shows that investors now expect an 87% chance of a rate cut in September, which is beneficial for gold prices.
📈From a technical perspective: Gold has broken through the $3400 level and closed clearly above the resistance, turning it into new support. The EMA 34 and 89 still favor the bulls, and our strategy will prioritize selling at the top and continuing to buy as long as support holds. The target for the strategy is $3430–3433 USD (D1 resistance).
What do you think💬? How will gold move, and what will the price be at the close today?
✍️ Leave your thoughts in the comments!

XAUUSD: Market Analysis and Strategy for September 1stGold Support and Resistance:
Daily Chart Resistance: 3500, Support: 3405
4-Hour Chart Resistance: 3490, Support: 3422
1-Hour Chart Resistance: 3490, Support: 3454
News: Gold continued its upward trend in Asian trading on Monday, reaching a high of $3489.8, a new high since April. The market generally expects the Federal Reserve to cut interest rates by 25 basis points in September, with the CME tool showing an 87% probability of a rate cut. This has led to a continued weakening of the US dollar, providing support for non-interest-bearing gold. At the same time, growing market concerns about the Federal Reserve's independence have further weakened the dollar's appeal and increased gold's safe-haven value.
Technical Analysis: The daily candlestick chart is currently maintaining a relatively stable upward trend along the short-term moving average. There are no signs of a peak in the short term. Focus on the resistance zone around 3500 in the short term. Spot gold's 4-hour MACD is currently forming a golden cross with high volume, and the STO indicator is overbought, indicating a bullish trend in the 4-hour chart. Current support lies near the MA5 moving average, corresponding to 3447, followed by the MA10 moving average, at 3430. The NY market is focused on potential selling pressure above 3495-3510, while short-term support below is expected in the 3456-3447 range. My personal recommendation: Buy on dips!
Tonight gold trading recommendations:
BUY: near 3451-3456.
BUY: near 3437-3442.
Consolidation near historical highs is occurring, with increasing buyer/seller liquidity. Use a small S-L position for trading!

Gold (XAUUSD) – 1st Sep, Bullish Bias, Watching 3438–3445 ZoneGold (XAUUSD) Analysis – 1st September
Market Structure
H4 Trend : Bullish
M15 Trend : Bullish
Both timeframes are aligned, confirming a strong bullish bias.
Current Phase
Price is retracing from 3489–3490 after a sharp bullish impulse, putting the market in a pullback phase.
Key Zone (POI)
Demand Zone: 3438–3445
This is the key area of interest where buyers may step back in.
If price retests and respects this zone with LTF confirmation, a long setup targeting higher levels will be in play.
Execution Plan
Wait for LTF bullish confirmation (structure shift) inside the zone.
If the zone fails, stay out and re-analyze.
Bias for Today
🔹 Bullish, favoring long setups from 3438–3445 demand zone.
📘 Shared by @ChartIsMirror

GOLD MARKET ANALYSIS AND COMMENTARY - [Sep 01 - Sep 05]This week, the international OANDA:XAUUSD price increased quite strongly from 3,352 USD/oz to 3,453 USD/oz. The reason for the continued increase in gold price is because investors are still expecting the FED to cut interest rates by 0.25% at the upcoming September meeting, as well as the conflict between the Trump administration and the FED.
Next week, financial markets in the US will be closed for Labor Day on Monday. On Tuesday, the Institute for Supply Management (ISM) will release its manufacturing PMI data. The PMI is forecast to increase slightly to 48.6 in August from 48 in July. If the forecast is correct, it will have a negative impact on gold prices next week.
In addition, on Friday, the US will release the August non-farm payrolls (NFP) report. If the NFP continues to decline compared to the expected 74,000 jobs, it will force the Fed to cut interest rates in September, which will have a positive impact on gold prices next week. On the contrary, a stronger-than-expected NFP growth, combined with an unchanged unemployment rate of 4.2%, could make the market tilt towards the Fed continuing to delay interest rate cuts, causing gold prices to fall next week. However, given the current US economic situation, the August NFP may continue to decline.
📌Technically, on the H4 chart, the gold price broke the Trendline and it is likely that the price will continue to increase to near the threshold of 3500 USD/oz. In case the price corrects again, it will return to the resistance zone at the threshold of 3370.
Notable technical levels are listed below.
Support: 3,430 – 3,400 – 3,371USD
Resistance: 3,450 – 3,500USD
SELL XAUUSD PRICE 3541 - 3539⚡️
↠↠ Stop Loss 3545
BUY XAUUSD PRICE 3369 - 3371⚡️
↠↠ Stop Loss 3365

3500! Gold price returns, buying power remains⭐️GOLDEN INFORMATION:
Gold (XAU/USD) regained momentum in Asian trading Monday, climbing to a fresh five-month high near $3,470 as dovish Fed expectations overshadow profit-taking. Recent U.S. inflation data strengthened bets on a September rate cut, while last week’s upbeat GDP and jobless claims reports briefly supported the Dollar, capping bullion’s gains.
⭐️Personal comments NOVA:
Bulls dominate, strong bullish momentum. Gold price waiting to return to ATH 3500
⭐️SET UP GOLD PRICE:
🔥SELL GOLD zone: 3498- 3501 SL 3505
TP1: $3490
TP2: $3480
TP3: $3470
🔥BUY GOLD zone: $3446-$3444 SL $3439
TP1: $3458
TP2: $3470
TP3: $3480
⭐️Technical analysis:
Based on technical indicators EMA 34, EMA89 and support resistance areas to set up a reasonable BUY order.
⭐️NOTE:
Note: Nova wishes traders to manage their capital well
- take the number of lots that match your capital
- Takeprofit equal to 4-6% of capital account
- Stoplose equal to 2-3% of capital account

GOLD breaks above $3500 – New ATH every day! What’s next?Gold (XAUUSD) is entering its hottest phase, moving 50–60 points per day with explosive volatility. Price is now reacting at a key FIBO extension resistance, where SELL pressure has appeared but still lacks strong confirmation on higher timeframes (H1–H2).
📊 MMFLOW VIEW
Sideway → Breakout → Consecutive All-Time Highs (ATH).
FVG zones & Key Liquidity levels are still supporting the BUY side.
SELL setups remain secondary and only valid with clear volume confirmation.
Main scenario: Wait for liquidity retest → Focus on BUY setups.
🔑 KEY LEVELS
Resistance: 3440–3446 (ATH) | 3564 | 3576 | 3586 | 3595
Support: 3528 | 3508 | 3494 | 3480 | 3468
🎯 MMFLOW PLAN
✅ BUY ZONE: 3481 – 3479
SL: 3474
TP: 3486 – 3490 – 3495 – 3500 – 3510 – 3520 – 3530 – ???
✅ BUY SCALP: 3496 – 3494
SL: 3490
TP: 3500 – 3510 – 3520 – 3530 – 3540 – ???
❌ SELL ZONE: 3576 – 3578
SL: 3584
TP: 3570 – 3565 – 3560 – 3555 – 3550 – 3540 – 3530 – 3520 – 3510 – 3500
⚠️ Warning: GOLD is in a high-volatility phase – wrong entries can get wiped out instantly.
👉 Be patient, wait for Key Levels, and stick to proper RISK MANAGEMENT above all.
🔥 This is the MMFLOW TRADING PLAN – follow us to stay updated and catch the next big moves in GOLD!

Trading strategy is still BUYGold has reached Target 3320 and continued to see some profit taking from investors in the Asian session. Today's Gold price may move similarly to yesterday with Asia and Europe falling and the US rising. Continue to wait for corrections to Buy is today's intraday strategy. Today's Target 3328. If broken absolutely do not SELL until there is at least confirmation from the H4 candle selling pressure.
BUY at support zones when there is confirmation from buyers entering the market. Attention support zones 3402-3390-3375

XAUUSD – A New Bullish Wave Has BegunXAUUSD – A New Bullish Wave Has Begun
The Daily chart shows that gold has decisively broken above the flat resistance around 3,500 , marking a strong breakout after months of consolidation. This move completes the Ascending Triangle formation, confirming that buying pressure is in control.
In the short term, after the recent surge, the market may retrace slightly toward the 3,500–3,520 zone to retest this new support. If this level holds, the bullish trend is likely to continue, paving the way for further upside.
Key levels to watch:
Major Support: 3,500–3,520
Immediate Resistance: 3,575–3,600
Next Target: 3,700–3,750-3,800 if momentum remains strong
Technical signals remain aligned with the bulls. Any pullback should be seen as an opportunity to join the prevailing uptrend.
Do you think gold will push toward the 3,700 mark in this bullish wave?

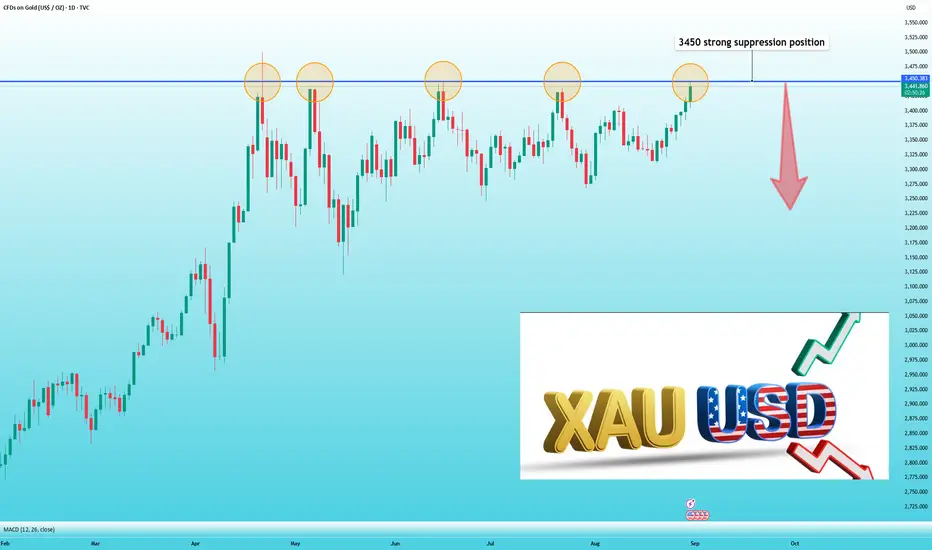
Gold encounters a strong pressure level, you can sellAs I said just now, the rise of gold has encountered resistance at 3450. From the previous trend, we can see that there is strong pressure near 3450. It has failed to break through here effectively for four consecutive times. It is hard to say that the gold price will not fall back again when it comes here again. Therefore, I think it is possible to consider shorting near 3450 and set a stop loss at 3460.
📣If you have different opinions, please leave a message below to discuss
GOLDGOLD has been quite bullish last month, this month we are expecting it to slow down to a bit early part and then take the top once more.
Disclosure: We are part of Trade Nation's Influencer program and receive a monthly fee for using their TradingView charts in our analysis.

GOLD XAUUSD - Pullback Expected before the Next Leg UpGold (XAUUSD) has been on a solid bullish run, consistently pushing higher after each minor retracement. Now, we’re eyeing a potential pullback toward a key support zone at 3420–3400, where buying interest is likely to resurface.
If price action confirms a bounce from this zone, we could see a continuation of the uptrend toward 3450, and if momentum holds, possibly stretching to 3490–3500.
🔻 Trade Setup – Long Opportunity on Pullback
Entry: Buy Gold (XAUUSD) at 3420
Add-on Dip: 3400
Targets: 3450, then 3490–3500 (marked on chart)
Invalidation: Daily close below 3385
📌 Risk/Reward Outlook
This setup presents a tight risk with attractive upside potential. As always, stick to solid risk management and size your positions based on your personal trading plan.
👍 Agree with this view?
Drop a like, leave your comments, and let’s discuss this setup together!
Your feedback keeps the community sharp and growing. 🔥
Happy Trading,
– The InvestPro Team

keep growing, old ATH 3500✍️ NOVA hello everyone, Let's comment on gold price next week from 09/01/2025 - 09/05/2025
⭐️GOLDEN INFORMATION:
Gold (XAU/USD) rebounded sharply Friday, erasing early losses to hit $3,447—its highest since June 16—after PCE inflation data met expectations and the Dollar softened. The metal is up 0.85%, supported by Fed rate-cut bets, safe-haven demand, and lingering geopolitical uncertainty, with dips seen as buying opportunities in a strong bullish trend..
⭐️Personal comments NOVA:
Gold price breaks out, market grows thanks to expectations of interest rate cut in September, gold price waits to reach old ATH 3500
🔥 Technically:
Based on the resistance and support areas of the gold price according to the H4 frame, NOVA identifies the important key areas as follows:
Resistance: $3451, $3482 , $3538
Support: $3397, $3363
🔥 NOTE:
Note: Nova wishes traders to manage their capital well
- take the number of lots that match your capital
- Takeprofit equal to 4-6% of capital account
- Stoplose equal to 2-3% of capital account
- The winner is the one who sticks with the market the longest

XAUUSD - Measuring with FibonacciWith Fibonacci Extention, we could measuring the rate of increase in gold price.
Since Oct 2022 ( 1617 price level ), the price has been increased 200%.
Will this increase continue to the 261% level ?
So far, the trend line is still holding back the gold price bullish movement. We'll see in the near future.

Gold and GVZ bargain dealGold usually trades with an upside bias
it's a go-to hedge against all sorts of risks
such as inflation,market crashes, geopolitical messes, you name it
When gold rips higher, its volatility (GVZ) tends to spike
However, this latest rally has been strong without being crazy
So GVZ (Gold vol) hasn’t gone wild yet
See what happened the last time

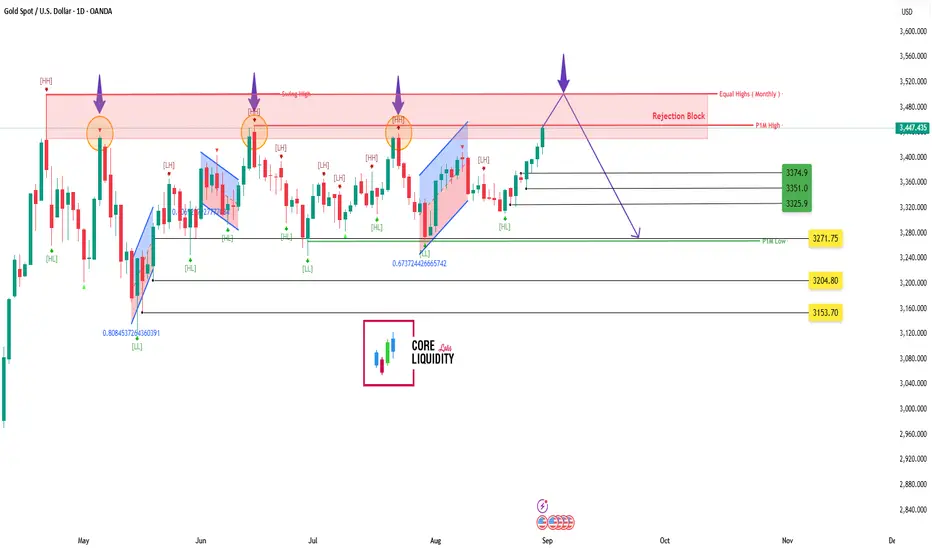
Gold at Monthly Equal Highs | Weekly + Daily Closing in Focus
Gold is testing a massive rejection block near **3440–3480**, the same zone that has rejected price multiple times before.
📈 Bulls want a breakout to claim monthly equal highs.
📉 Bears are eyeing a liquidity sweep followed by reversal back to key demand zones.
**Bullish Scenario:**
* Strong daily/weekly close above 3480
* Opens path towards fresh highs
**Bearish Scenario:**
* Failure at rejection block
* Drop towards 3375 → 3325 → 3271 targets
**Key Levels:**
* 3480: Rejection Block / Equal Highs (Monthly)
* 3375–3325: Mid Support Zones
* 3271–3153: Deeper Demand
💬 First position holder is decided here — monthly equal highs vs strong rejection zone. Who wins?